Lecture 4: Correlational & Experimental Study Designs
1/33
There's no tags or description
Looks like no tags are added yet.
Name | Mastery | Learn | Test | Matching | Spaced | Call with Kai |
|---|
No analytics yet
Send a link to your students to track their progress
34 Terms
Correlational Designs
Measuring two things that can vary in their levels
In psychology, often involves self-report
Any study that involves only measured variable (ie. no manipulated variables) is correlational in nature
What is Construct Validity?
Make sure to think about construct validity for each variable
Questions to ask
How well each variable measured?
Does the measure that is used have good reliability
Is the measure capturing the construct that it is intended to measure?
What evidence is there for face validity? What about convergent & discriminant validity?
Statistical Validity
How strong is the relationship?
How precise is the measurement?
Has it been replicated?
Could outliers be affecting the association?
Is there restriction of range?
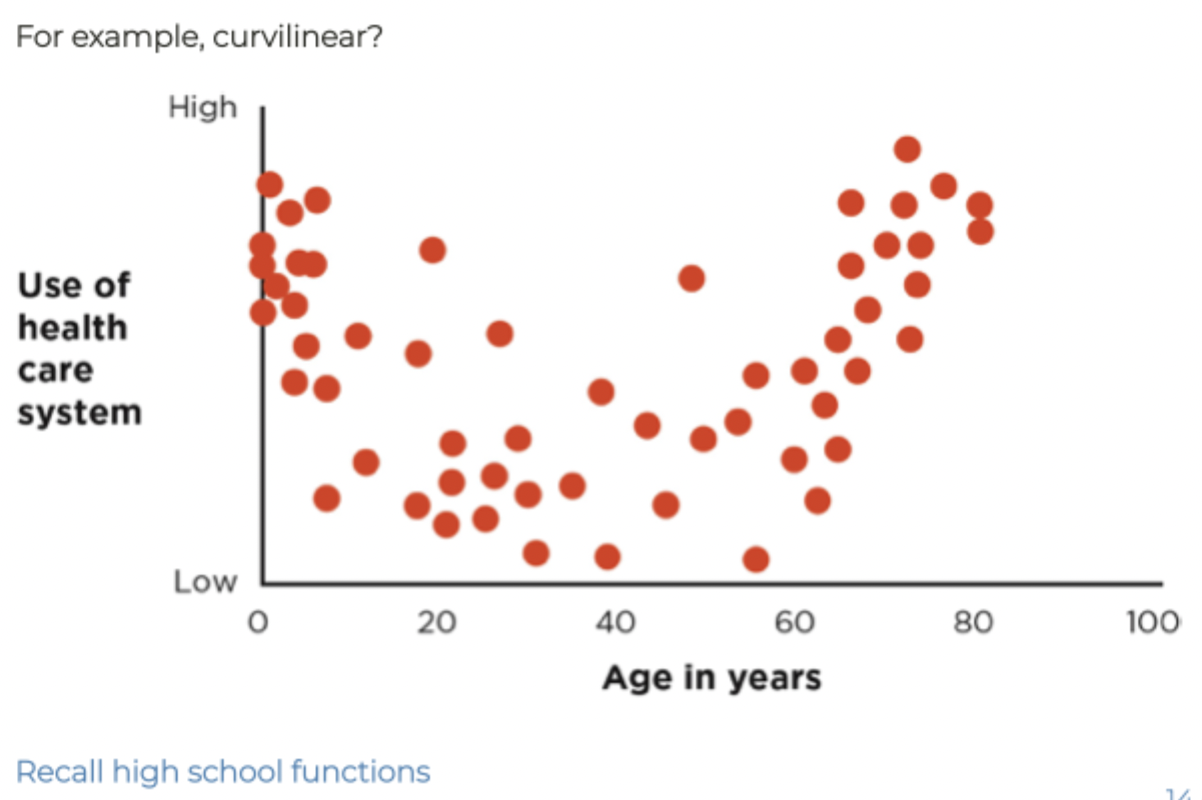
Is the association curvilinear?
How strong is the relationship? R value & P value
R Value
Describes how closely the data points fit to the line of best fit
Transform R2 for a measure of effect size
The proportion of variance in the Y (outcome) variable that is attributable to variance in the X variable
P Value
Describes whether or not the slope of the line of best fit is significantly different from 0 (the expected slope assuming that no relationship exists)
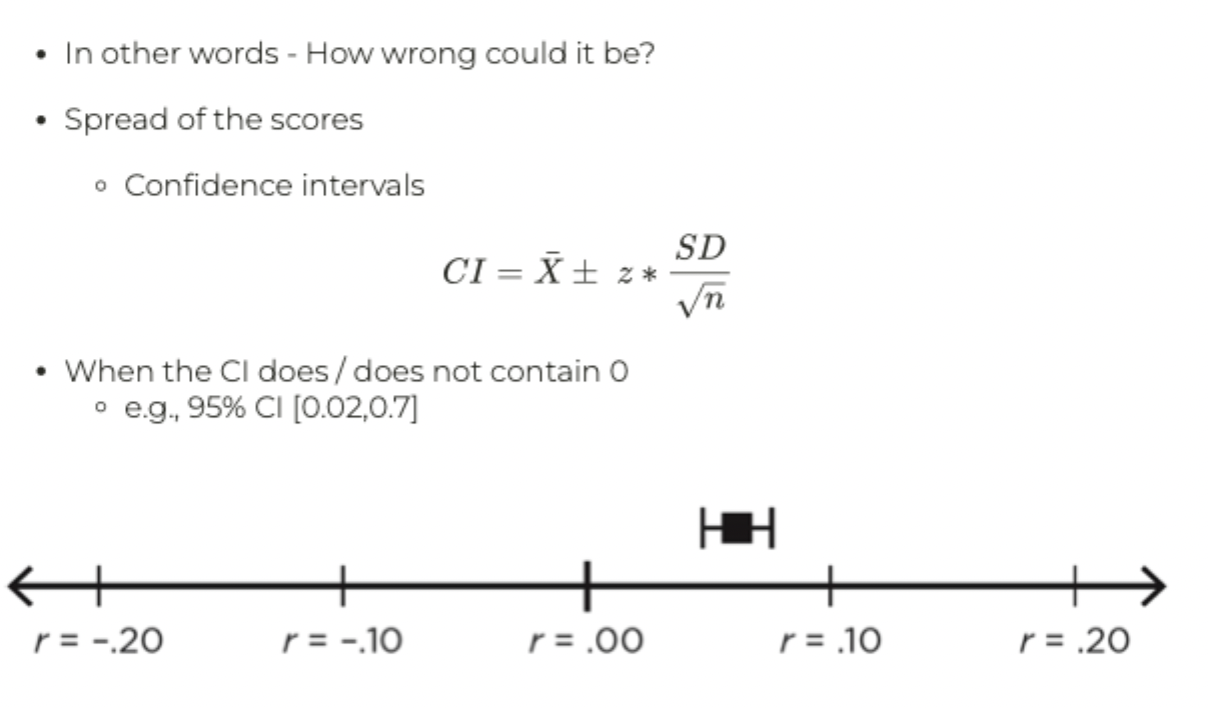
How precise is the estimate?
How wrong could it be?
Spread of scores
Confidence internals
When the CI does/does not contain 0
ex. 95% CI (0.02, 0.7)
Statistically significant as it does not include 0
Both bars fall below 0
What affects the CI?
Variability component
As error variability decreases, the 95% CI will become narrower (more precise)
Use precise measurements, reduce situation noise or studying only one type of person or animal
Sample size component
As sample size increases, the 95% CI will become narrower (more precise)
Increase the number of participants studied
Constant (such as z or t)
In a 95% CI, the constant is at least 1.96
We have no real control over the constant when we estimate a 95% CI
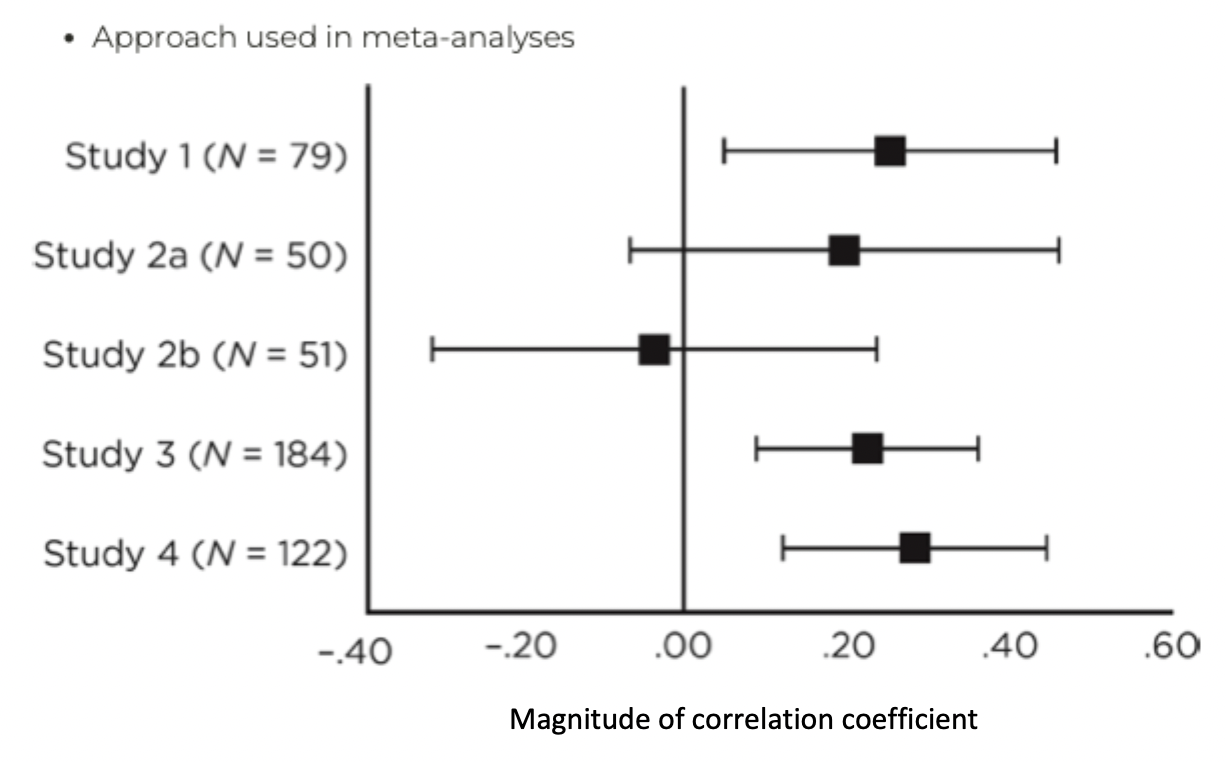
Has the study been replicated?
Magnitude of correlation coefficient +- 95% CI
Study 1, Study 3, Study 4 statistically significant
Study 2a, 2b not statically significant, error bar crosses over 0
No separation, all overlap
If CI overlap these studies result not statistically different from one another
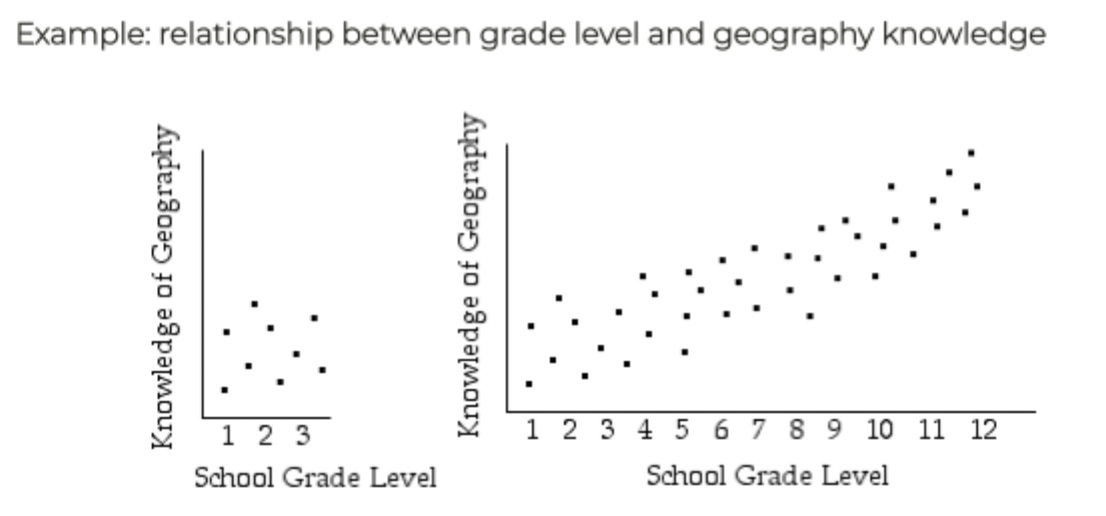
Positive association between the variables
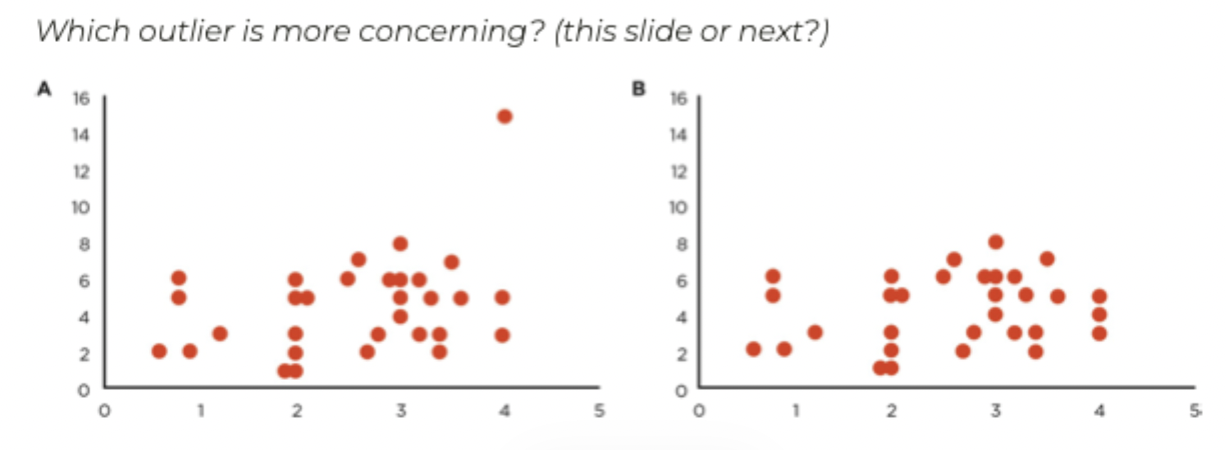
What are outliers?
An outlier is an extreme score that can be defined using field-specific standards
Doesn’t follow pattern of the other data points
Could there be a restriction in range?
Could the association be nonlinear?
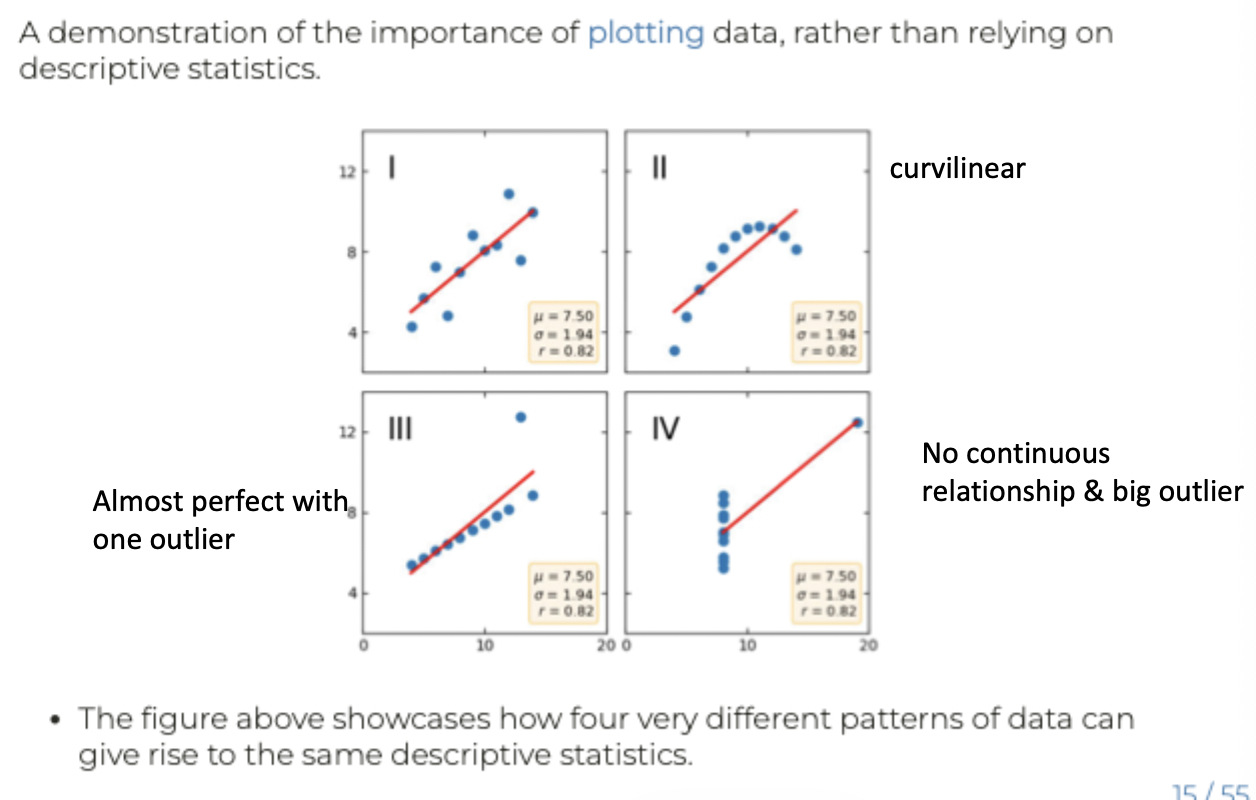
What is Anscone’s Quartet?
A demonstration of the importance of plotting data rather than relying on descriptive statistics
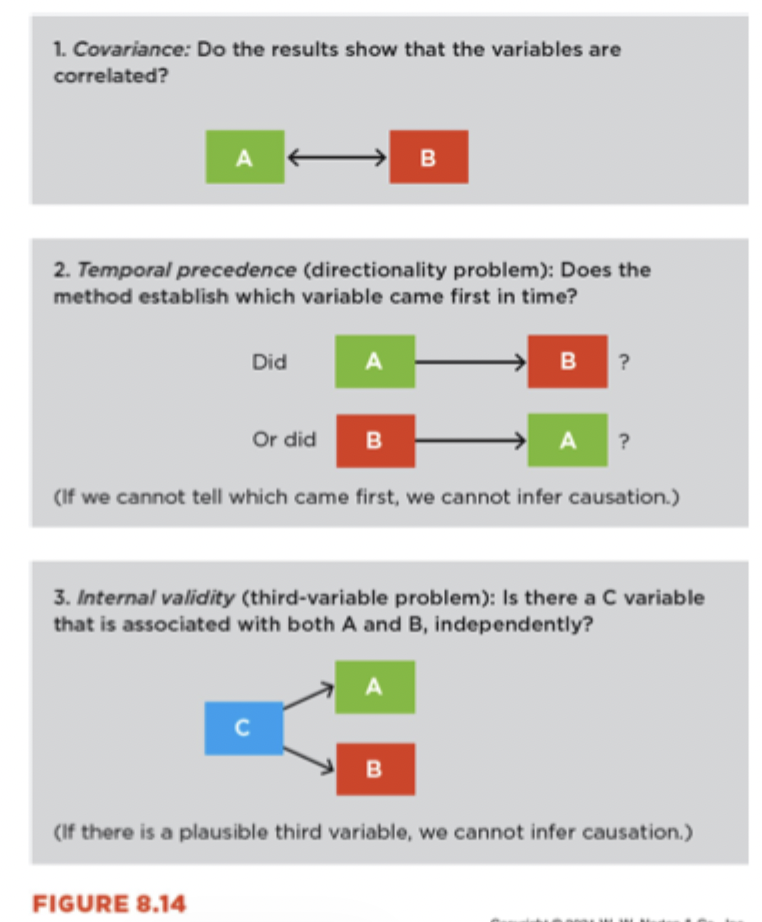
What are the 3 criteria for causality?
1) Covariance
o the results show that the variables are correlated?
2) Temporal precedence
Directionality problem
Does the method establish which variable came first in time?
If we cannot tell, we cannot infer causation
3) Internal Validity (The Zs)
Is there a C variable that is associated with both A and B?
Correlation Summary
Correlations (associations between exactly 2 values) are the core of many of the statistics that we do in social science research
What is multivariate correlational research?
Involves multiple IVs and/or DVs
In many cases, participants cannot be randomly assigned to a variable
We cannot assign things like preferences
Ethical considerations

Longitudinal Research Designs
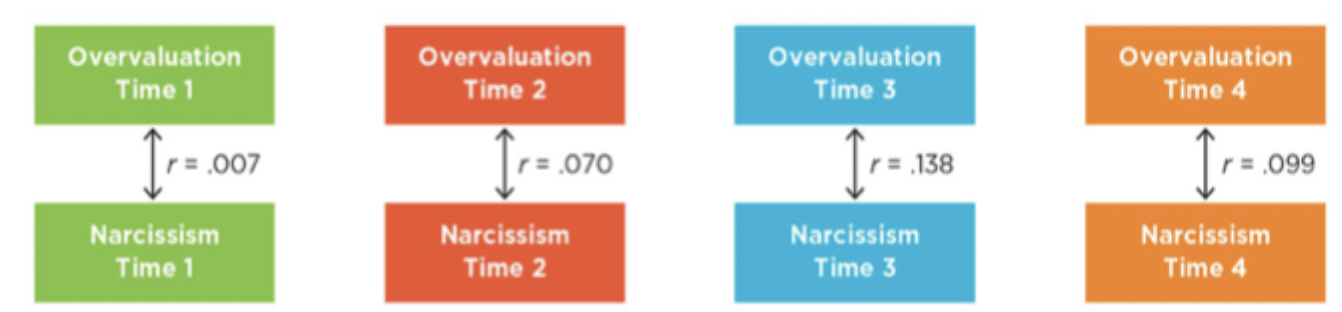
Longitudinal Research Designs: Cross-Lag Correlations
Aims to establish temporal precedence
Vulnerable to auto-correlation & effects are rarely clean cut
Overvaluation consistently predicting narcissism at next time point
Narcissism not predicting overvaluation
Still cannot make a casual claim.
No internal validity
Many other factors influencing this relationship
Auto correlation idea that data measured across time, longitudinal, showcase incremental change, small changes over time result in big change, but over periods of time many small changes
Ex. Weather, huge range of weather -40, 40. no -40 one day and +40, more incremental chances, colder to warmer
Ex. Stock market; more incremental change
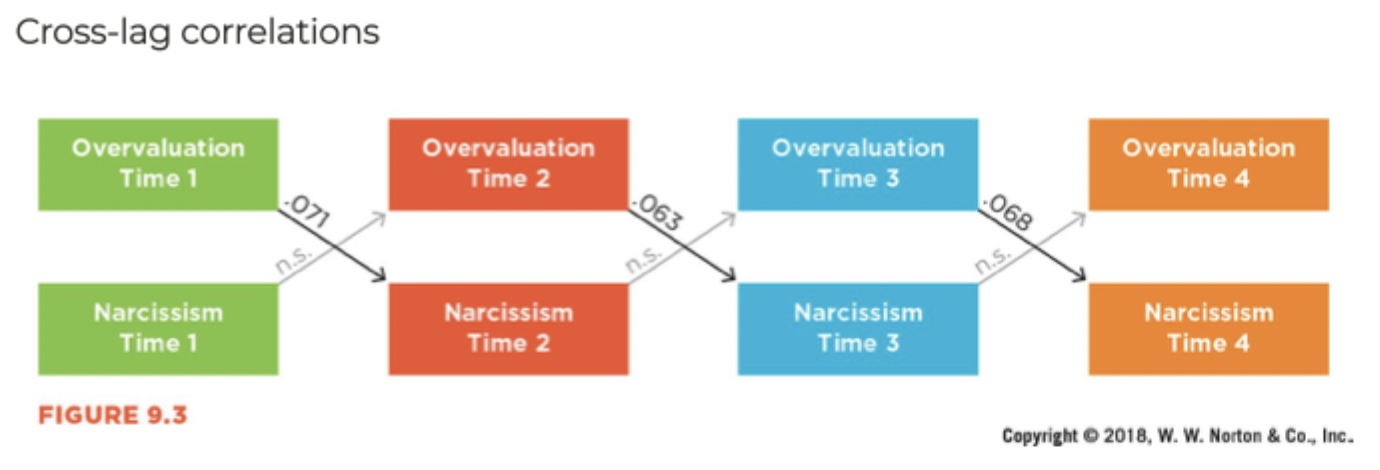
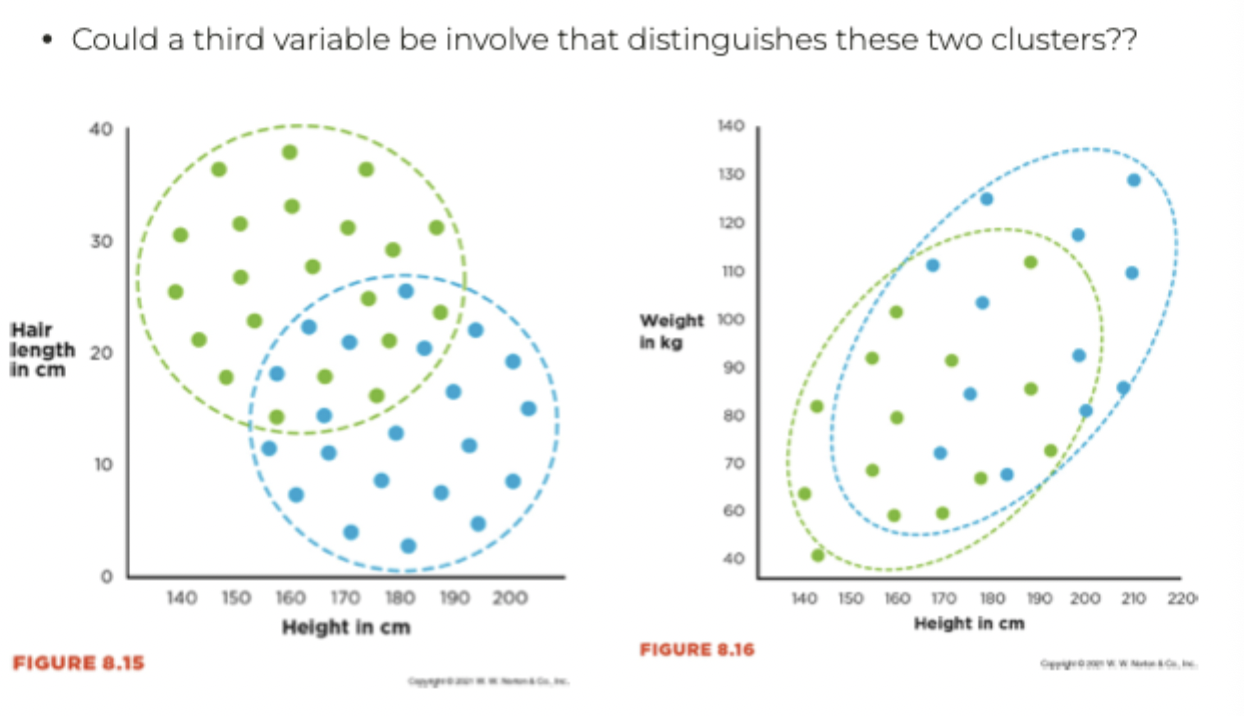
How do we quantify third variables?
Multiple Regression
More than one predictor is added to a regression model
The Z’s are not inherently problematic
People taller have shorter hair
Strong negative correlation
Gender third variable
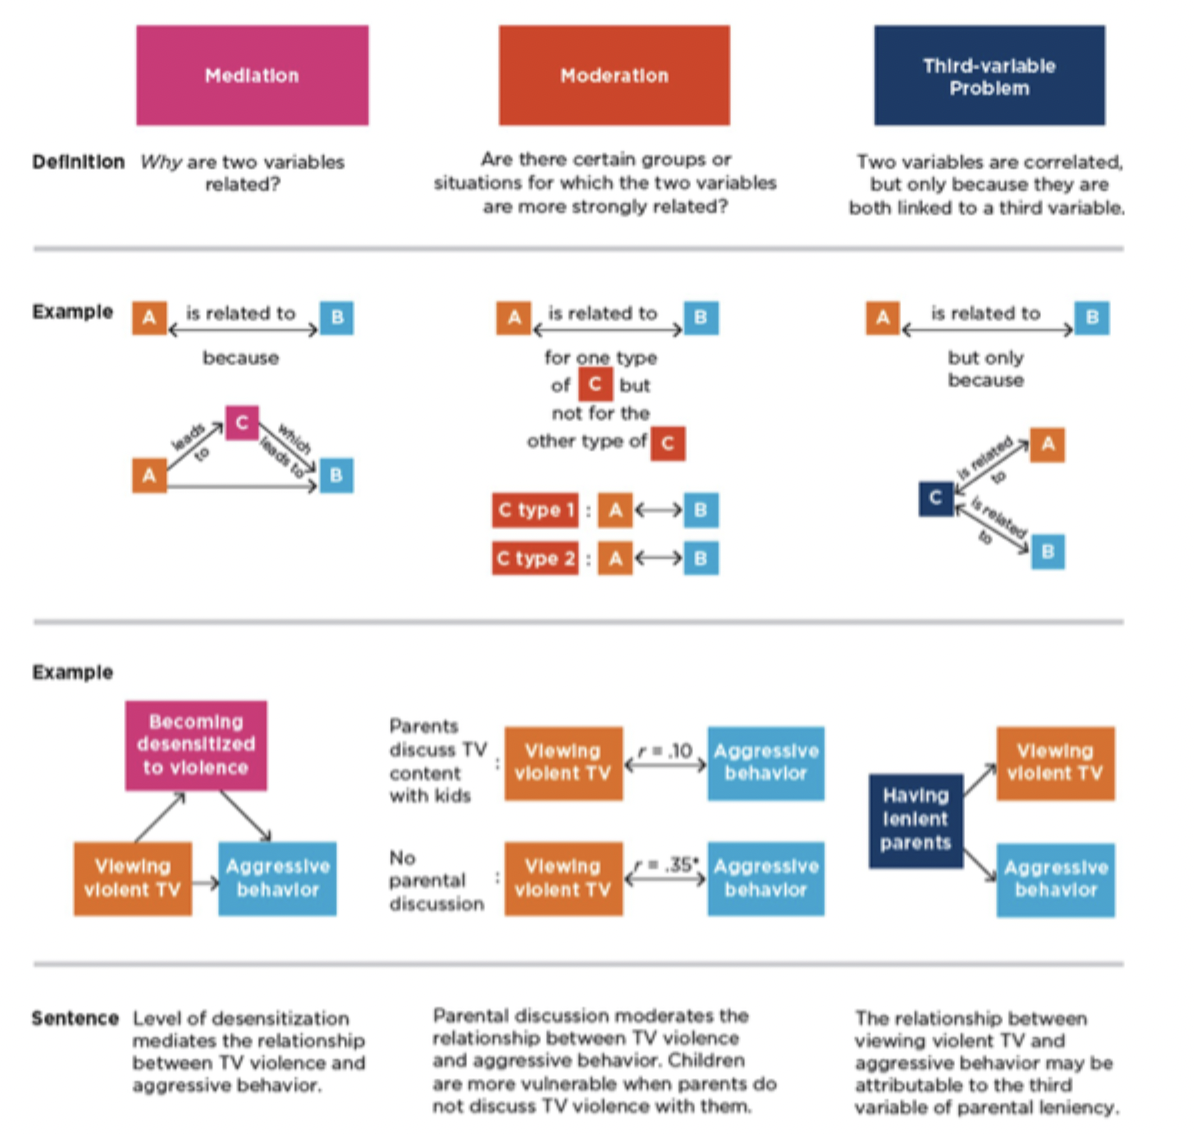
How are moderators? What is moderation?
Moderator: alters when we see an effect
Moderation occurs when the strength of the relationship between two variables depends on the level of a third variable
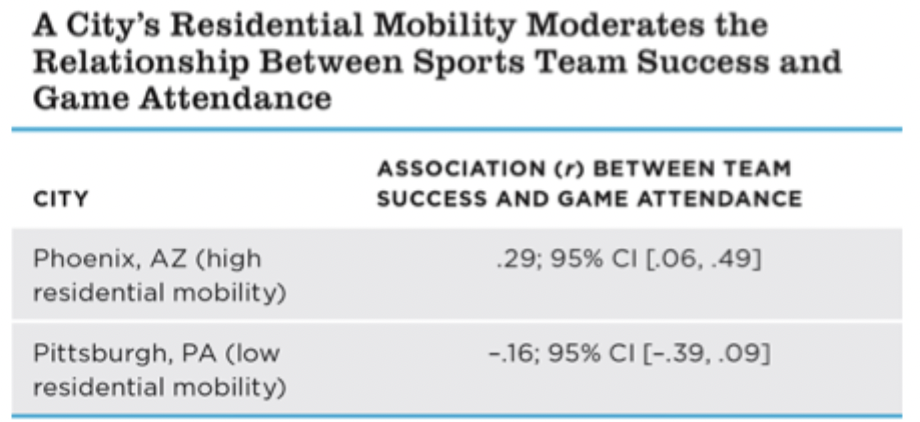
Team success and game attendance
Is there a statistically significant relationship present
Phoenix, CI does not include 0
Pittsburgh includes 0
City moderator variable
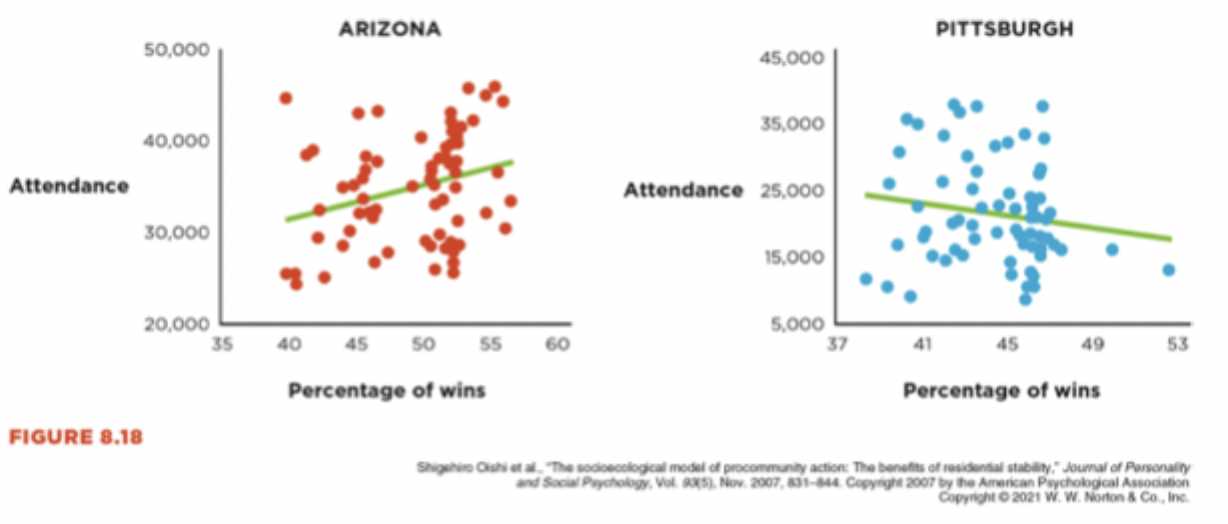
City moderator depending on which city looking at either see positive association or we might not
Gender moderator. If positive association for men & not for women, moderation.
Regression in Pop Science
Controlled for, adjusting for, considering
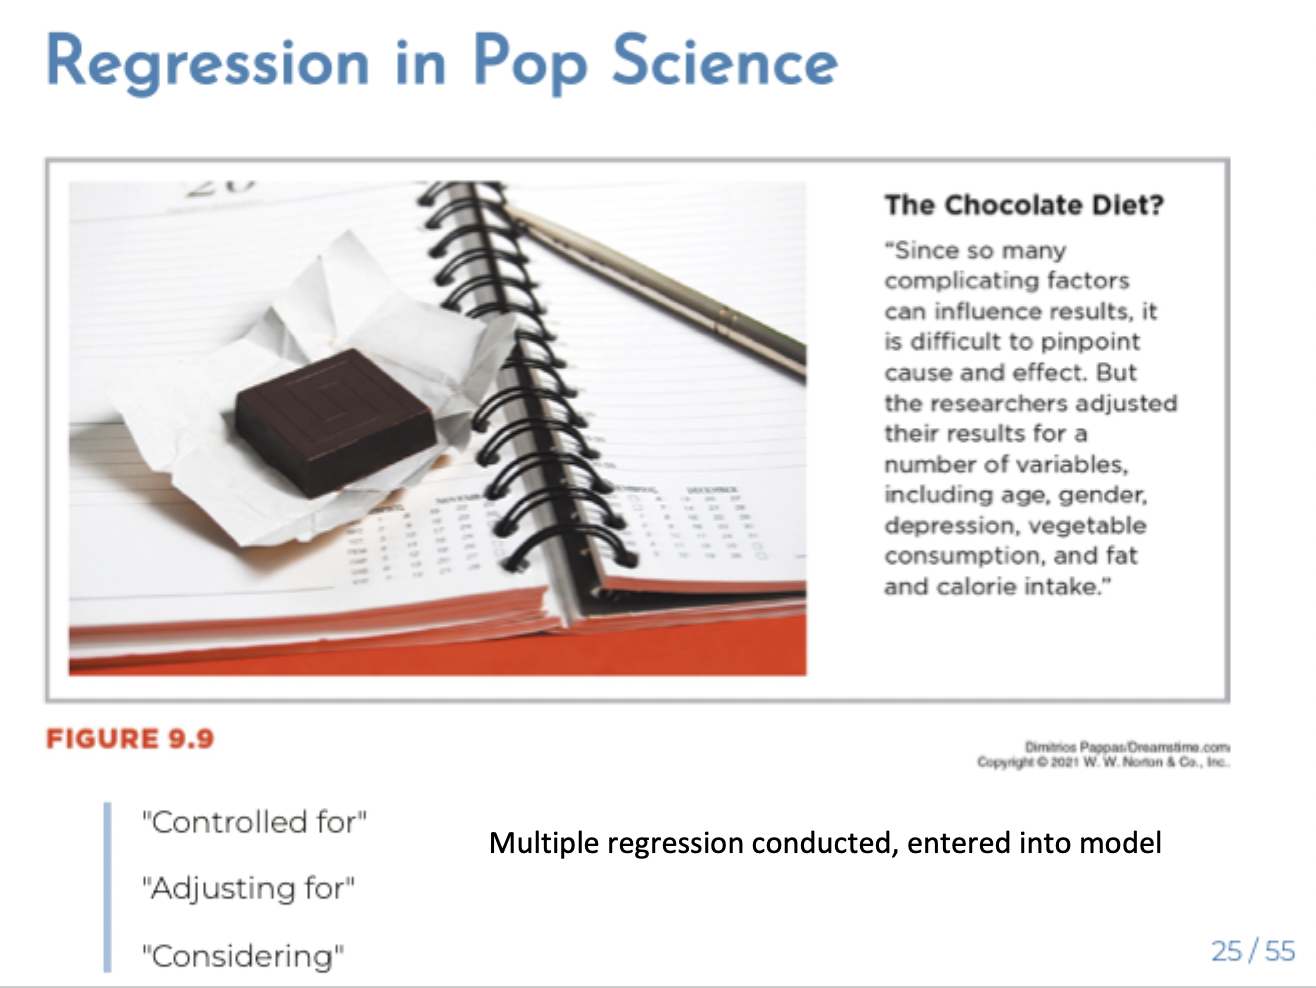
Multiple Regression & Causation
Just like simple bivariate correlations, multiple regression is not a foolproof way to rule out all kinds of third variables
What is Mediation?
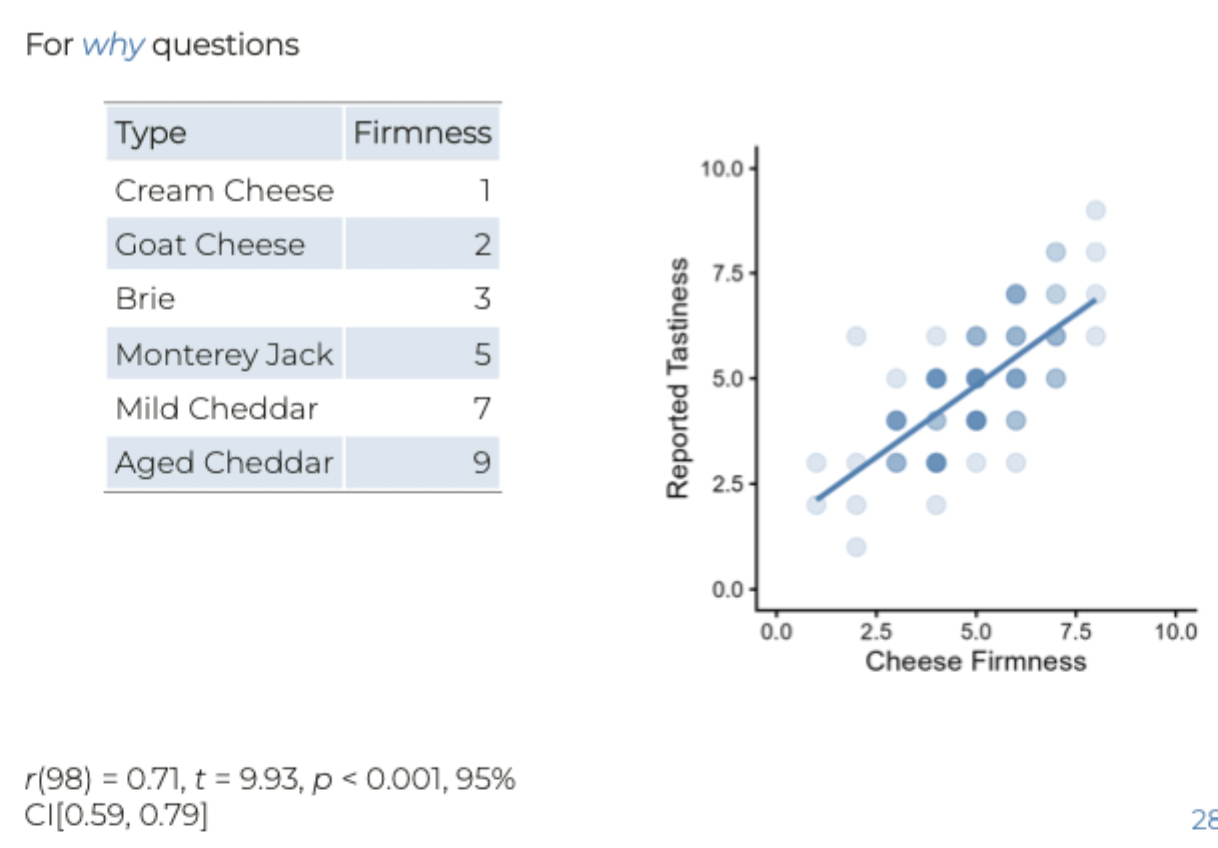
For why questions
Recall the gender & hair length example (moderation)-not a why question
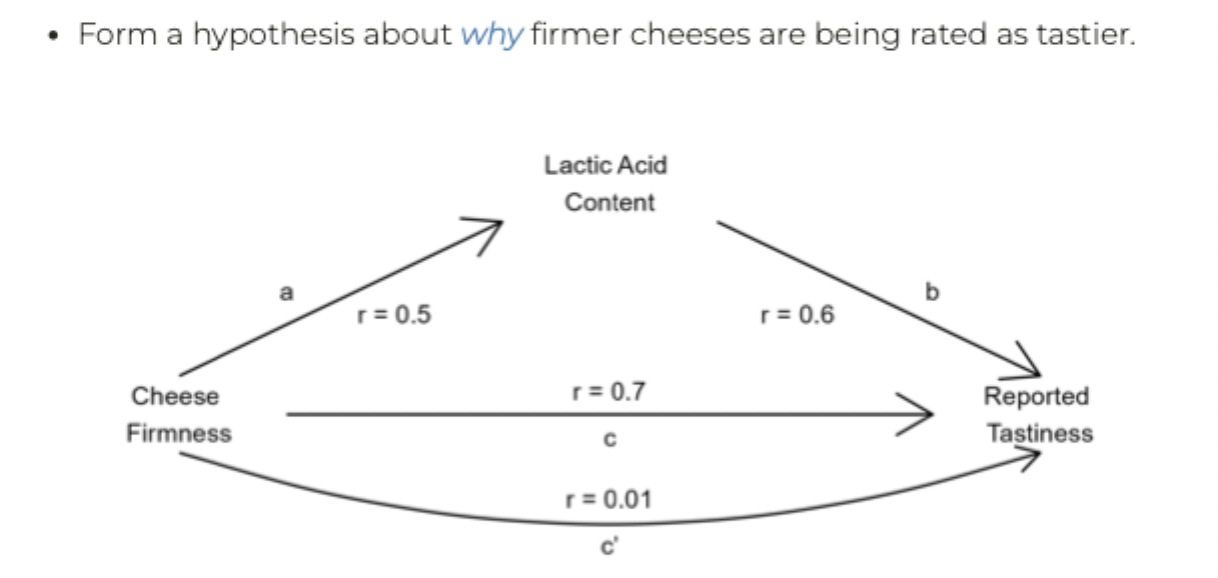
Form a hypothesis about why firmer cheesed are being rated as tastier
Lactic Acid & Cheese Firmness Example
Lactic acid content mediates the relationship between cheese firmness & tastiness
Related not casual
Variance in lactic acid why see relationship between cheese firmness and tasiness.
Mediators, moderators & covariates
Mediation models are for why questions (why relationships exists)
Moderation models are for who or when questions (gender)
Covariates (third variables, the z’s) control for other explanations
Moderation
Relationship between annual salary & how much spend on car. Gender
Men increasing salary increase car spend. As women make more, don't spend more money on car.
What are different types of variables?
Independent variables (IV): manipulated
Dependent variables (DV): measured, outcome variable
Control variable: any variable that the experimenter holds constant (e.g., time of day when testing occurs)
Why do experiments support causal claims?
Experiments can establish covariance
Experiments can establish temporal precedence
Well-designed experiments establish internal validity
Experiments establish covariance
Systematically manipulating an IV allows for a carefully pre-defined comparison
Experiments involve a control group
Bad experiments
Sugar consumption & their behaviour
Other variables present
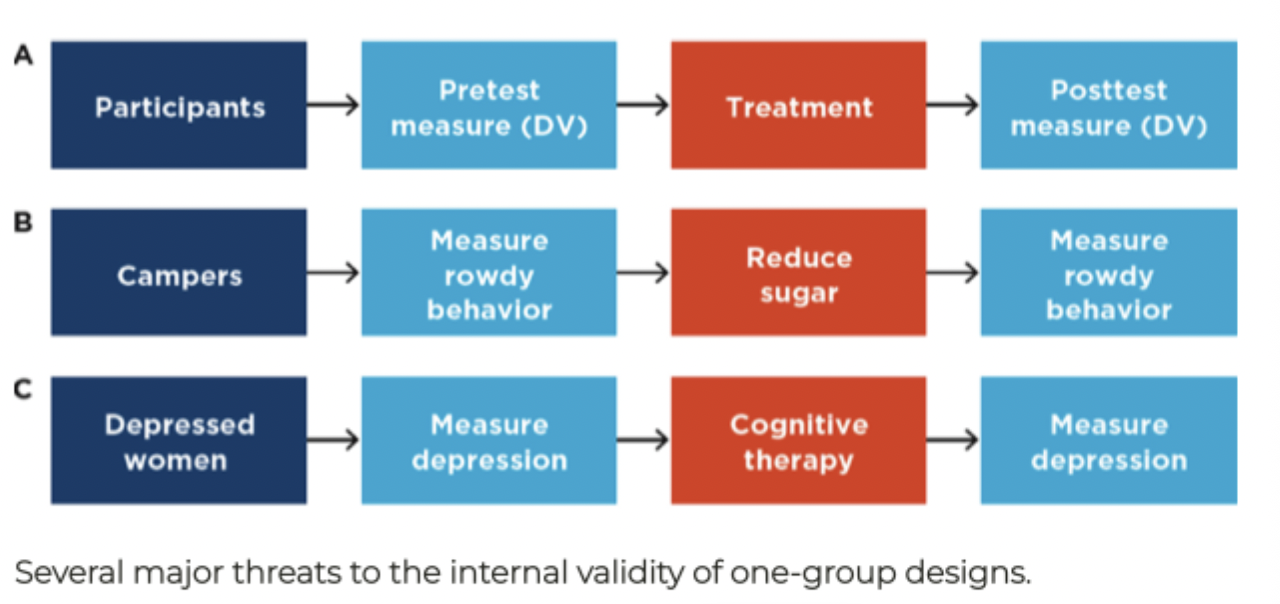
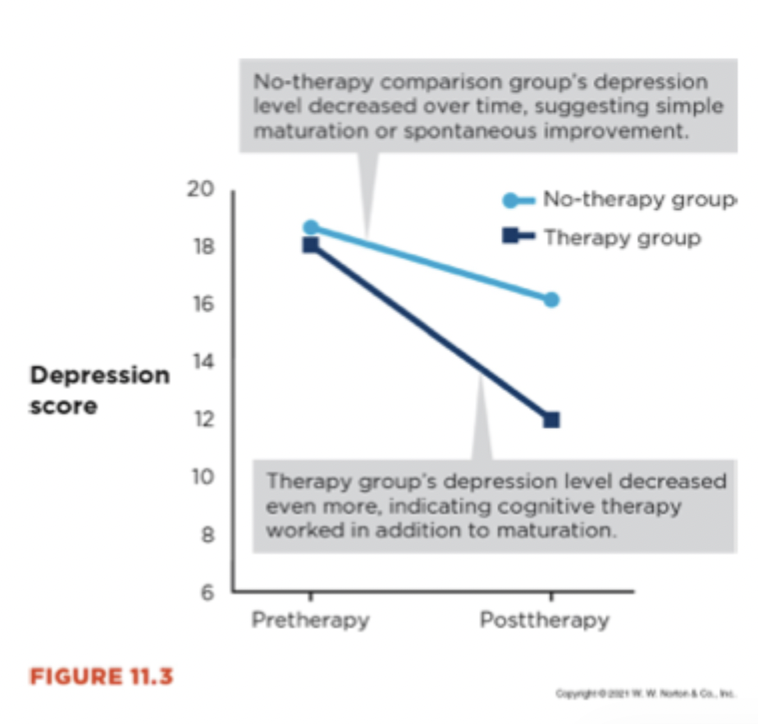
Maturation Threats
Highlights the importance of including a control condition
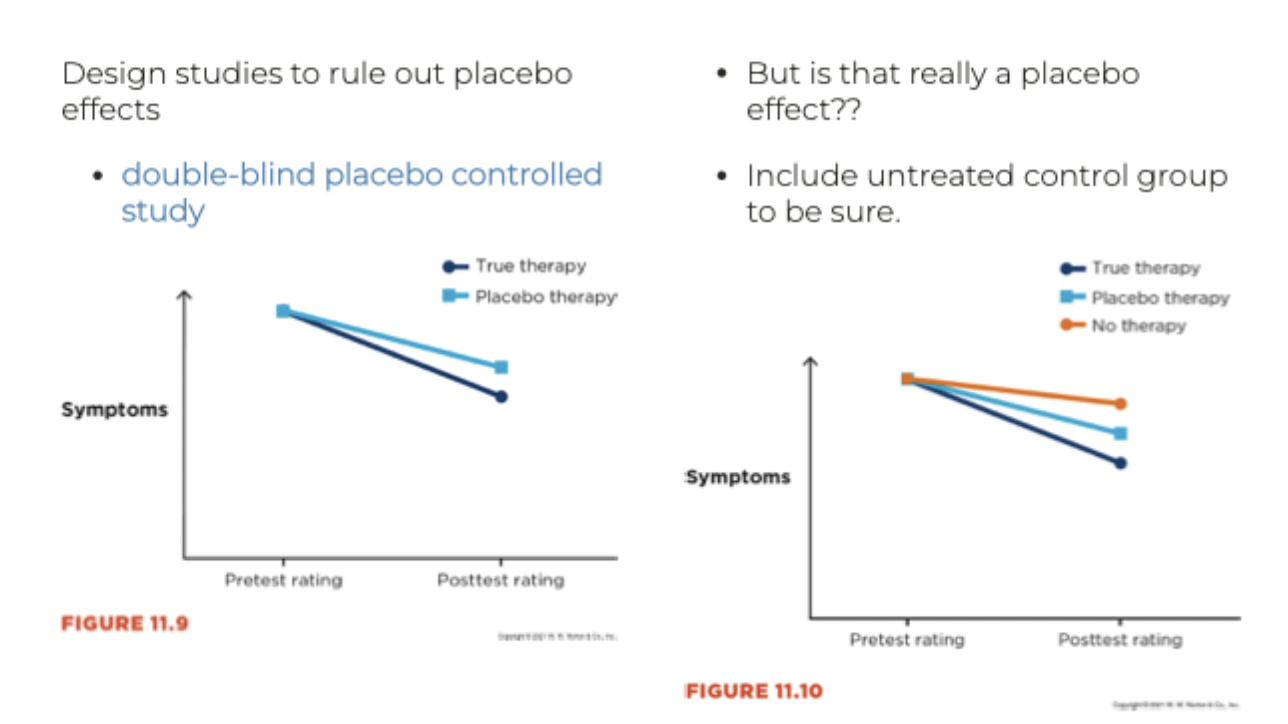
Placebo Effects
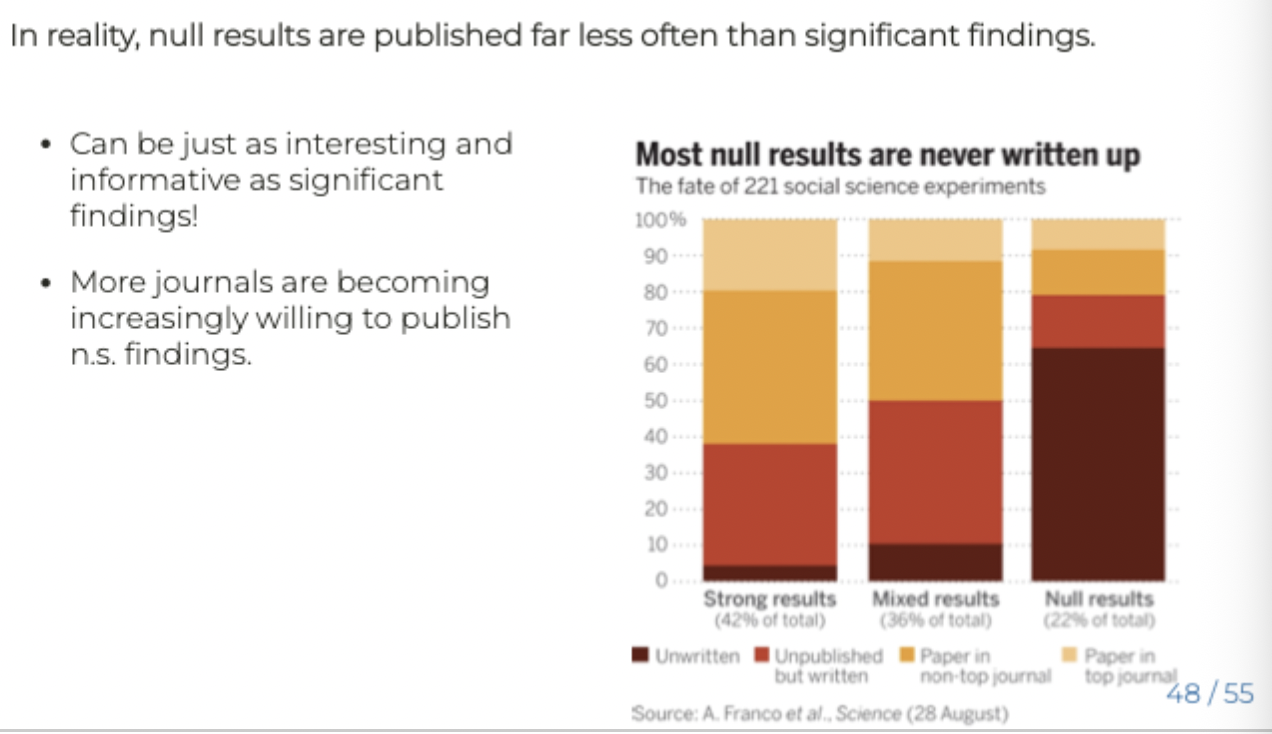
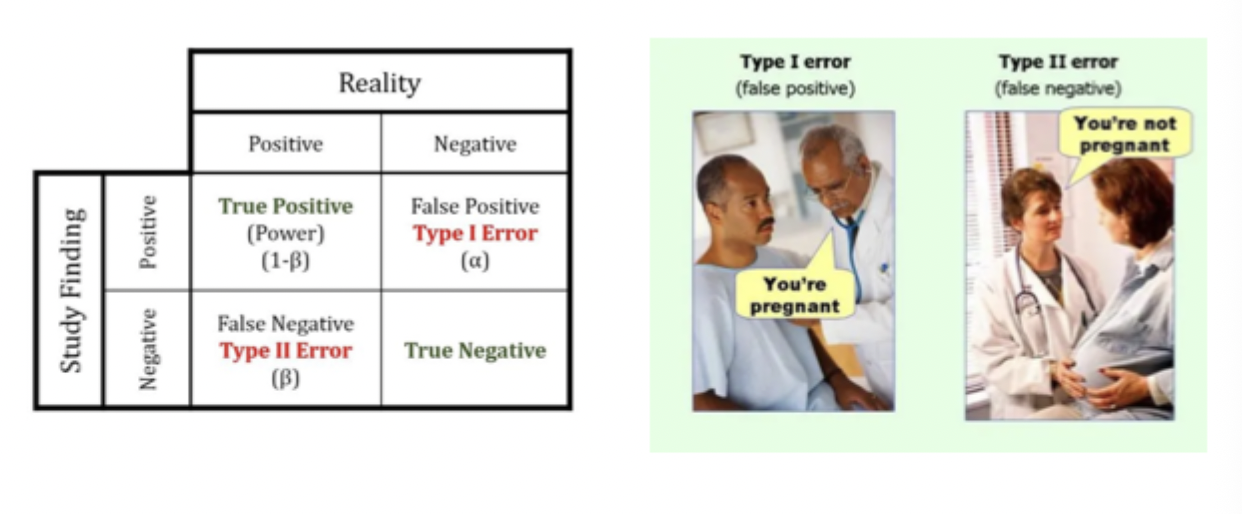
Understanding Null Effects
When there is no observed effect of the IV on the DV
Perhaps there simply is no effect
Perhaps the sample size is too low to detect the effect (underpowered)
Perhaps there was too much within group variability to see the effect
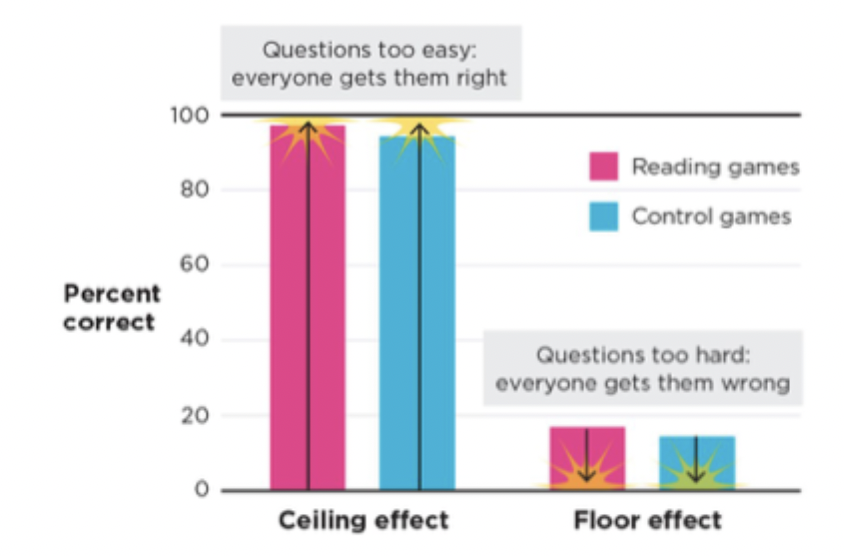
Design issues
Ceiling & Floor Effects
Purpose of the assessment is to generate a spread of scores that (hopefully) map on to understanding of the course material
Power & Precision
Power is the likelihood that a study will yield a statistically significant result (assuming that there really is an effect of the IV
A Note about Null Results
If a rigorously conducted empirical study indicates that there’s probably no effect of a given IV, that finding should be reported transparently