AP Enviromental Science Unit 3 + 5 (≧▽≦)
 Multiple Choice & FRQ
 Call Kai
1/75

Earn XP
Description and Tags
First part of Unit 3 notes that I got from my class
76 Terms
Size (N)
The number of organisms in an area at a given time.
Density
Describes the number of individuals per unit area
Distribution
Describes the spatial arrangement of organisms within an area
Sex ratio
The proportion of males to females
Age Structure
Describes the number of individuals of different ages within a population
Random Distribution
Shows no particular pattern

Uniform Distribution
Has individuals spaced evenly

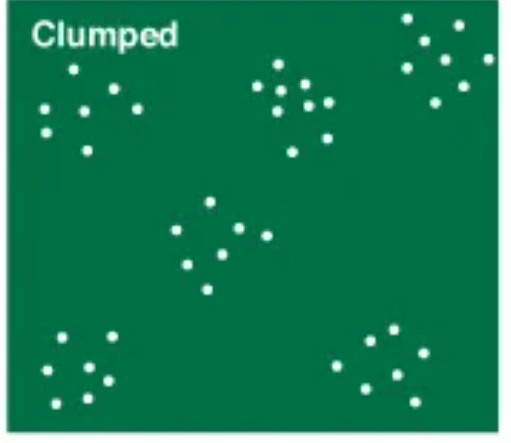
Clumped Distribution
Occurs when individuals concentrate in certain areas
Density-Dependent Factors
Influences an individuals probability of survival and reproduction in a matter that depends on population density
Density-Independent Factors
Has the same effect on individuals probability of survival and the amount of reproduction at any population density.
Intrinsic Growth (Biotic Potential)
How fast the population grows when conditions are the best of the best

Logistic Growth (Carrying Capacity)
When a population grows fast, slows down and then just stops growing and then stays in a straight line

Population Growth Rate
The rate of change in a population
Population Growth rate equation
Births-deaths x 100 = r
K
Carrying capacity (when resources are limited)
r
Maximum potential for growth with unlimited resources which leads to a population overshoot
Carry Capacity (K)
The maximum number of individuals of a species that the environment can carry and sustain
Limiting resources
A resource that a population cannot live without
Overshoot
When a population becomes larger that the environment’s carrying capacity
Die-off/ die-back
A rapid decline in a population due to death
Survivorship Curve
A graph that represents the distinct patterns of species survival as a function of age

Type I (mostly k-selected)
High survival throughout most of the life span, but then individuals start to die in large numbers as the approach old age.

Type II (in between r and K)
There is a relatively constant decline in survivorship throughout most of the life span

Type III ( mostly r-selected)
There is a low survivorship early in life with few individuals reaching adulthood

Crude birth rate (CBR)
The number of births per 1000 individuals per year
Crude death rate (CDR)
The number of deaths per 1000 individuals per year
Global population growth rate
Equation = (CBR-CDR) / 10
National population growth rate
Includes the effects of human migration. Equation = (CBR + immigration) - (CDR + emigration) / 10
Doubling time
The number of years it takes a population to double
Rule of 70
Doubling time (years). Equation 70/ growth rate
Migration
Describes the movement of individuals between countries
Immigration
People entering a country
Emigration
People leaving a country
IPAT Model
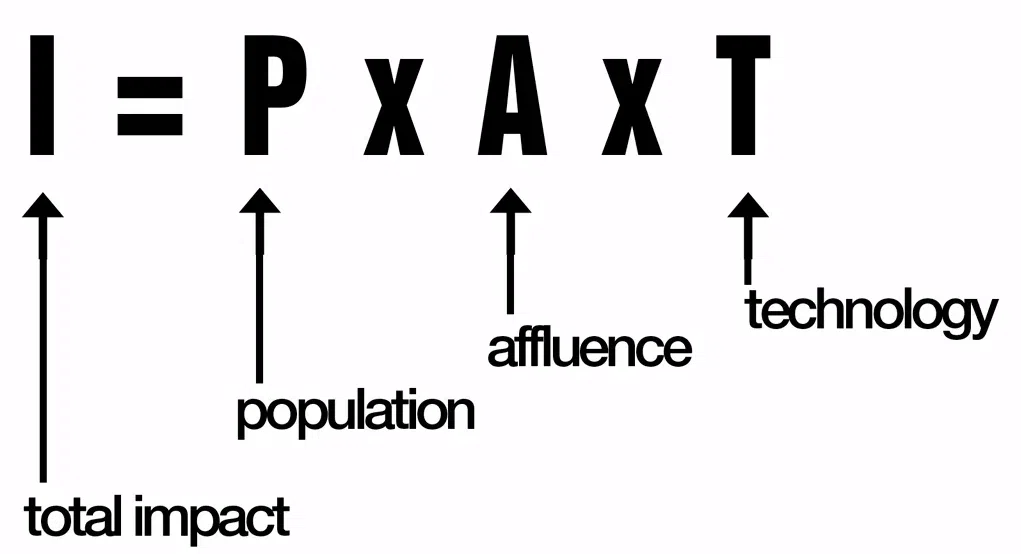
Represents how our total impact (I) on the environment results from the interaction of population (P), affluence (A), and technology (T)
Affluence
Describes a population or individuals access to wealth
IPAT equation
I= P x A x T
Demography
The study of statistical changes in the human population
Age structure diagrams
Describe the relative numbers of individuals in each age class within a population
An Age structure diagram with a wide base
Shows a potential for rapid future growth

An age structure with an even age distribution
Shows a stable population

An Age structure with a narrow base
Shows a shrinking population

Sex ratio
The number of males to females in a population
Total Fertility Rate (TFR)
The average number of children born per women during her lifetime
Replacement fertility
The TFR that keeps the size of a population stable. For humans, this is 2.1
Stage 1 in the demographic transition
Death rates are high due to widespread disease, rudimentary health care, and unreliable food supplies

Stage 2
Death rates decline during the transitional period due to improved food production and healthcare as well as the birth rates remaining high, so the population increases

Stage 3
During the industrial stage, employment opportunities increase for women and birth control becomes more widely available, decreasing birth rates

Stage 4
The population growth stabilizes or begins to shrink during the post - industrial stage

The tragedy of the commons
The tendency of a shared limited resource to become depleted because of people acting from self interest for short-term gain
Externalities
Negative costs associated with human actions that aren’t accounted for in the price
Ecological footprint
A measure of how much an individual consumes, expressed in an area of land
Increase footprint
Wealth increases carbon and ecological footprint ( it’s not a good thing in the long run)
Decrease footprint
Renewable energy use (wind, solar, hydroelectric) (it’s a good thing in the long run)
Urbanization
Removing of vegetation to convert natural landscape to city (urban)
What does urbanization prevents?
Groundwater recharge
Saltwater intrusion
When there are few wells along a coastline, the water remains high and the resulting pressure prevents salt water from intruding.
Urban blight
The degradation of the built and social environments of the city that often accompanies and accelerate migration to the suburbs
Highway Trust fund
A U.S federal fund that pays for the construction and maintenance of roads and highways
Induced demand
The phenomenon in which an increase in the supply of a good cause demand to grow
Zoning
A planning tool used to separate industry and business from residential neighborhoods-sometimes used in ways that erode services in already disadvantaged communities
Urban blight
As people move away from a city to suburbs and exurbs, the city often deteriorate, which causes yet more people to leave. This cycle is an example of positive feedback system.
Smart growth
A set of principles for community planning that focuses on strategies to encourage the development of sustainable, healthy communities.
Multi-use zoning
A zoning classification that allows retail and high-density residential development to coexist in the same area.
Stakeholder
A person or organization with an interest in a particular place or issue.
Floodplain
The land adjacent to a river
Water table
The uppermost level at which the water in a given area fully saturates rock or soil.
Groundwater recharge
A process by which water percolates through the soil and works its way into an aquifer.
Mining
describe how humans extract elements and minerals and the social and environmental consequences of these activities.
Ore
A concentrated accumulation of minerals from which economically valuable materials can be extracted.
Metal
An element with properties that allow it to conduct electricity and heat energy, and to perform other important functions.
Reserve
In resource management, the known quantity of a resource that can be economically recovered.
Tailings and Slag
crushed material from which usable ore is mechanically or chemically extracted
Overburden
Layers of rock and soil that must be removed before accessing ore
Drilling
a drill bit hammers the rock to form tunnels. Can be used to open up the surface and insert explosives for surface mining. Used to explore for minerals, for fracking, to form tunnels for various purposes, etc. Can cause instability of surrounding rock/soil. Impact depends on purpose
Mountaintop removal
tops of mountains are blasted off to extract ore. Large amounts of waste rock slide into nearby streams leading to flooding, contaminated water supply, sediment buildup and acid formation in other waterways. Loss of habitat and aesthetic value. Cheap/Large scale.
Open Pit Mine
A giant hole is dug to remove ore and waste rock is piled outside of the pit. Results in acid mine drainage to surrounding waterways as well as a toxic lake in the hole. Loss of aesthetic value, habitat destruction for flora and fauna. Cheap and large scale.