Ultrasound of the Heart (SDL)
 Call Kai
 Learn
Learn Practice Test
 Spaced Repetition
 Match
Match Flashcards
 Knowt Play
1/17

There's no tags or description
Looks like no tags are added yet.
Name | Mastery | Learn | Test | Matching | Spaced | Call with Kai |
|---|
No analytics yet
Send a link to your students to track their progress
18 Terms
What set up equipment is required for echocardiography of the heart? Describe:
Patient Preparation
Patient Positioning
Equipment Needed
Patient preparation:
• Clip over apical beat
The apical beat (or apex beat) in a dog is the point of maximum intensity (PMI) of the heartbeat, felt as a pulsation on the lower-left chest wall, typically behind the left elbow at the 5th or 6th intercostal space. It represents the apex of the left ventricle striking the chest wall during contraction.
• Apply water & gel
Patient position:
• Right then left lateral recumbency
• Scan from below patient
- Hypostatic congestion in dependent lung
Hyperinflation in upper lung
Heart pushes lung out of the way
Equipment:
• Phased array / microconvex transducer
• ECG leads to determine the state of the cardiac cycle during the exam
What is B-mode Echocardiography?
What is the importance of performing standardized views?
“Brightness”(B)-mode echocardiography: is a real-time, two-dimensional (2D) ultrasound imaging technique that maps cardiac structures using grayscale pixels, where brightness corresponds to echo intensity.
Why bother with standard views?
• Orientation!
• Systematic examination
• Repeatable images
Easier to interpret normal v abnormal
Standard measurements of cardiac structures
Comparison with published images
Remote diagnoses
Follow up scan (progression / resolution)
Guide M Mode & Doppler measurements
Describe the orientation of standard right parasternal views of the heart.
SHORT AXIS
Orientation: The ultrasound beam is aligned perpendicular to the long axis of the heart, roughly parallel with IC space, usually with the marker pointing toward the dog's right shoulder (craniodorsal).
Gives view of the short axis
LV = mushroom shape
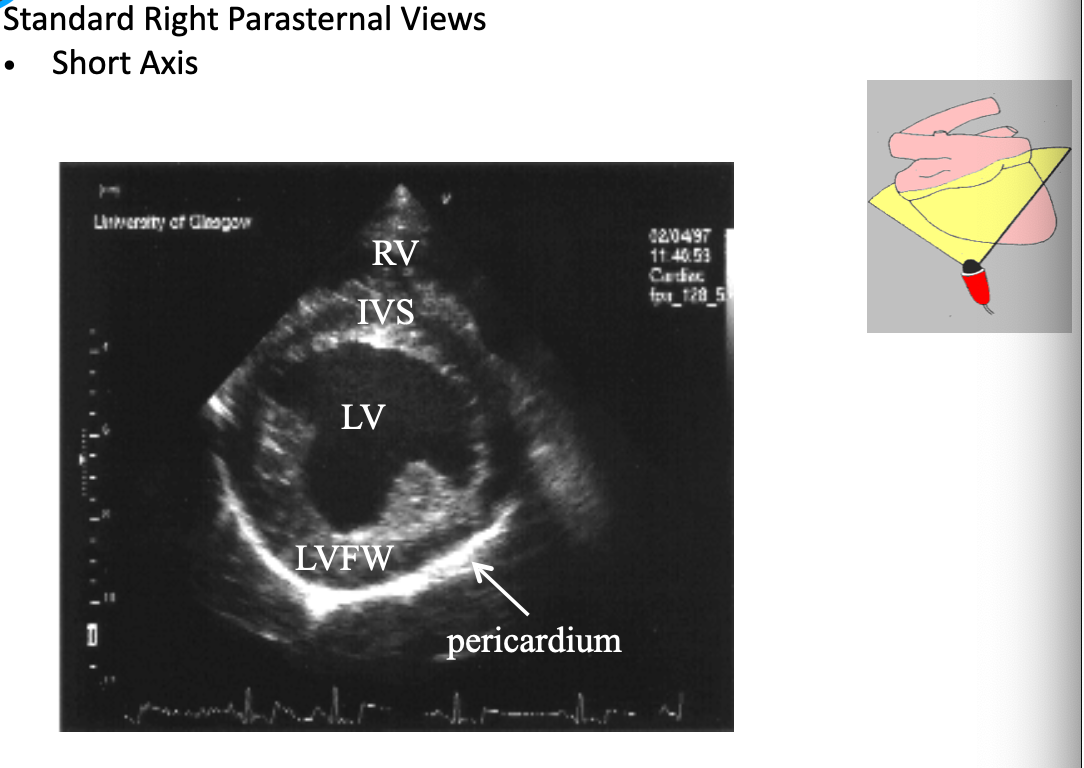
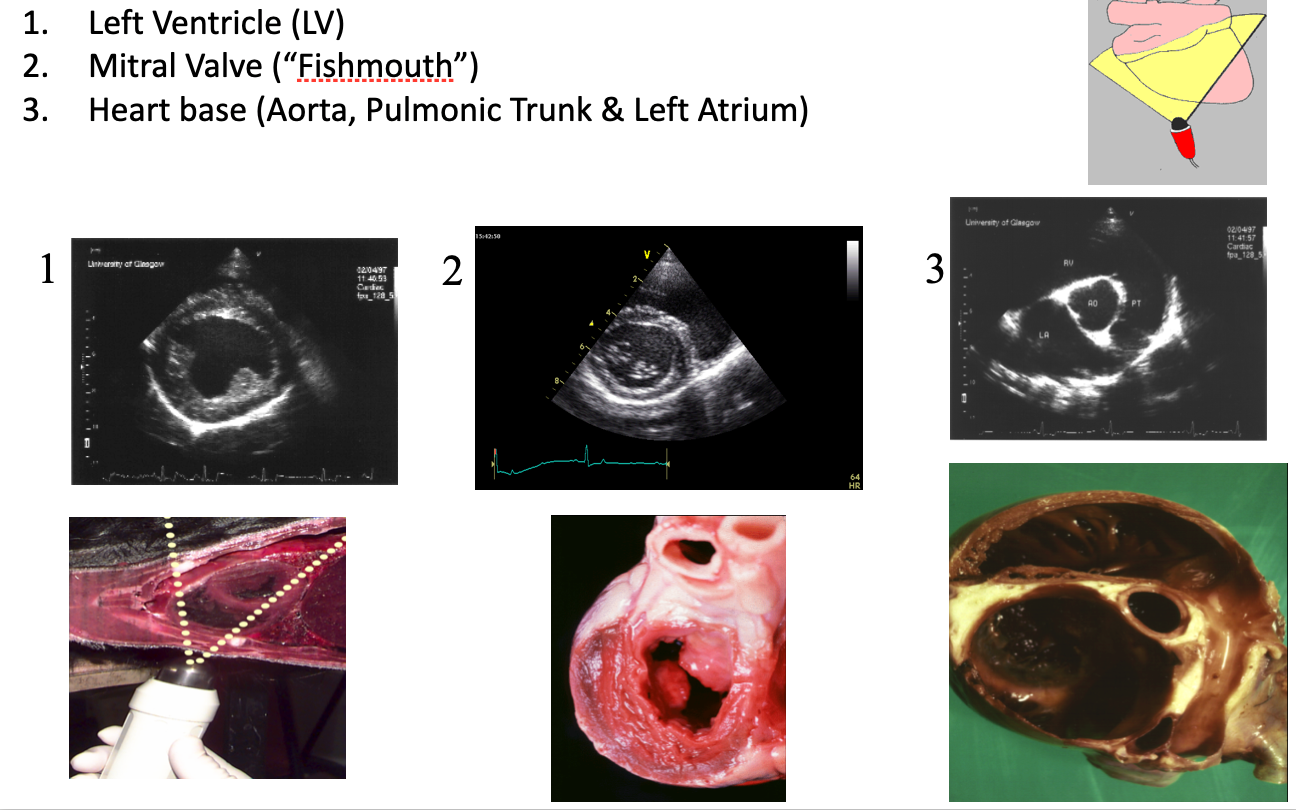
Describe key features of the following structures when viewed in the Right Parasternal Short Axis View.
Left Ventricle
Mitral Valve (Fishmouth)
Heart Base (Aorta, Pulmonic Trunk & Left Atrium)
The above are the three
Left Ventricle + papillary muscles
Transducer near apical beat
Mitral Valve (Fishmouth)
More cranial-dorsal view
Heart Base (Aorta, Pulmonic Trunk & Left Atrium)
Describe the orientation of standard right parasternal views of the heart.
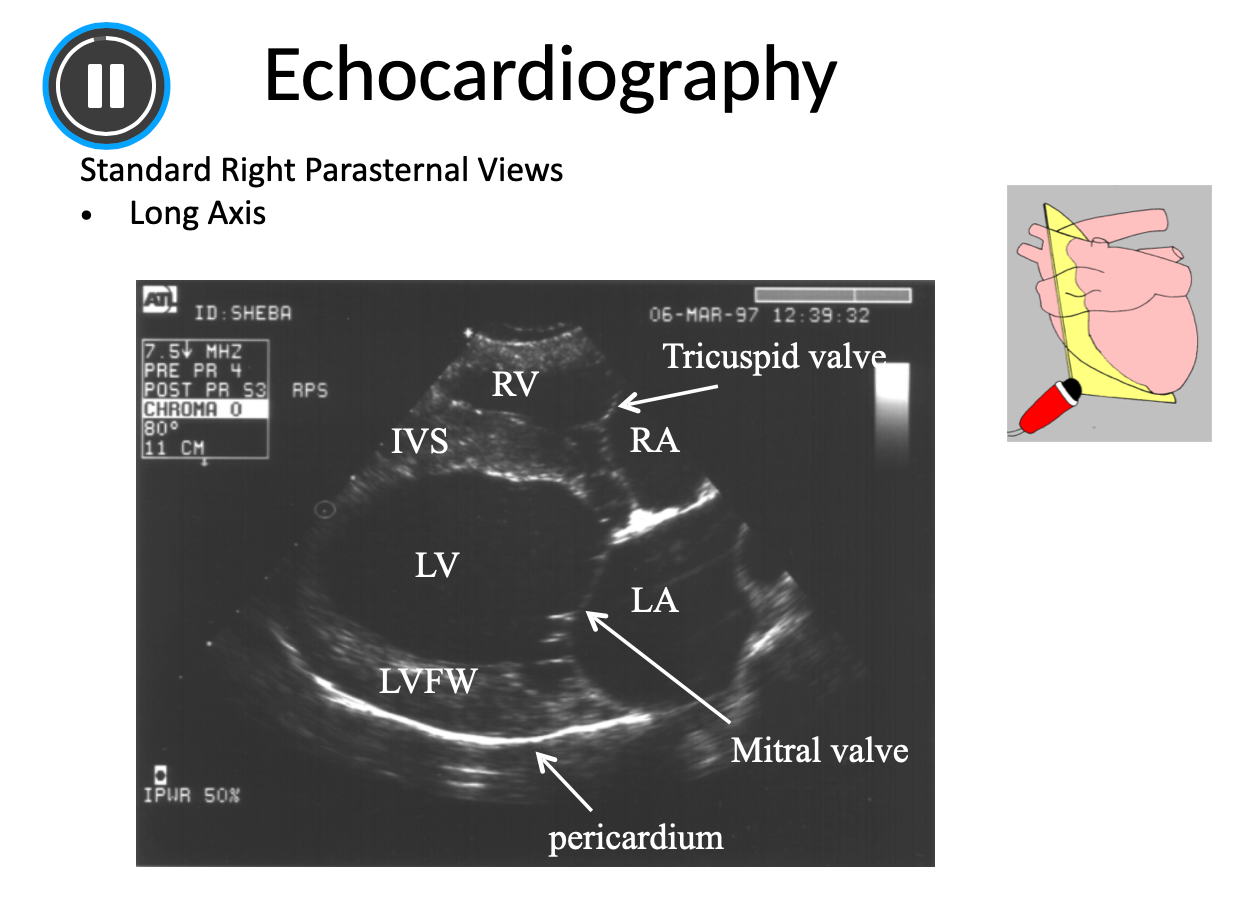
LONG AXIS
Transducer rotated 90 degrees, parallel to long axis and at right angle with IC space
Views displayed with base to right, and apex to the left
Pericardium appears hyper echoic - adhered to outside of heart
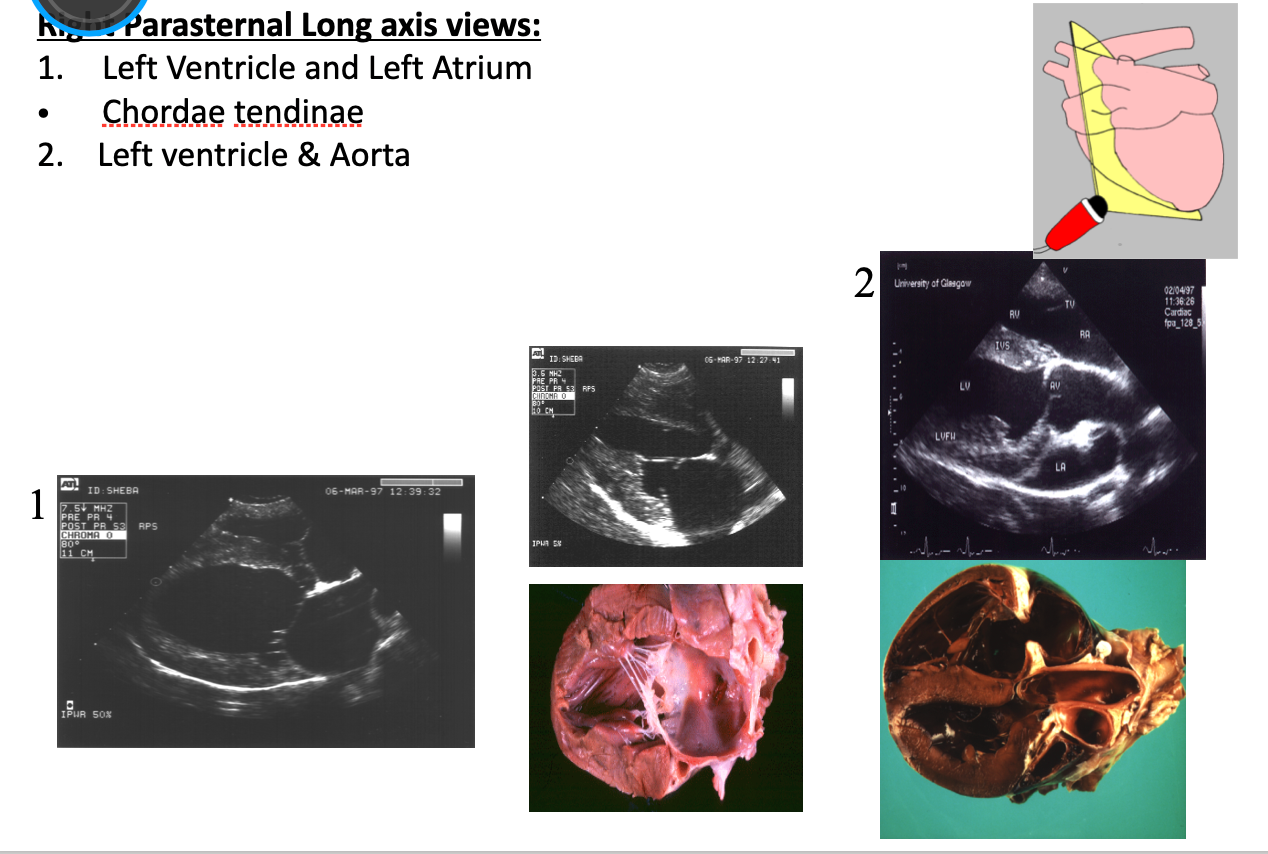
Describe key features of the following structures when viewed in the Right Parasternal Long Axis View.
Left Ventricle and Left Atrium
Chordae Tendinae
Left Ventricle and Aorta
Hyper echoic strands = chordae tendinae
Describe key features of the following structures when viewed in the Left Parasternal Long Axis View.
Left lateral recumbency - mobile apex closer to thoracic wall
Four Chambers
Five chambers
Summarize the standard Parasternal views that can be visualized.
RPS Short axis views
1. Left ventricle (Mushroom)
2. Mitral valve ("Fishmouth")
3. Heart base (Aorta, Pulmonic trunk & Left atrium)
RPS Long axis views
1. Left ventricle & left atrium
2. Left ventricle & aorta
LPS views:
• 4 chamber view
• 5 chamber view
Aortic valve / outflow tract
What is “M-mode / Time-Motion Mode” echocardiography?
• Standard B-mode images
• Position cursor line through image, when activates means:
• Movement of structures against time is displayed on screen and constantly updated
• ECG - allows identification of stage of cardiac cycle
• Objective measurements
Lumen = usually inside
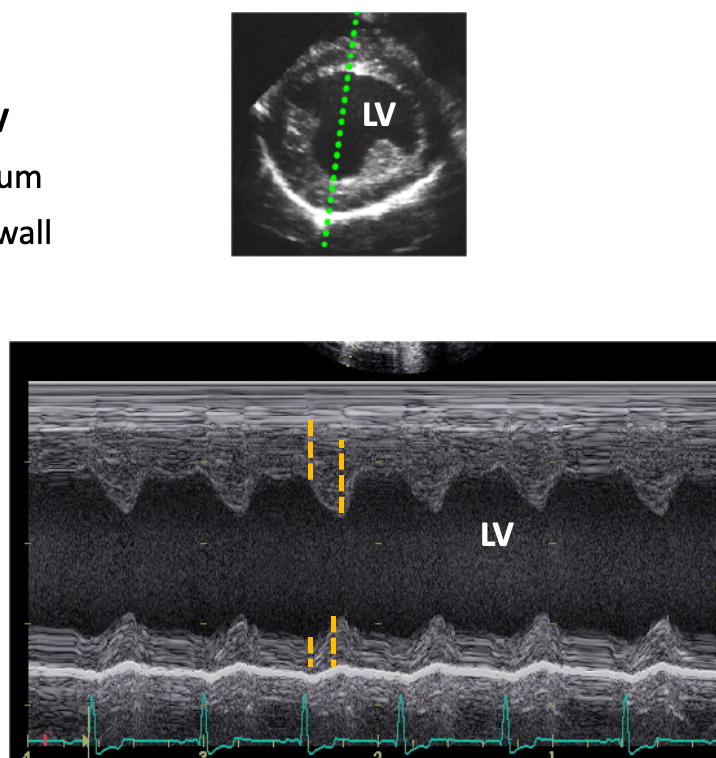
Describe what features of the heart can be visualized in M-mode
Cardiac Wall thickness:
• RPS short axis through LV
• Interventricular septum
• Left ventricular free wall
• Published values for thickness for breeds and species
LV function:
• RPS short axis through LV
• LV Lumen diameter
• Same trace as wall thickness
Shortening fraction: gives information on the contractility ability of the left ventricle - measures the percentage decrease in left ventricular (LV) diameter during systole, representing systolic function
• LVEDD - LVESD × 100
LVEDD
• Normal range : Dogs: 25 - 45% Cats : 30 - 55%
• RPS long axis through LV & LA - taken using B-mode
• LV Lumen diameter
• End diastole image stopped - MV open / max area
• End systole image stopped - MV closed / min area
Ejection fraction: also gives information on LV contractility and function, should be more accurate than shortening fraction
• Difference between areas
• Normal >50%
Left ventricular dilation: gives information on LV volume overload or dilation
• RPS short axis "Fishmouth" view
• Demonstrates movement of mitral valve leaflets
M & W shapes of the leaflets
• LV wall
E -point to septal separation (EPSS): E-point to septal separation (EPSS) is an M-mode echocardiographic measurement that provides a rapid, reliable, and mostly objective assessment of left ventricular (LV) systolic function.
• Distance between valve and IVS
• Normal <7mm
Measurement of left atrial size: Left atrial enlargement:
• RPS short axis through heart base
• End systole
• Left atrium diameter
• Aorta diameter
• Mercedes - Benz sign
Ratio LA : Aorta
Dogs 1:1-1.4
Cats 1: 1.2-1.7
What is the doppler ultrasound and what are the main types?
• Frequency of beam changes when it encounters moving objects eg RBCs, allows assessment of the movement of blood through the heart
Types of Doppler:
• Colourflow - flow through heart as areas of color
• Spectral - depicts blood flow as a graph, 2 types:
Pulsed wave
Continuous wave
How does the doppler ultrasound allow for assessment of blood flow?
• 1. Direction:
• if moving towards or away from transducer
• 2. Velocity:
• Beam parallel with direction movement = most accurate measurement
• 3. Uniformity:
• laminar v turbulent
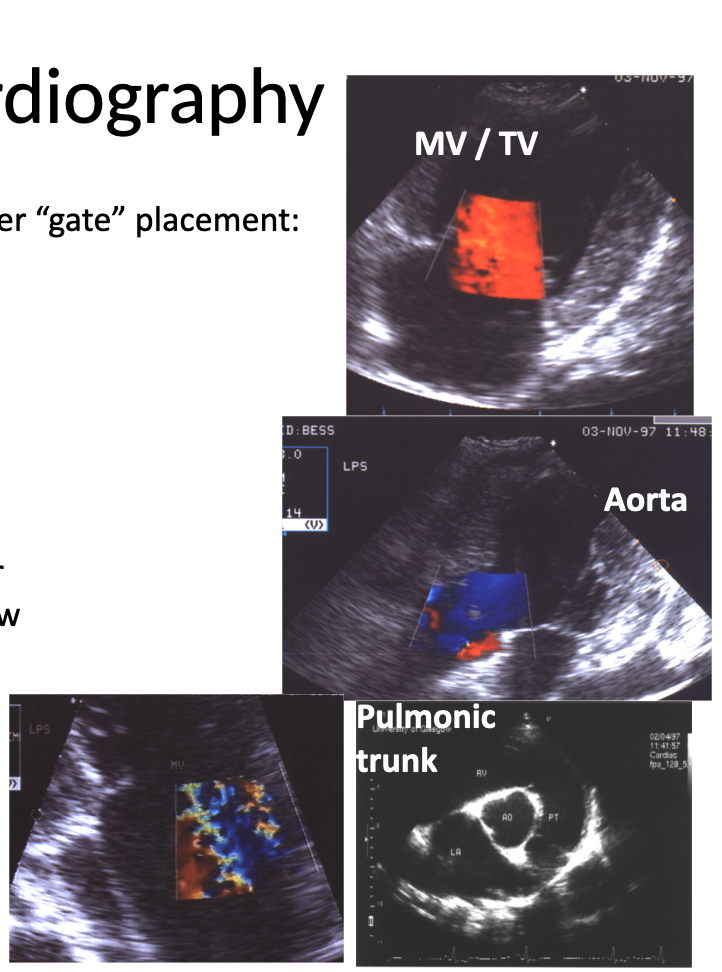
Describe the key features of colorflow doppler echocardiography.
B-mode images guide the Doppler “Gate” placement
LPS 4/5 chamber views
Aorta (downward, blood depicted blue), MV & TV (Toward transducer (blood pictured red)
RPS SA heart base view
Pulmonic trunk (Away from transducer, blue)
Conventional Coloring System
• BART system
• Blue = Depicts blood going away from transducer
Aortic / Pulmonic outflow
• Red = Depicts blood going towards transducer
Mitral / Tricuspid inflow
Valvular incompetence - indicated by opposite color of flow in the wrong direction, turbulent flow - mosaic or multi-colored appearance
Screens large areas of blood flow through heart to identify abnormalities
Describe key features of the spectral doppler, specifically the pulsed wave.
Specifically the LPS 4 chamber view.
Colorflow guides placement of the spectral doppler cursor box of areas of normal or abnormal inflow/outflow. Activation of pulsed wave produces a trace of blood flow through the box against time.
Pulsed Wave
• Mitral / Tricuspid flow up screen towards transducer, normal flow characterized by peaks of flow above baseline are normal
• LPS 4 chamber view
• E and A peaks
E = early peak
A = atrial peak
Can measure velocity of flow by measuring the peaks
E and A peaks in pulsed-wave Doppler echocardiography represent velocities of blood flow across the mitral valve, used to assess left ventricular diastolic function. The E-wave (early) indicates passive, rapid filling of the left ventricle, while the A-wave (atrial) represents active filling caused by atrial contraction.
Describe key features of the spectral doppler, specifically the pulsed wave.
Specifically the LPS 5 chamber view?
• Aortic / Pulmonic Flow
• Aorta most visible on - LPS 5 chamber view
• Pulmonic valve most visible - RPS SA heart base
• Flow away from transducer = below baseline
• Single peak with black outline below the baseline - indicates normal laminar flow
How is regurgitant flow through the Aorta/pulmonic valves on the spectral doppler, specifically the pulsed wave doppler identified?
Best assessed during diastole between peaks of normal outflow
Wrong direction
Aorta / Pulmonic - above baseline - present in diastole
MV / TV - below baseline - present in systole
Envelope 'filled in' = turbulent flow
Normally should be filled with black
Velocity = height / depth of peak
Simplified Bernoulli equation:
p1-p2=4V2 - can be used to calculate pressure difference between the valves
How is regurgitant flow through the Aorta/pulmonic valves on the spectral doppler - specifically the continuous wave doppler.
Continuous wave Doppler
• Unlimited velocity measurement, good for areas exceeding pulsed wave - good for stenosis and high blood flow
Pulsed wave - limitations on max velocity of flow it can measure
• Does not assess uniformity
• Used to measure high flow rates in aortic / pulmonic stenosis
Summarize the different ultrasound modes and they main uses.
B (Brightness) Mode:
Standard views - RPS / LPS
Identify physical changes + subjective function of heart
Identify marked functional changes
Objective measurements - such as size
Guide M-Mode / Doppler cursor placement
•M (Motion) Mode
Objective measurement of LV function & chamber size
•Doppler: Objective assessment of blood flow through the heart
Colourflow - direction & uniformity of flow, no flow velocity, mainly to guide placement of spectral doppler
Pulsed Wave - direction, uniformity and limited velocity, identifies regurgitant and turbulent flow
Continuous Wave - direction, limited uniformity but unlimited velocity (Can be used when pulse wave is limited by velocity)