PSYC3010 Exam Prep
1/167
There's no tags or description
Looks like no tags are added yet.
Name | Mastery | Learn | Test | Matching | Spaced | Call with Kai |
|---|
No analytics yet
Send a link to your students to track their progress
168 Terms
Lecture 1
Interaction
When the effect of an IV on a DV, changes at levels of the second IV
Interactions expanding understanding of established effects
Tells us the conditions that the effect will be (stronger, weaker, reversed)
Factorial design
Used when there are two or more factors affecting the DV
Main effect
The effects of each factor (IV) on the DV
Advantages of factorial design
- Examines both IV's effects on the DV
- Examines interaction between both IV's
Research questions in two -way factorial design.
Main effect of Factor A
Main effect of Factor B
A x B Interaction
Significant interaction moderating main effect
whether the effect of one factor (IV) on the DV is changed by the other factor (IV)
Does it become stronger weaker etc.
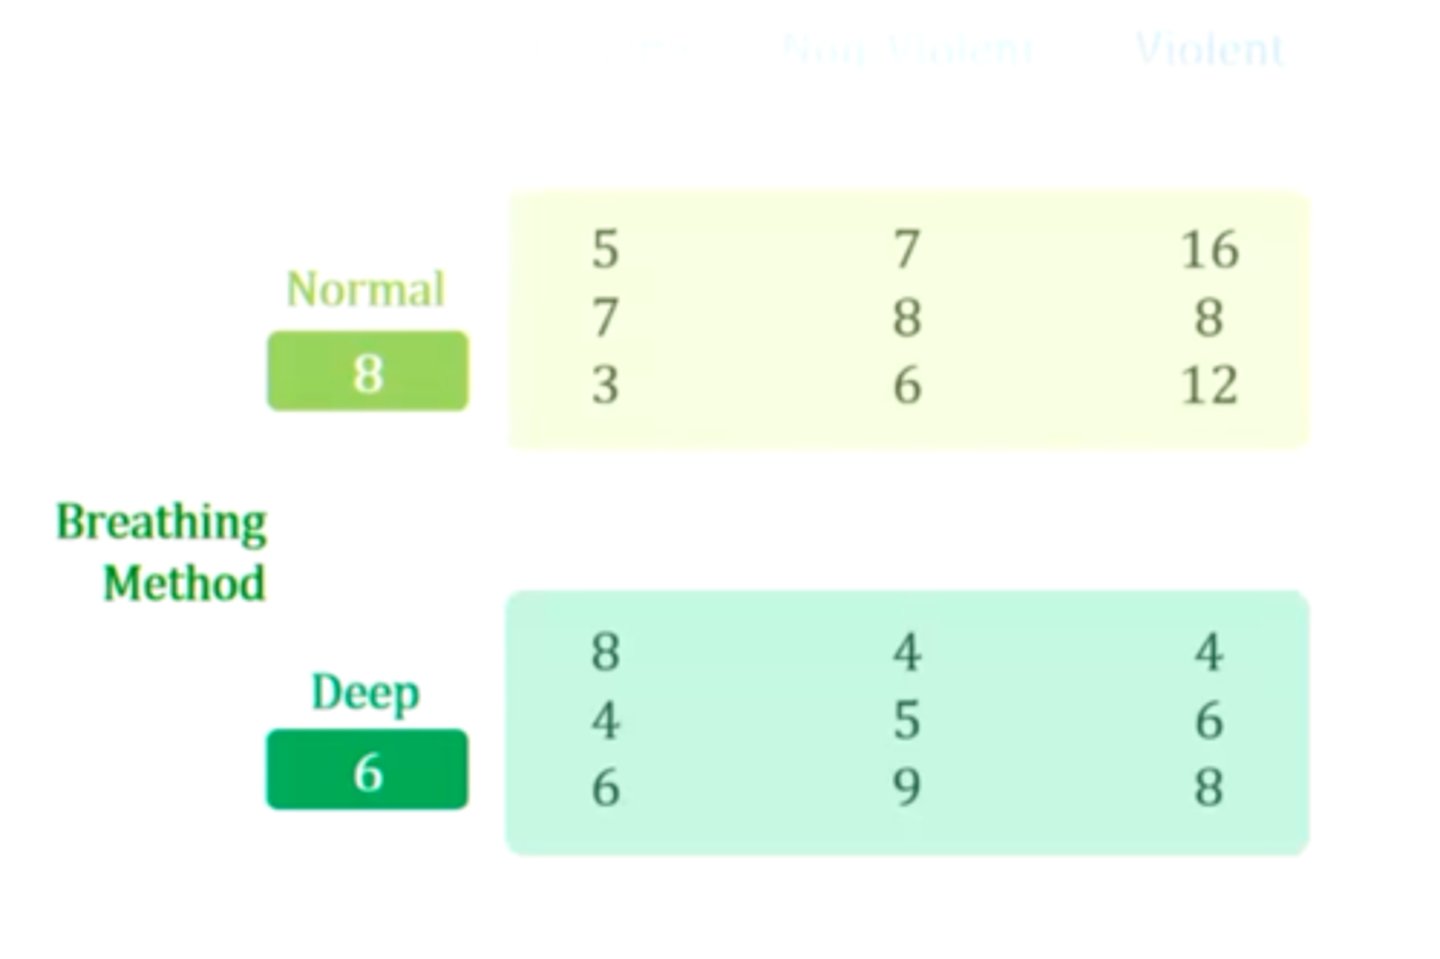
Grand mean
Mean of all scores across all levels.
Marginal Means
Means of scores at each level of one factor (IV)
Marginal Mean calculation
Averaging scores of each level of one factor, disregarding input from the other factor.
Significant Main effect?
1. There is a difference somewhere between the marginal means.
2. Run Main comparisons (Pairwise comparisons)
Significant Main comparisons (Pairwise comparisons)?
Significant difference between specific sets of marginal means
What type of test examines significant Main Effects?
F-test
What type of test examines significant Main Comparisons?
protected t-test
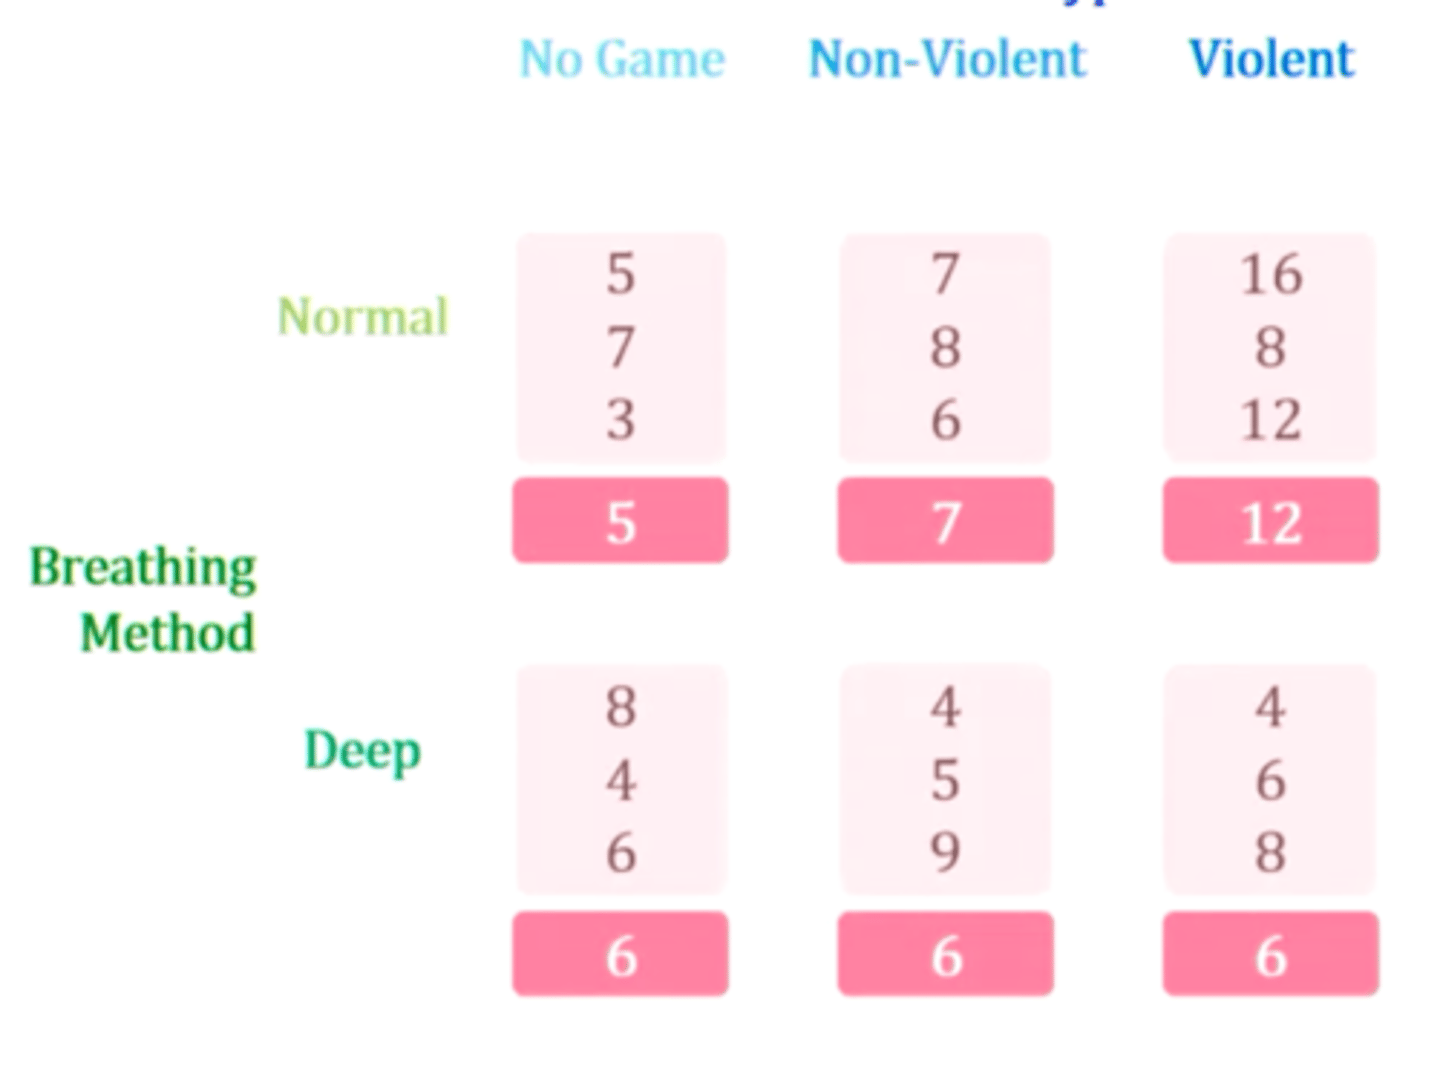
Cell Means
Average of all scores within each cell, combining both factors (IV)
Significant Interaction
1. Relationship of one IV on the DV, changes at levels of the second IV
2. Run Simple effects test
Significant Simple effects test?
1. There is a difference somewhere between the cell means
2. Run Simple comparisons
Significant Simple Comparisons (Pairwise Comparisons)?
Significant difference between specific sets of cell means
What type of test examines significant Simple Effects?
F-test
What type of test examines significant Simple Comparisons?
t-test
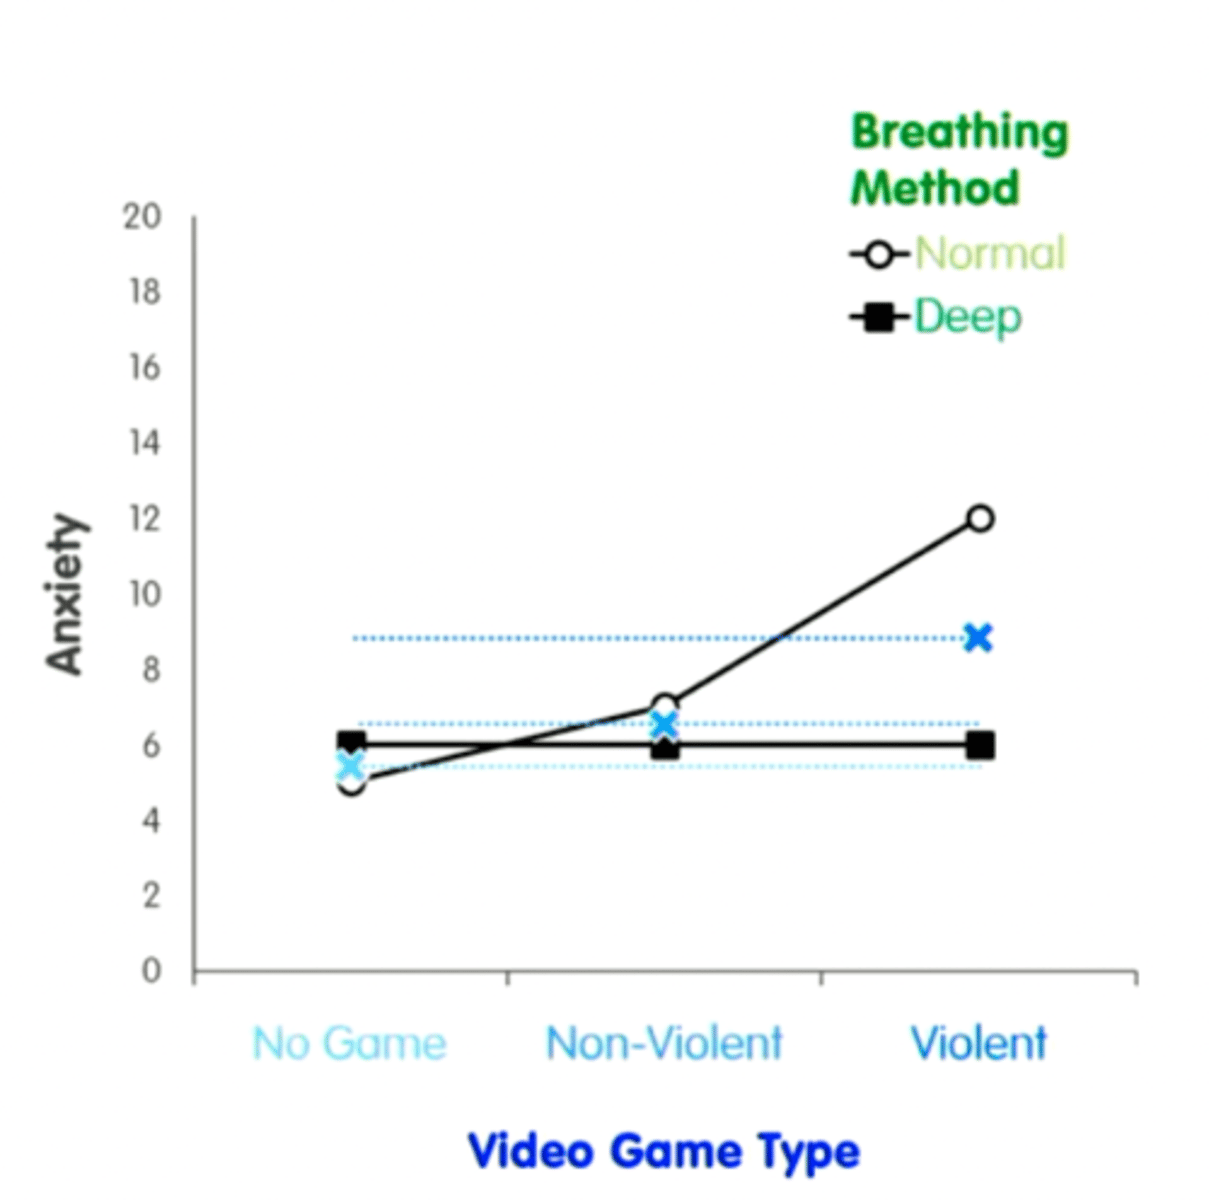
No interaction (Graph plotting)
Parallel Lines
May be Interaction (graph plotting)
Non-parallel lines
Crossed lines (graph plotting)
Disordinal interaction
Lines do not cross (graph plotting)
Ordinal Interaction
Identifying simple effects (graph plotting)
Isolate one line, identify whether values of plots are different from each other.
Difference - Yes
No Difference - No
Main effect (graph plotting)
Identify whether averages of each IV (Marginal means) are different from each other.
Difference - Yes
No Difference - No
Between-groups
Factors have different people in each condition
Within-groups
all factors have same people in each condition
Mixed groups
Mix of between and within participants.
Lecture 2
One-Way Anova Research Question
Is there an effect of the IV on the DV.
MS treatment
Between groups variance
MS error
Within groups variance
SS treatment
Between-groups variability
SS error
Within-groups variability
MS treatment =
SS treatment/df treatment
MS error
SS error/df error
F =
between groups variance/within groups variance OR MS treatment/MS error
One-Way ANOVA Structural Model
Score of person i in group j = grand mean + treatment effect of group + error associated
Two-Way ANOVA Research Questions
Main effect of Factor A on DV?
Main effect of Factor B on DV?
Factor A x B interaction?
Two-Way between-groups ANOVA portioned variance
Between groups - Factor A variance, Factor B variance, A x B variance
Within groups variance
Factor A F-test
Omnibus test that assess whether there is a difference among the group means
Factor B F-test
Omnibus test that assess whether there is a difference among the group means
Factor A x B F-test
Omnibus test that assess whether there is a difference among the group means
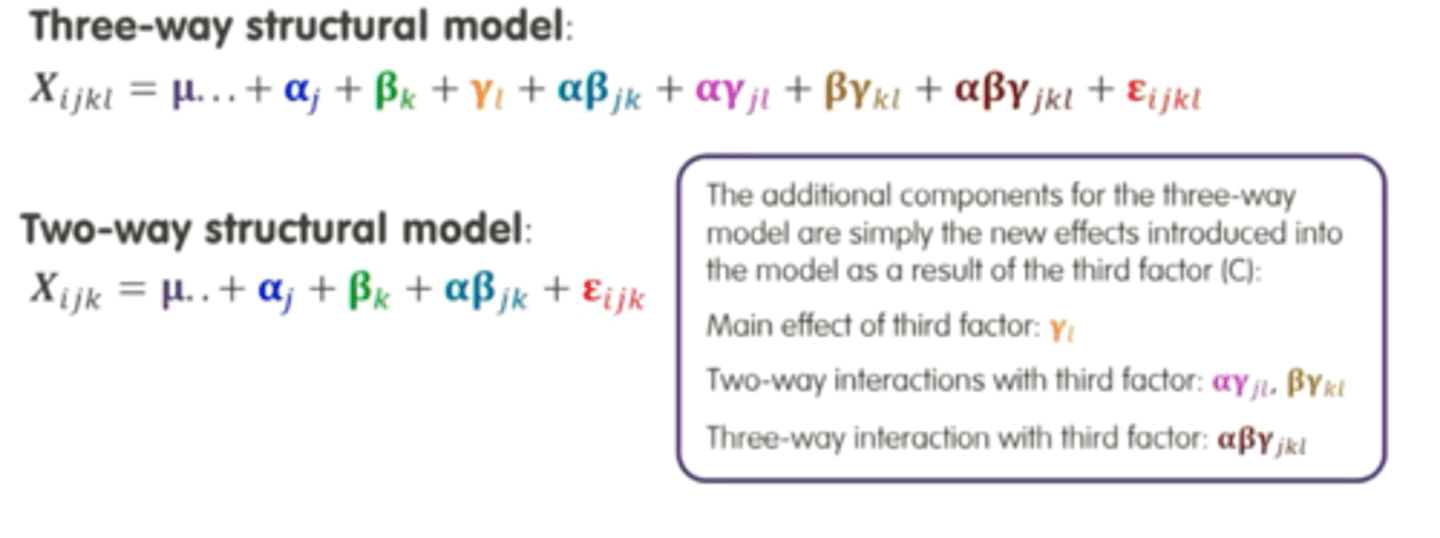
Two-Way ANOVA Structural Model
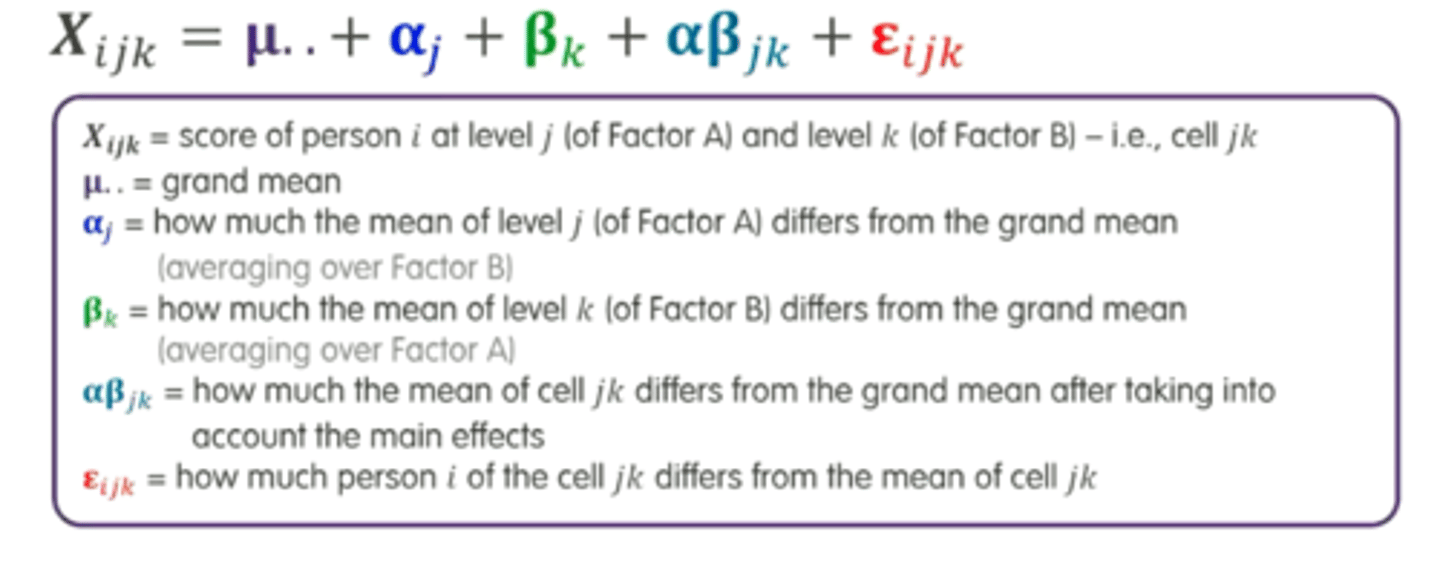
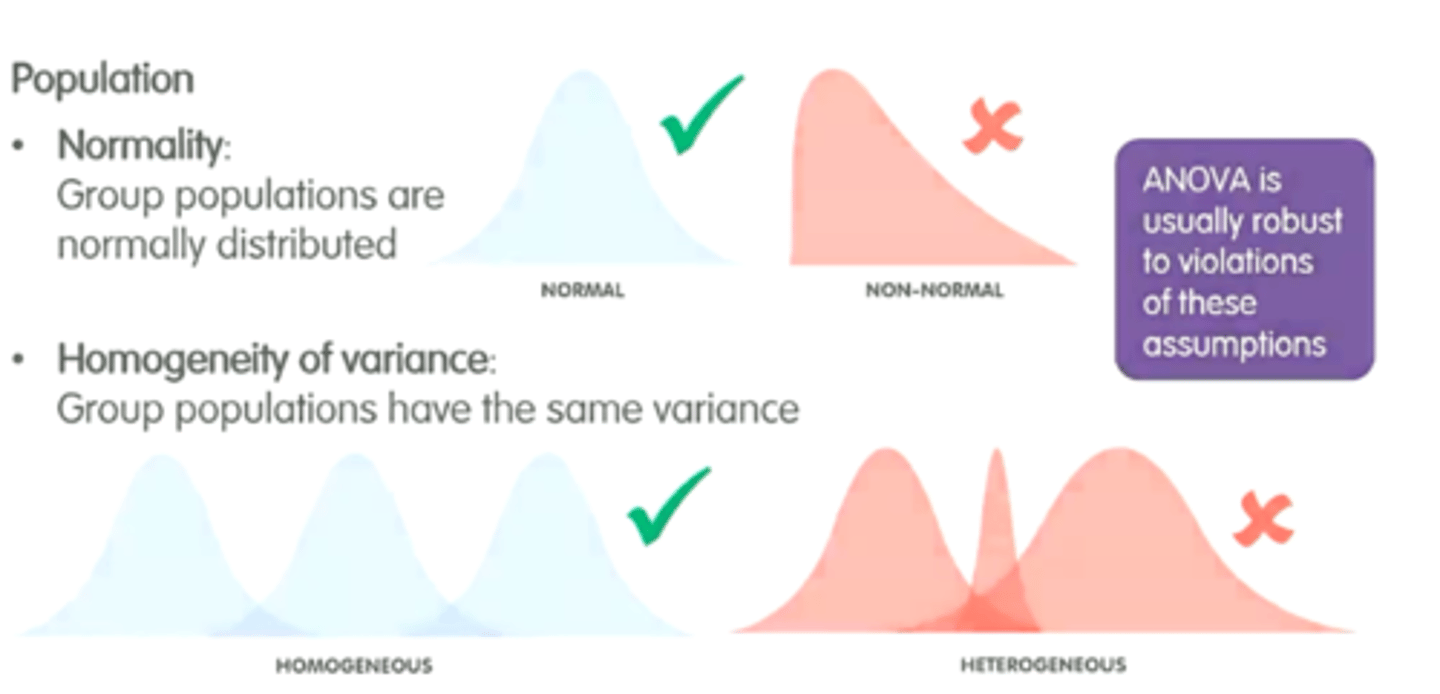
Two-Way ANOVA Assumptions
-Normal distribution
-group populations have same variance
Lecture 3
Omnibus Test
A test that looks for all possible differences among levels of a factor (IV)
Omnibus tests in two-way ANOVA
1. Main effect tests
2. Interaction tests
3. F-tests (Significance)
Following up main effects
Pairwise comparisons OR linear contrasts
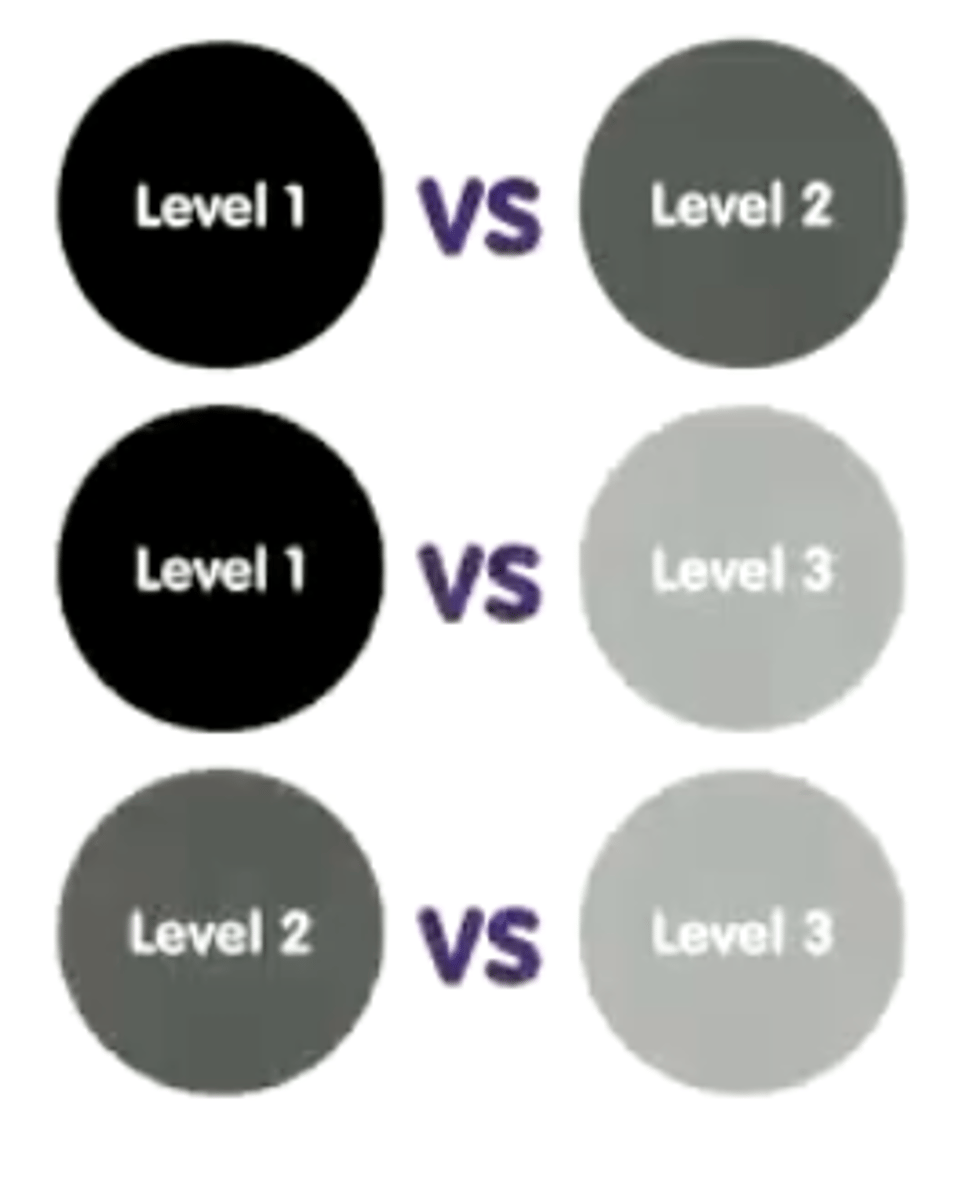
Pairwise comparisons
Compares two means at a time
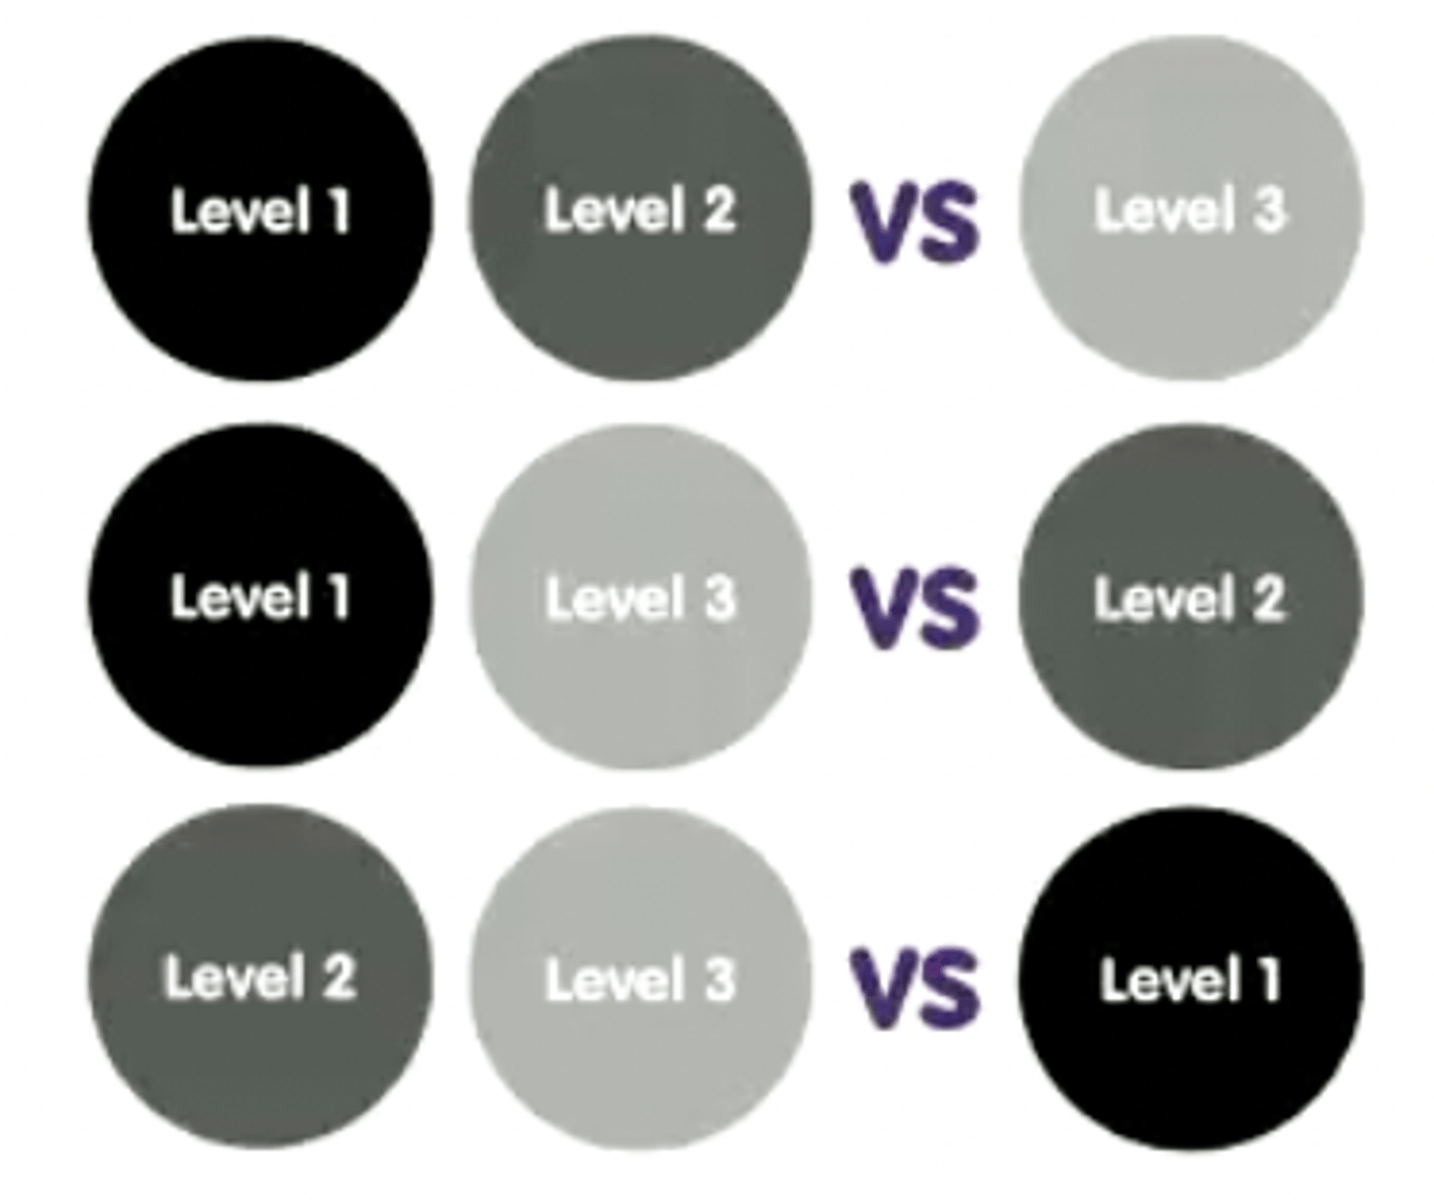
Linear contrasts
Compare one mean OR set of means to another mean OR set of means
Protected t-tests
Only run after significant main effect has been found in omnibus test
What test is used to follow up a significant two-way interaction?
simple effects test
Simple effects test
Test conducted after finding significant interaction between factors
Main effects would need to be followed up when,
1. there are >2 levels of that factor
2. the test is significant
(through Main effect comparisons)
significant t test for main effect comparison tell us,
which differences between marginal means are significant
significant F test for a simple effect tells us?
there is a statistically significant difference between cell means
Maximum number of simple effects tested
equal to the number of levels of opposing factor
Specify the circumstances in which simple effects would need to be followed up
1. if the simple effect was significant
2. If there are >2 levels
types of comparisons following up significant simple effects
simple comparisons
simple comparisons
test that tells us EXACTLY which means differ
main comparisons vs simple comparisons
main comparisons assess marginal means, simple comparisons assess cell means
what does a significant t test for a simple comparison tell us
which differences between cell means are significant
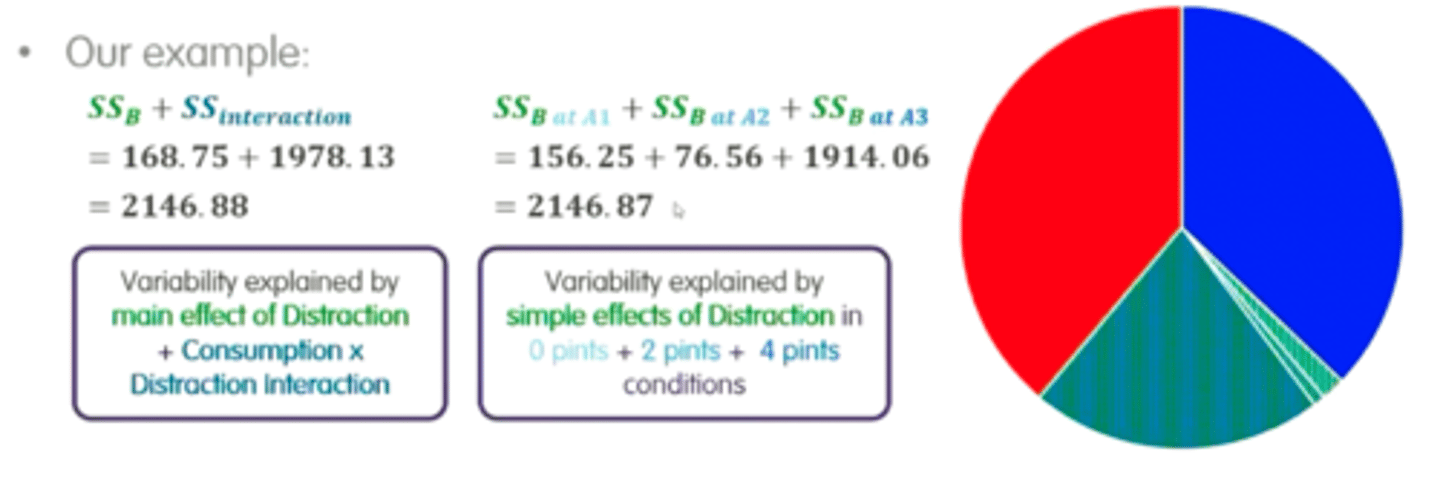
How can variance be re-partitioned
Sum of simple effects of factor (IV) x = Sum of main effect of factor x + interaction
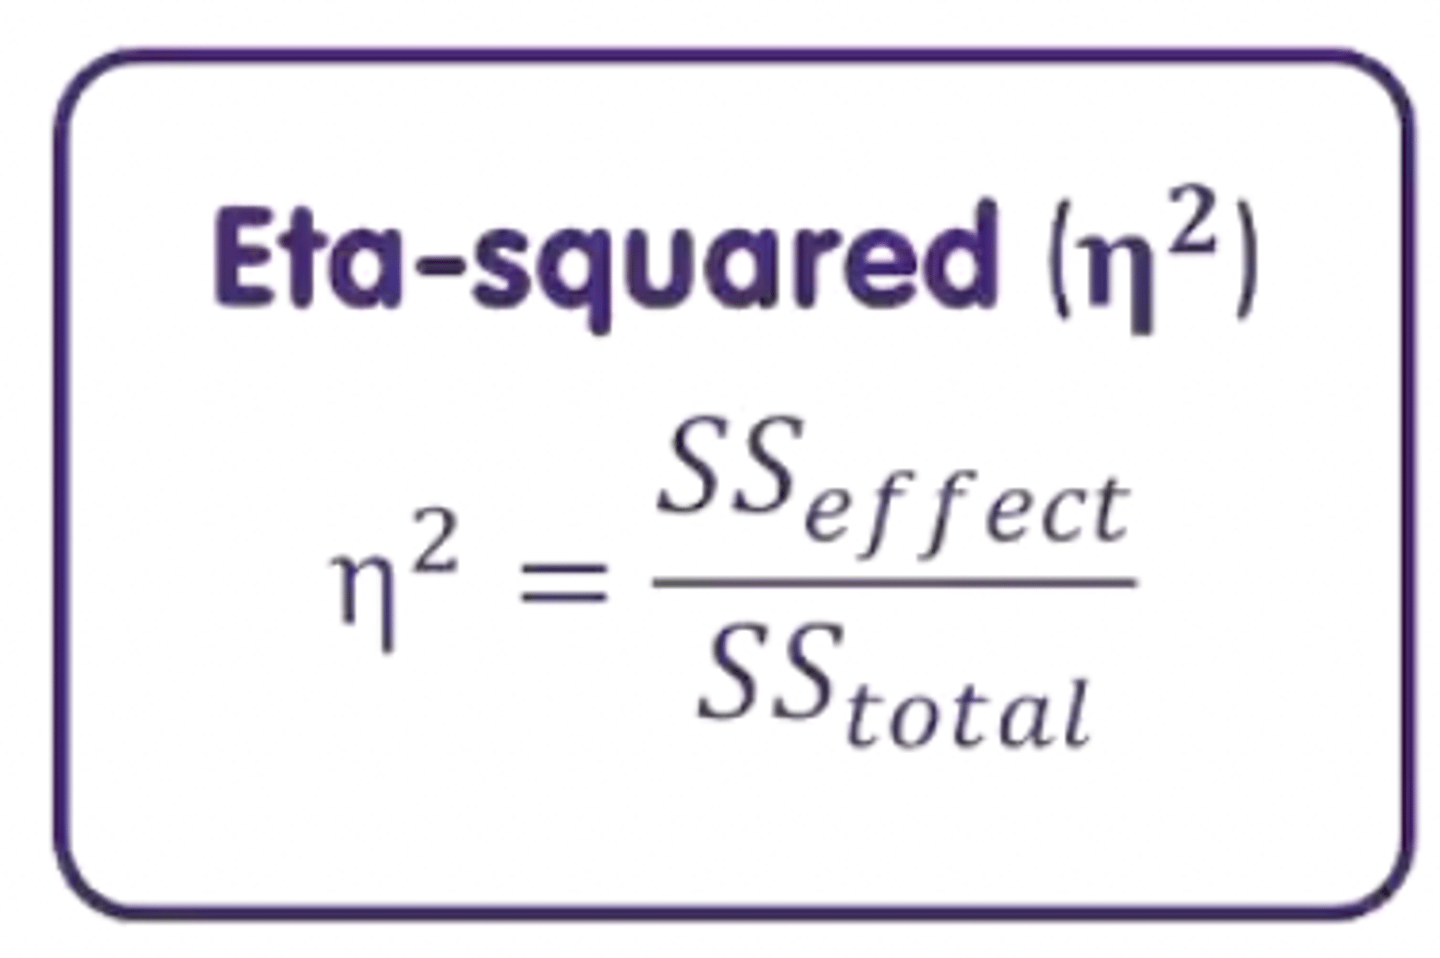
Eta-squared (η2)
proportion of total variance in the samples DV scores. (accounted for by the effect).
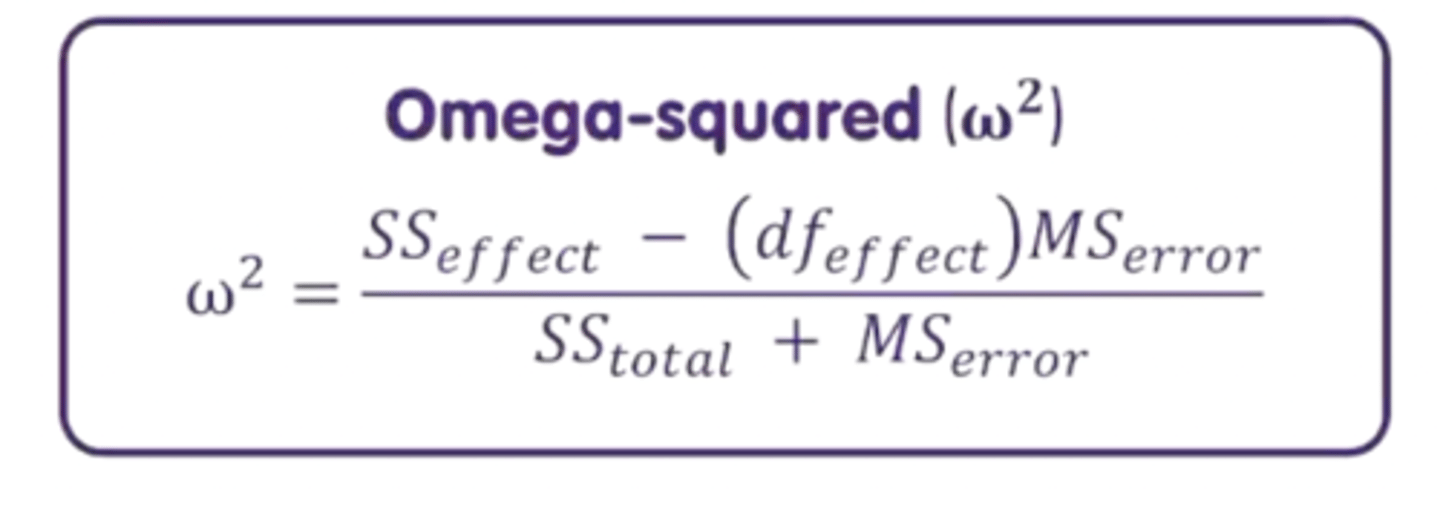
Omega-squared (ω2)
estimated proportion of total variance in the populations DV scores. (accounted for by the effect)
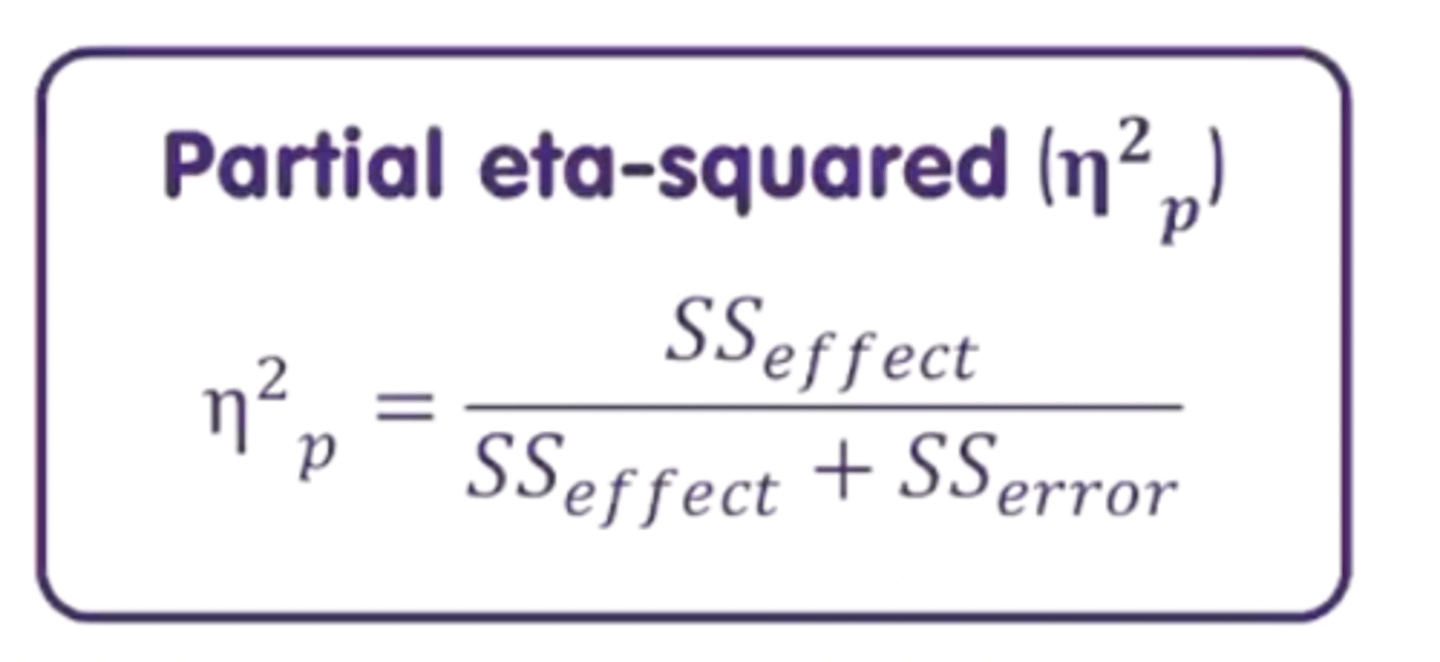
Partial eta-squared (ηp2)
proportion of residual variance (left over, not accounted for by other factors) in the sample's DV scores (accounted for by the effect).
Eta-squared (η2) vs Omega-squared (ω2)
(η2) - observed variability in the sample (may be biased)
(ω2) - estimated variability in the population
Eta-squared (η2) vs Partial eta-squared (ηp2)
η2 - proportion of total variance explained by a given factor
ηp2 - proportion of residual variance explained by any factor after removing variance from other factors.
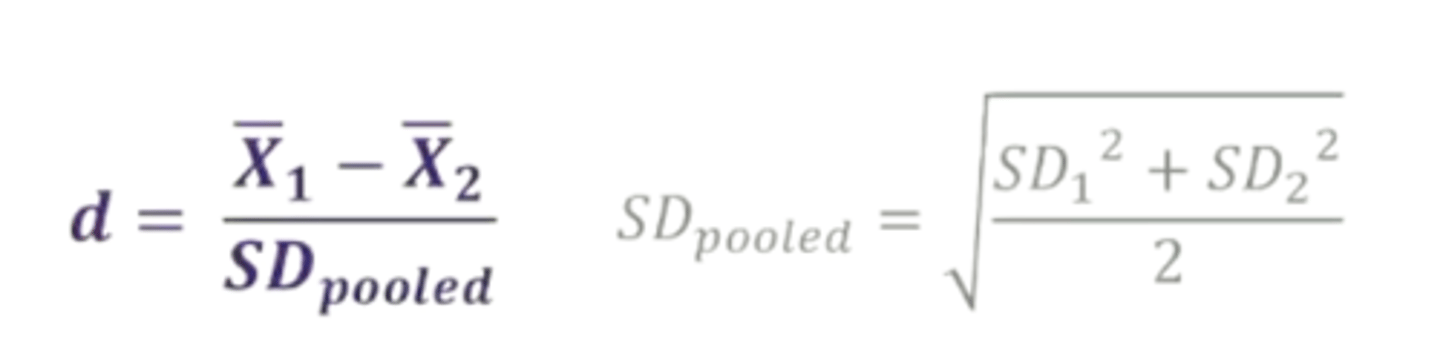
Cohen's d
how many standard deviations apart two groups are
Confidence intervals
range of values we believe contains true values of what is being measured (usually with 95% confidence).
Lecture 4
Higher-order designs
Factorial design with >2 factors
Omnibus effects in a three way ANOVA
1. Main effects x3
2. Two-way interactions x3
3. Three way interaction
Three-way ANOVA research questions
1. Main effect of factor A (IV) on the DV?
2. Main effect of factor b (IV) on the DV?
3. Main effect of factor C (IV) on the DV?
4. Factor A x B Interaction?
5. Factor A x C interaction?
6. Factor B X factor C?
7. Factor A x B x C Interaction?
Structural Model of Three-way ANOVA
omnibus two-way interactions
1. tests interaction between two factors (IV), ignoring the third factor.
2. (e.g. A x B Interaction, AVERAGING ACROSS LEVELS of Factor C)
simple two-way interactions
1. tests interaction between two factors at each level of the third factor.
2. (e.g. A x B Interaction AT EACH LEVEL of Factor C)
Simple simple effects
1. follow up from significant simple two way interactions
2. test of one factor, at each level of the second factor, at the level(s) of the third factor, given the simple two way interaction was significant
3. (e.g. effect of Factor A, at each level of Factor B, at each level for Factor C)
Simple Comparisons vs Simple simple comparisons
1. SC's - Compare levels of Factor A at each level of Factor B
2. SSC's - Compare levels of Factor A at each level of Factor B, at each level of Factor C
Lecture 5
Correlation
Tests relationships between continuous variables (Standardised)
Covariance
1. reflects the degree to which two variables vary together
2. how much a score on a variable deviates from the variables mean
Covariance limitations
1. Unstandardised measurement between two variables
2. Scale dependent
3. Can vary drastically depending on scale used
Correlation coefficient
Pearsons "r"
Names for Pearson's r
1. Pearson's correlation
2. Bivariate correlation
3. Zero-order correlation
Pearson's r
1. Standardised measure of covariance
2. indicates strength/magnitude and direction of a relationship
3. can be converted into a correlation coefficient
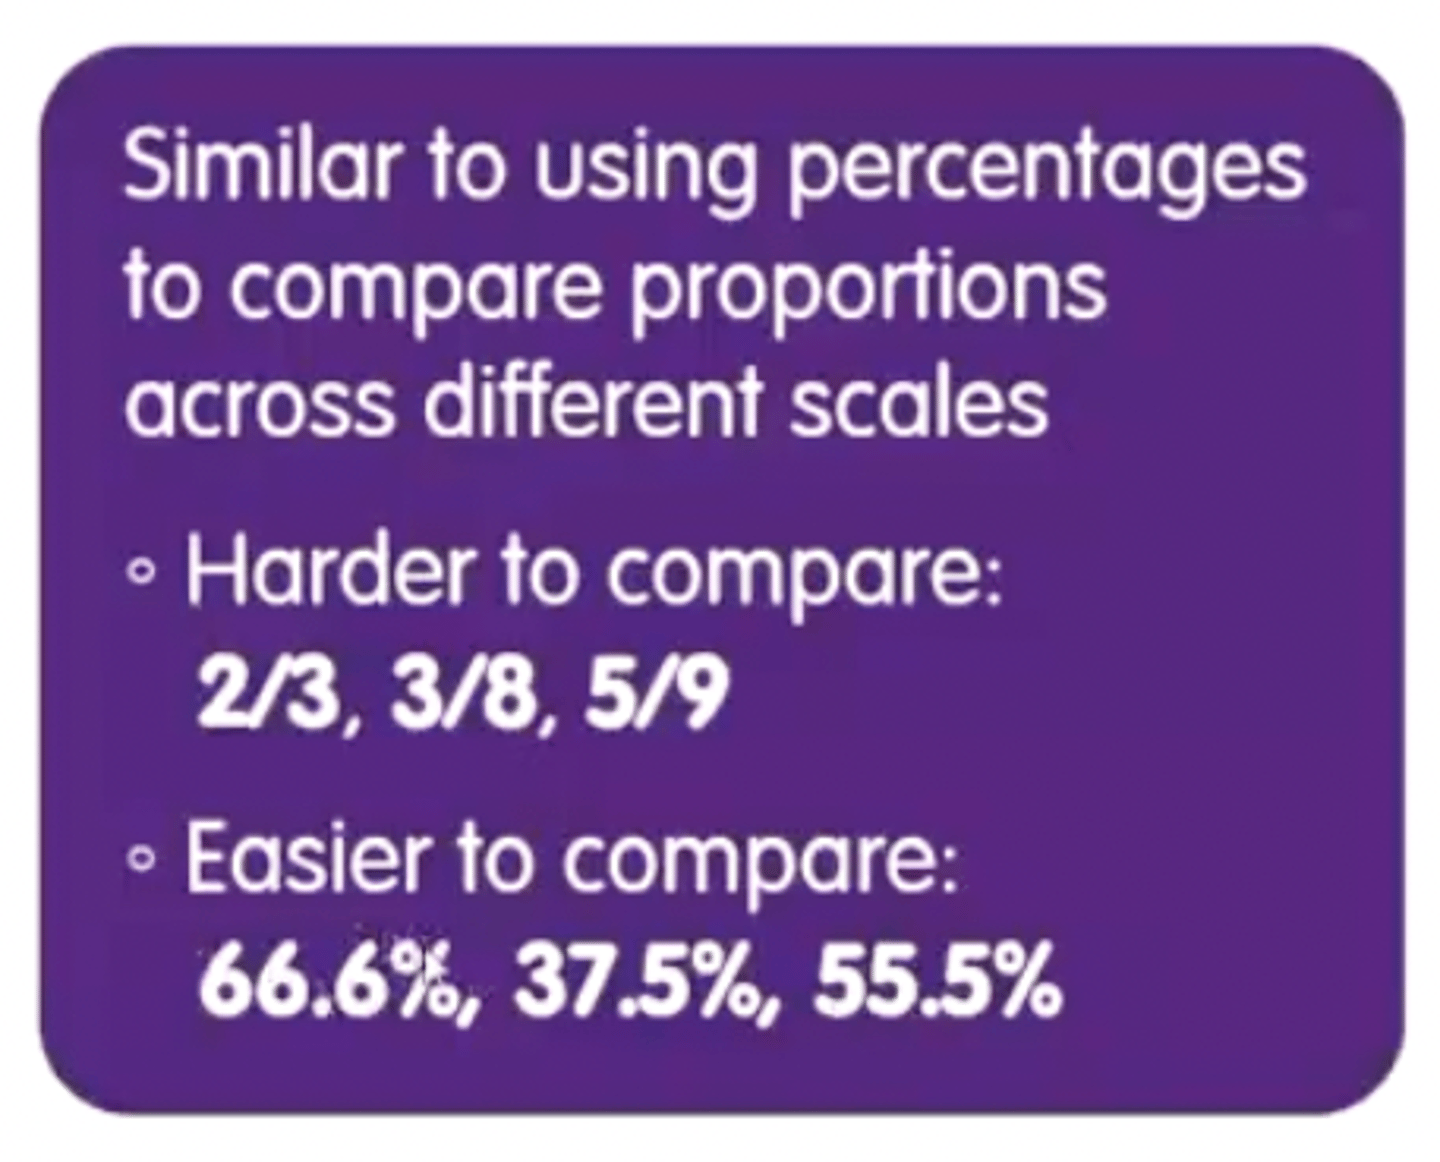
Pearson's r vs covariance
expresses the relationship in terms of standard deviations, rather than raw deviations (covariance)
r range
-1 to +1, closer r is to zero, the weaker the relationship
when testing r for significance,
we see whether it is likely to reflect an actual relationship in the population. (confirmation)
coefficient of determination
r2
r2
indicates proportion of variance in one variable that can be explained by the other.
error/residual variance =
1-r2
SSy (Total variability)
SS regression + SS residual
SS regression
Variability in Y explained by X
SS residual
Variability in Y that cannot be explained by X
r2 vs r2 adj
variance in Y accounted for by all predictors.
adjusted less biased
b
unstandardised regression coefficient