Important econ shi (study before doing 7-12)
1/25
There's no tags or description
Looks like no tags are added yet.
Name | Mastery | Learn | Test | Matching | Spaced | Call with Kai |
|---|
No analytics yet
Send a link to your students to track their progress
26 Terms
Production Possibility Frontier
Graph that represents things like feasibility, efficiency, oppurtunity costs, and economic growth

What does this specific graph represent (x axis shows quantity of jets) and y axis shows how many trains are being produced
How many trains can be produced while producing a given number of jets.

Points outside the line are (D):
Not feasible/Possible
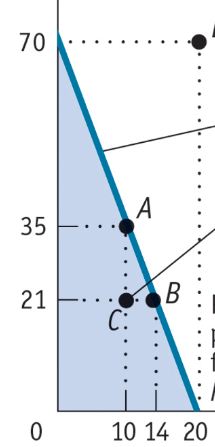
Points inside the line are (C):
Feasible/possible, but non efficient

Points directly on the line or the line it self (A/B or entire line) are:
Feasible/Possible, and efficient in production
Opportunity Cost
Real Cost of a decision - the value of what you must give up in order to get an item or outcome
Shifts in the Production possibility frontier represent:
economic growth
Supply and demand model
Model of how a competitive market works
Competitive Market
Many buyers and sellers, some good(s) or service
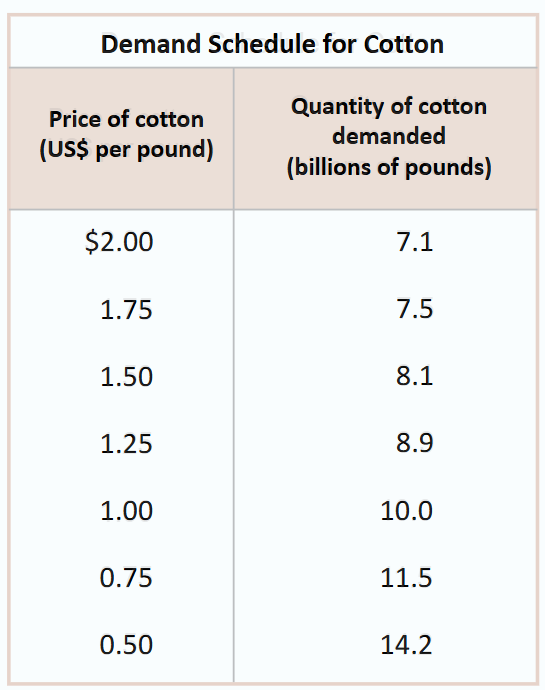
Demand schedule:
shows how much of a good/service consumers would want to buy at different prices
Law of demand
As price rises, the quantity demanded falls
An increase in population:
increases demand
Shift of the demand curve
shows the change in quantity at any given price represented by the change of the original demand curve to the new one
Movement along the demand curve:
change in the quantity demanded of a good that is a result of a change in a good’s price
An increase in demand shows a ______ shift of the demand curve
rightward
Supply schedule
shows how much of a good or service would be supplied at different prices
Supply curve
shows graphically how much of a good or service people are willing to sell at any given price
Shift of the supply curve:
change in the quantity supplied of a good at any given price
Movement along the supply curve
change in the quantity of a good that is a result of a change in that good’s price
any decrease in supply means a _____ shift of the supply curve
leftward
Equilibrium (in a competitive market)
when the quantity demanded of a good equals the quantity supplied of that good, every buyer finds a seller, and vice versa
Equilibrium price
the price at which equilibrium takes place
equlibrium quantity
the quantity of the good bought and sold at equilibrium price
Surplus
When the quantity supplied exceeds the quantity demanded, occurs when the price is above its equilibrium level
Shortage
When the quantity demanded exceeds the quantity supplied, occurs when the price is below its equilibrium level