Module 5: Continuos Probability Distribution
1/30
There's no tags or description
Looks like no tags are added yet.
Name | Mastery | Learn | Test | Matching | Spaced | Call with Kai |
|---|
No analytics yet
Send a link to your students to track their progress
31 Terms
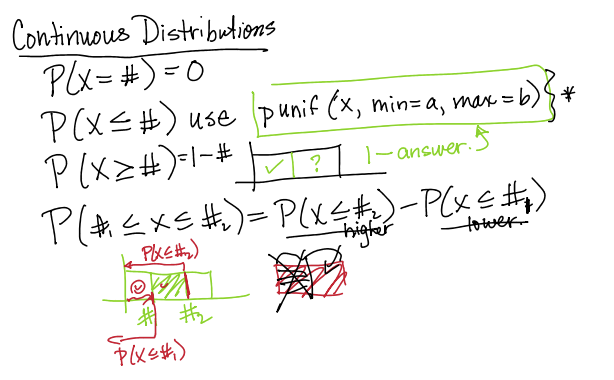
What is and why is P(X = x) in a continuous function
It is zero (0)
It is zero because in a continuous function, probability is found for intervals of x values rather than for individual x values. Also, a single value of x results in no area under the distribution in a graph; since continuous probability depends on finding the area under the graph, no area = no probability. So the probability of P(X = x) = 0
How to determine if you are finding a continuous probability
Are you asking for time, weight, height, or anything that sounds continuous
Are you looking for probabilities over an interval rather than an exact value?
Types of Continuous Distribtion
Uniform, Exponential, Normal
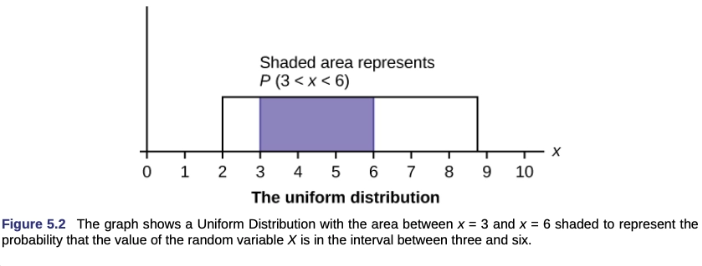
Uniform Distribtion
All values within an interval have an equal chance of occurring
Keywords: equally likely, a random value
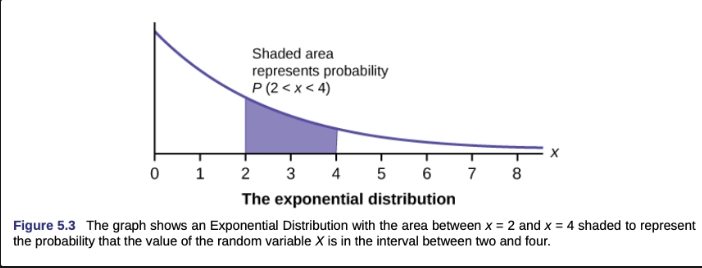
Exponential Distribution
Often used for waiting times between events; the shape is described when the y value decreases as we go along the x-value (left to right)
Why waiting times? Because, for example, you are a manager of a gas station chain. You decide to measure how long it takes for the next customer to walk in. The chance that the next customer walks in is 5 minutes is much higher than the chance that the next customer walking in is in 20 minutes
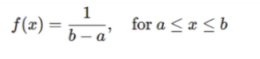
Notation for Uniform Distribution
Where: a is lowest of x, b is highest of x, in an interval

Uniform Distribution:Height?
Uniform Distribtuion: Width?
(d-c): the highest and lowest values of a range you want to find the probability for
How to find uniform distribution probability?
height: 1/b-a (which is denotedas f(x)) multiplied by (d-c: the range you want to find out)

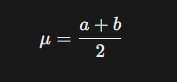
Mean (of Uniform Distribution)
Addition of lowest and highest value, divided by 2
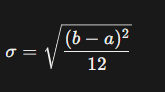
SD (for Uniform Distribution)
(variance is without the square root)
Probability Density Function (PDF formula) for Continuous Uniform Distributions
It is the height: f(x) = 1/b-a
Inverse Cumulative Probabilty
Basically a function that helps you if you were given first a probability instead of an x value, and you needed to find a x value
Identify R studio code purposes
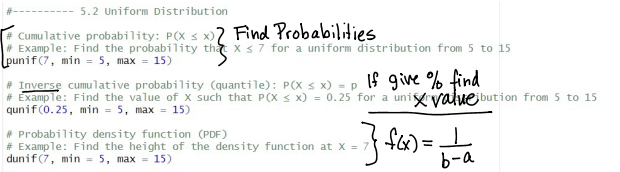
What happens (in the Uniform Distribution RStudio Code) if you were given P(X larger than or equal to) instead of the usual P(X smaller than or equal to) function found by default on the RStudio Code?
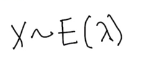
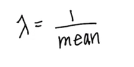
Notation for Exponential Function
Formula for Lambda in Exponential Function
Memoryless Property
used to describe exponential distribution
meaning the probability of waiting an additional time does not depend on how much time has already elapsed
How to find SD in exponential distribution
If you have mean, then you also had SD (therefore, mean = SD)
what is “expected time”
the average/mean
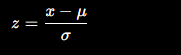
z-score formula
What to do for inverse cumulative questions
e.g. if asking you: “What is the minimum lifespan that a lightbulb must have to be at the top 10% of all light bulbs, instead of looking at the “more” value, we represent the values that represent the bottom” the 90th percentile.
(since its asking for minimum, we all know
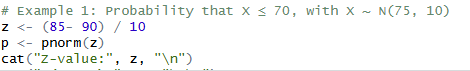
For Normal Distribution questions, what do you do if you need to use z values (standard normal) to find probabilities?
Find z value if given SD and mean
Plug Z into RStudio (pnorm)
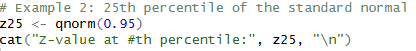
For normal distribution questions that give you mean, SD and percentage and question wants to know x, what do you do?
First put percentage into “qnorm” in RStudio. which will find a z value
Put the z value into the z-score formula, and also put the mean and SD into there as well
solve for x (qnorm)
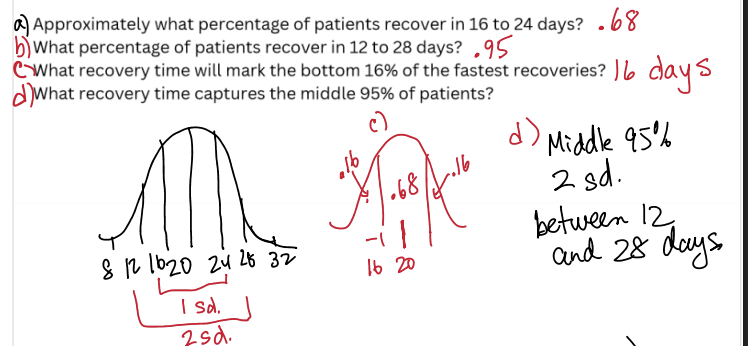
When given a normal distribution question, the mean, the SD, and asks you the probability, what do you do?
Draw out the normal distribution
Draw out the indents on the x-axis based on the SD amounts
know the empirical rule and when to properly apply the percentages to the question
Central Limit Theorem
When you take the averages of individuals groups made from a total population, the averages become more predictable and stable (even if the original data is not stable)
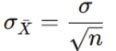
Standard Error Formula (what its used for, what is the formula)
aka the standard deviation of the sample means
How much the sample means vary from each other
Relationship between sample means and the population mean
The mean of the sample mean equals the population mean
In Central Limit Theorems, be careful when:
question is asking you if person is randomlyselected (use the population SD) or “taken form a random sample” (gotta use the SD/SE formula of the CLT)
As sample size increases, what happens to the SE
SE decreases