Choosing a Price
1/6
Earn XP
Name | Mastery | Learn | Test | Matching | Spaced | Call with Kai |
|---|
No analytics yet
Send a link to your students to track their progress
7 Terms
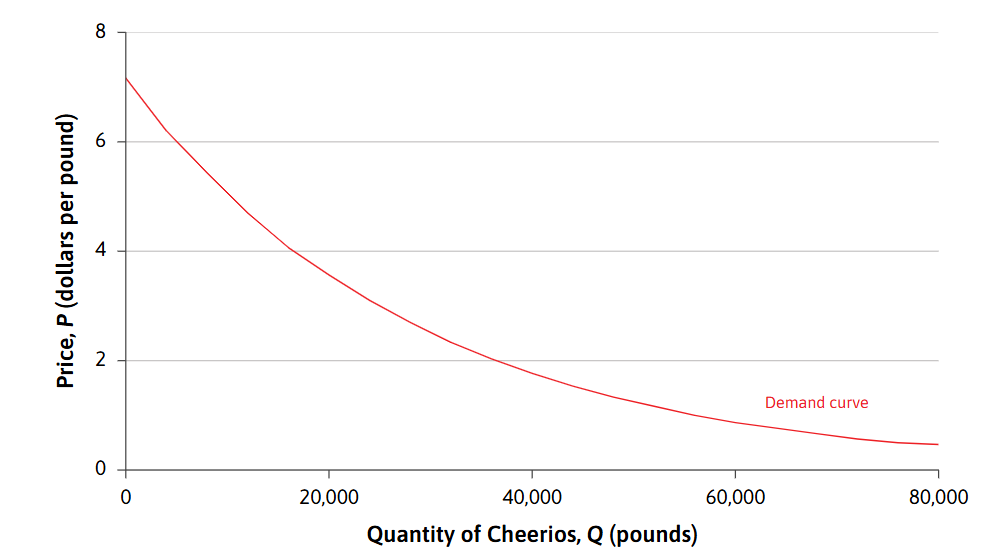
What is the demand curve?
-The curve that shows the quantity that will be bought at each possible price
What is the formula of profit?
Profit = (Price x Quantity sold) - (Unit Cost x Quantity sold)
Profit = Total Revenue - Total Costs
How can surveys allow for demand curves to be estimated?
-Demand curves simply show how many people would be willing to buy X at a price £Y.
-Thus, simply asking people, for example, would you pay £1000 to spend 10 mins in space travel, allows us to see the consumer demand for space flight
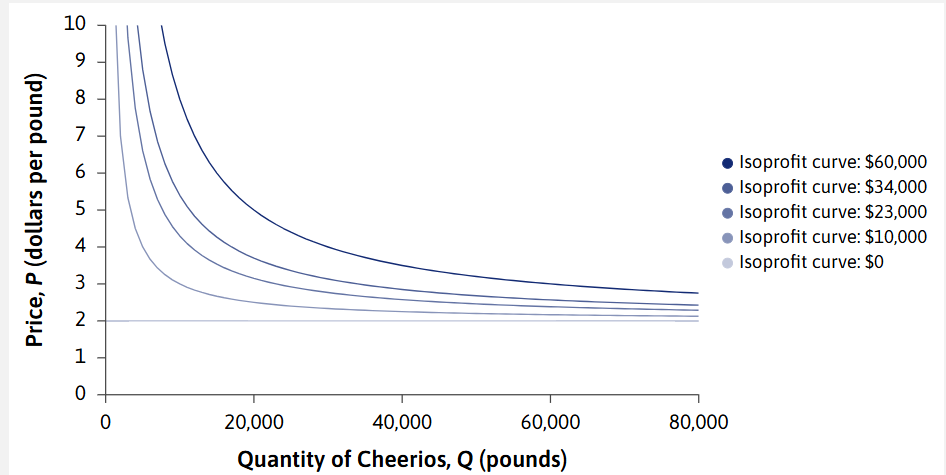
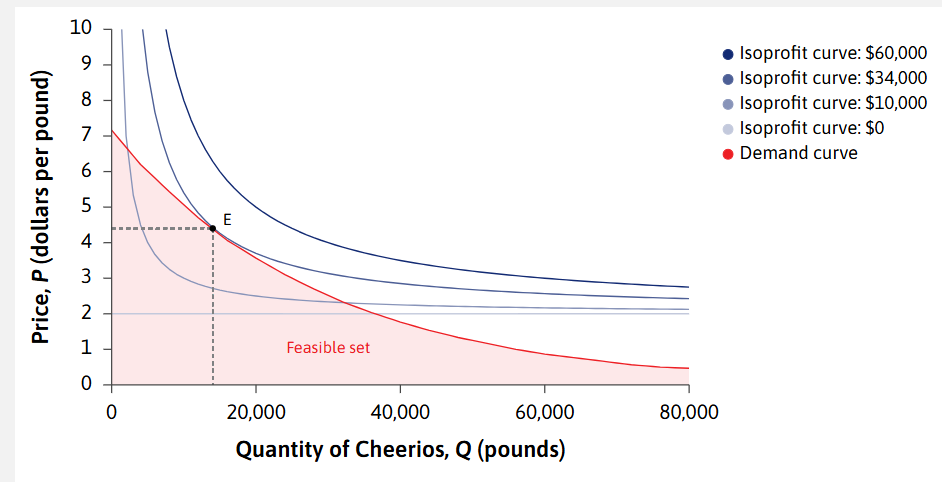
What does an iso-profit curve show?
-All of the points of price and quantity that give the same level of profit. Follows the same logic as an iso-cost and an indifference curve.
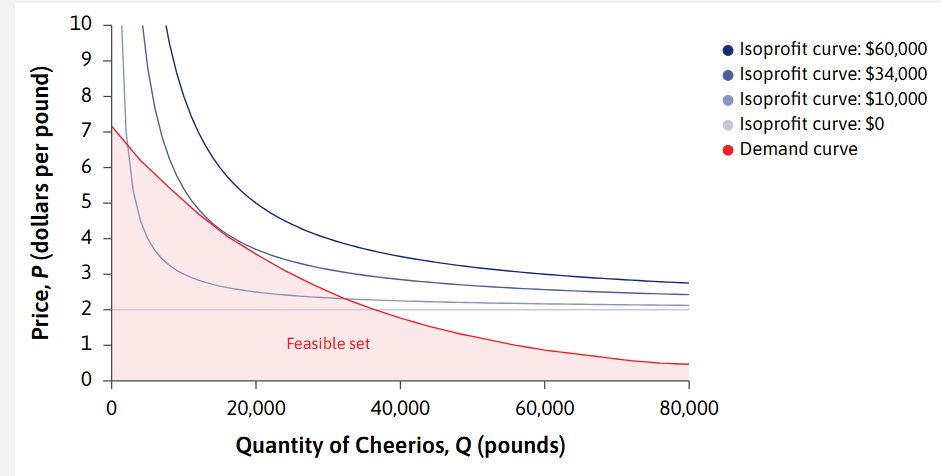
How can one find, using the iso-profit and demand curve, the point such that profit is maximised?
-Its so back - The MRT = MRS !!!!!!!
-Because the iso-profit curve has MRS in its slope, and the demand curve has MRT in its slope, it is simple stuff after that

Why can the slopes of the Iso-profit and demand curve represents MRS and MRT
-Iso-profit curve represents a trade-off one is willing to make between the price and quantity. If a higher price and small quantity led to the same amount of profit, you’d be indifferent
-Slope of the demand curve represents a trade-off one is constrained to make. The demand curve allows a transformation between quantity and price.

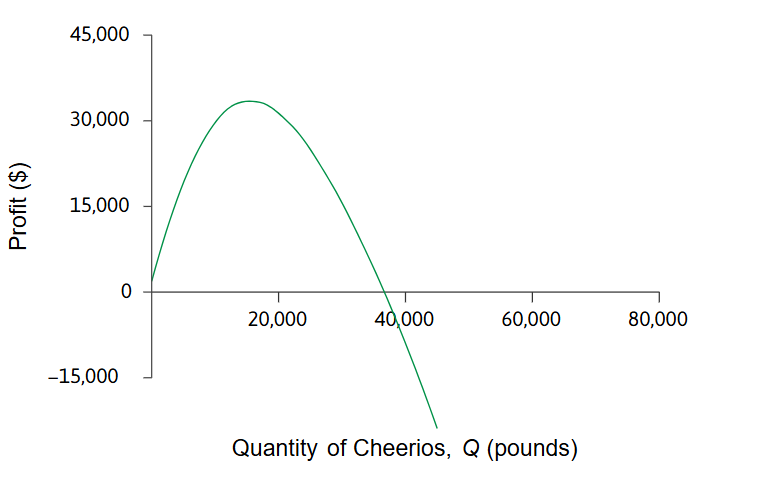
Given this, how will the firm’s profit function look as it produces?
-Before reaching point E, you are climbing the profit function
-At E, you are at the peak
-After E, you are falling off the mountain
-When you pass the iso-profit curve/line of £0, you are drowning