Moderation & Mediation
1/67
There's no tags or description
Looks like no tags are added yet.
Name | Mastery | Learn | Test | Matching | Spaced | Call with Kai | Chat |
|---|
No analytics yet
Send a link to your students to track their progress
68 Terms
Types of regression models
General linear model, generalized linear model, generalized linear mixed model
General linear regression model
Methods for data that’s normally distributed
Examples of general linear regression models
t-test, ANOVA, simple/multiple regression
Generalized linear regression model
Methods for DV that is NOT normally distributed
Examples of generalized linear regression models
Logistic regression
Generalized linear mixed regression models
Methods for nested data (=hierarchical levels of grouped data)E
Examples of generalized linear mixed regression models
HLM
HLM
Advanced regression model for nested data (=the predictor variables are varying at hierarchical levels). Separates the effect of IVs by level, in data analysis
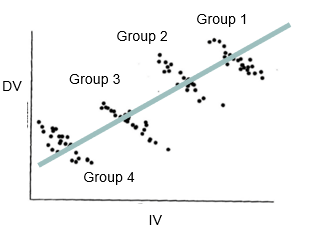
This graph is depicting what concept?
Hierarchical levels
Nested data
Hierarchical levels of grouped data. Data cases in a lower level are included in only one higher level group
Nested data typically violates this assumption
Independence of observations
Mediation analysis
Tests hypothetical causal chain where one variable X affects a second variable M and, in turn, that variable affects a third variable Y
Mediators
“How/why” of a relationship between two other variables. Indirect effect
TRUE/FALSE: Both mediators and third variables can be detected using multiple regression
TRUE
_______ are external to the bivariate correlation (problematic & spurious correlation), whereas ______ are internal to the causal variable (not problematic)
third variables; mediators
The most popular method to detect mediators
Baron & Kenny’s (1986) 4-step indirect effect
Step 1 of Baron & Kenny’s (1986) 4-step indirect effect method
Estimate the relationship btwn IV on DV. Path “C” must be significantly different from 0

Step 2 of Baron & Kenny’s (1986) 4-step indirect effect method
Estimate the relationship btwn IV on M. Path “A” must be significantly different from 0.

Step 3 of Baron & Kenny’s (1986) 4-step indirect effect method
Estimate the relationship btwn M on DV controlling for IV. Path “B” must be significantly different from 0
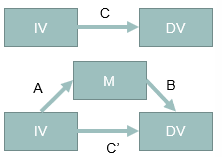
Step 4 of Baron & Kenny’s (1986) 4-step indirect effect method
Estimate the relationship btwn DV on IV controlling for M. Path “C’” should be non-significant and nearly 0


TRUE/FALSE: If there is no relationship between THE IV and DV, there is nothing to mediate
TRUE

TRUE/FALSE: If IV and M have no relationship, M is just a third variable that may or may not be associated with DV
TRUE

TRUE/FALSE: If a mediation exists, the effect of the IV on the DV will disappear (or at least weaken) when M is included in the regression. The effect of the IV on the DV goes through M.
TRUE
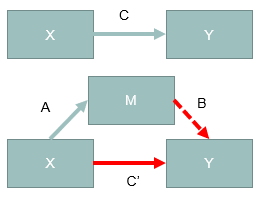
M is a full mediator
b4 is non-significant

M is a partial mediator
b4 is significant but becomes smaller
ACME (Average Casual Mediation Effects)
Represents the indirect (mediated) causal effect. Expected change in Y when X changes the mediator M, holding the direct path constant. When this is significant, it indicates a statistically meaningful X → M → Y pathway
ADE (Average Direct Effects)
Represents the direct effect. The expected change in Y when X changes while the mediator M is held constant. If this is significant, it suggests the direct effect of X on Y is statistically meaningful
Total effect
Represents the sum of the direct and indirect effects. A significant total effect is not required for mediation to existP
Prop. Mediated (Proportion Mediated)
ACME / Total Effect. Describes the relative contribution of the indirect effect. Can be unstable or uninterpretable when the total effect is small or changes sign. Should be interpreted cautiously.
Interpretation if ACME is significant and ADE is non-significant
Full mediation (indirect-only)
Interpretation if both ACME and ADE is significant
Partial mediation
Interpretation if ACME is non-significant and ADE is significant
Direct effect only (no mediation)
Interpretation if ACME is significant but both ADE and Total Effect are non-significant
Indirect-only / suppression
Bootstrap
Simulation method to estimate the variability of a statistic by repeatedly resampling the observed data. Especially more suitable for small sample sizes.
Why do we use Bootstrapping in Mediation Analysis?
Indirect effect of mediation is often not normally distributed and the Sobel test assumes normality. Bootstrapping does not assume a specific distribution and provides a more accurate and robust confidence intervals for the indirect effect
Bootstrapping helps us determine
What the sampling distribution of the test statistic would be if the null hypothesis were actually true
Null hypothesis when testing the regression coefficient β
H₀: β = 0. This means the regression coefficient is zero, implying that changes in X do not affect Y. In other words, X does not contribute to predicting Y
95% Confidence Interval includes 0 when H₀: β = 0
Fail to reject null hypotheses; not statistically significant
95% Confidence Interval does not include 0 when H₀: β = 0
Reject the null hypothesis; statistically significant
Moderation analysis
Tests whether a variable (Z) affects the direction and/or strength of the relation between an IV (X) and a DV (Y). Tests for interactions that affect WHEN (under what conditions) relationships between variables occur
_______ designs can be used to test whether an IV affects different kinds of people in different situations in the same way
Factorial
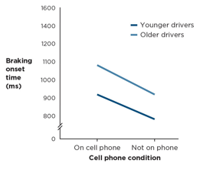
Describe the relationship shown within the graph
The effect of talking on a cell phone did not depend on age
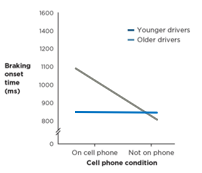
Describe the relationship shown within the graph
The effect of talking on a cell phone varies between ages
In simple terms, moderators can be described as the _______ whereas mediators can be described as the ________
when; how/why
TRUE/FALSE: Some variables can not be a moderator and/or a mediator depending on questions
FALSE
How can moderation analysis be tested?
By looking for significant interactions between the moderating variable (Z) and the IV (X)
Method to reduce multicollinearity and make moderation analysis interpretation easier
Centering for both moderator and IV
Centering
Transforms variable so that it mean becomes 0 by subtracting the mean of a variable from each value in that variable
Moderation exists if the _______ term is significant
interaction
TRUE/FALSE: A significant interaction does not require significant main effects
TRUE
TRUE/FALSE: Centering does not change the result - it stabilizes estimation and makes coefficients interprtable
TRUE
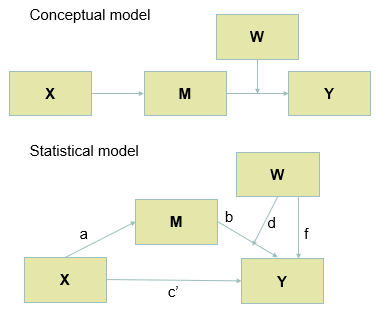
What does this model depict?
Moderated mediation
Moderated mediation
The mechanism differs depending on the person or condition. X → M → Y, but the strength of this process depends on W. Indirect effect is conditional on W
Mediated moderation
Explaining why an interaction occurs. Interaction between X and W affects Y, but this effect operates through M. Goal is to explain why interaction effect occurs.
TRUE/FALSE: Depending on what the researcher aims to explain, the same statistical model may be described as “moderated mediation” or “mediated moderation”
TRUE
Assumptions from the “gvlma” package for mod/med analysis in R
Global stat, skewness and kurtosis, link function, and heteroskedasticity
Global stat assumption
Checks whether the relationship between the dependent and independent relationship is roughly linear
Skewness and kurtosis assumption
Checks if the distribution of the residuals is normal
Link function assumption
Checks if the DV is continuous or categorical
Heteroskedasticity assumption
Checks if error variance is equally random
Simple slopes analysis
Examines how the effect of the IV changes at different levels of the moderator when the moderation is significant. Helps determine how the moderator influences the relationship between the IV and the DV by analyzing three regression lines at different levels of the moderator: Mean (M), Mean - 1SD, Mean + 1SD
Buffering effect
When the moderator weakens the IV-DV relationship, the slow follows this pattern: -1SD (steep) → Mean (moderate) → +1SD (shallow)
Enhancing effect
When the moderator strengthens the IV-DV relationship, the slope follows this pattern: -1SD (shallow) → Mean (moderate) → +1SD (steep)
When the moderator is at its mean (M = 0), the simple slope is what?
Generally equal to the regression coefficient (b1) of the IV in the moderation analysis
Rockchalk function
Automatically plots the simple slopes of the moderating effect
Black line in rockchalk function
When moderator is low
Red line in rockchalk function
Mean of the moderator
Green line in rockchalk function
When moderator is high