QMB 3602 Exam 3 Study Guide - Key Terms and Definitions
1/78
There's no tags or description
Looks like no tags are added yet.
Name | Mastery | Learn | Test | Matching | Spaced | Call with Kai |
|---|
No analytics yet
Send a link to your students to track their progress
79 Terms
types of network optimization problems
-assignment problems
-transportation problems
-transshipment problems: max and min flow problems; shortest path problems
*constraint is always =
supply node
whats being produced
Ex: Factory
-fixed positive #
demand node
whats being needed
Ex: Warehouse
-fixed negative #
transshipment node
places where products pass though, in the middle on supply and demand nodes
Ex: Distribution Center
-net flow: whats being produced (supply) = whats being needed (demand)
arcs
arrow of flow showing direction of product moving
assumptions of transshipment probs
-theres at least 1 supply and 1 demand node, theres always a start and end; the remaining r transshipment nodes
-flow through arc is only allowed in direction of arrow and the capacity for each arc is given
-has enough arc capacity for supply node to reach demand node
capacity
amount allowed to go through the arc (# on the arc)
maximum flow problem
the most flow that can be sent from one specific node to another.
-there can only be 1 source (supply) and 1 sink (demand)
max flow real life applications
-water pipes: lake provides water to neighboorhood through pipes. but as they breakup and go into diff homes the pipes get smaller since demand per home is less than whole neighboor hood demand; capacity is how much can flow through those pipes w the diff size pipes
-traffic routes: calc capacity by figure out how many lanes of traffic there r, the avg mph of cars; to figure out capacity know how many cars can get through road in given amount of time
-evacuation routes, operation of distribution network, waste management, oil pipes, water pipes, traffic routes
shortest path problem
finds the shortest time or miles from one specific node to another.
-# on arc represents minutes or miles not capacity
-Ex: to avoid traffic u might be driving further (more miles) but to get from 1 to another faster (less minutes)
-can be used to find which travel mode minimizes distance traveled, travel time, and travel cost
shortest path real life applications
-GPS: figure out shortest amount of time or change settings to show shortest amount of miles
-Delivery Services: UPS takes routws where right turns r availible to shorten time by avoiding sitting at red lights
minimum cost flow problem
objective is to min total cost
-can be more than 1 supply and demand node
-feasible solution only exists if suppy matches total demand
max flow excel
-cell names: from, to, ship(yellow), than space for <= constraint, capacity(blue), space, nodes, net flow, space for = constraint, supply/demand(blue)
-under nodes: put all node names under that will be going into from and to cells
-under net flow: =sumif(from column, first name under nodes cell, ship yellow column)-sumif(to column, first node, ship yellow column) and make it absolute by putting $ after letter of things exept first name under nodes.
-put <= constraint btwn ship and capacity
-put = constraint btwn net flow and supply/demand for all exept start and end node and type 0 for those
*make max flow cell (orange): in orange cell put = and click on first nodes net flow (I4)
-solver, objective is max, set objective is orange cell(max flow), changing cels is yellow ship, constraint is yellow ship <= capacity column and other constraint is net flow w/o start and end node = supply/demand w/o start and end nodes
min flow excel
-cell names: from, to, ship(yellow), space for <= constraint, capacity(blue), unit cost(blue), space, nodes, netflow, space for = constraint, supply/demand(blue)
-under nodes: type all nodes from problem that will go in from and to cells
-under net flow: =sumif(from column, first node, ship yellow column)-sumif(to column, first node, ship yellow column); make it absolute by putting $ after every letter that dont wanna change
-put <= constraint btwn ship and capacity expect for starting and ending nodes
-put = constraint btwn net flow and supply/demand
*make total cost cell (orange): in orange cell do =sumproduct(yellow ship column, unit cost colum blue)
-solver, objective is to min, set objective is orange cell (total cost), chaning cells is yellow ship, constraint is yellow ship w/o start and end nodes <= capacity w/o start and end nodes and other constraint is net flow = supply/demand.
shortest path excel
-cell names: from, to, on route (yellow), space, distance (blue), space, nodes, net flow, space for = constraint, supply/demand(blue)
-under supply/demand: put 1 for first node starting point and -1 for last node end point. put 0's for all transshipment nodes in btwn.
-under net flow: =sumif(from column, first node, on route yellow)-sumif(to column, first node, on route yellow); absolute it w $ after every letter exept the node since u want that to change
-put = constraint btwn net flow and supply/demand
*make total distance cell (orange): in orange cell do =sumproduct(on route yellow, distance blue)
-solver, objective is min, set objective is total distance (orange), changing cell is yellow on route, constraint is net flow = supply/demand
*where 1 is means go that way and 0 means dont go that way
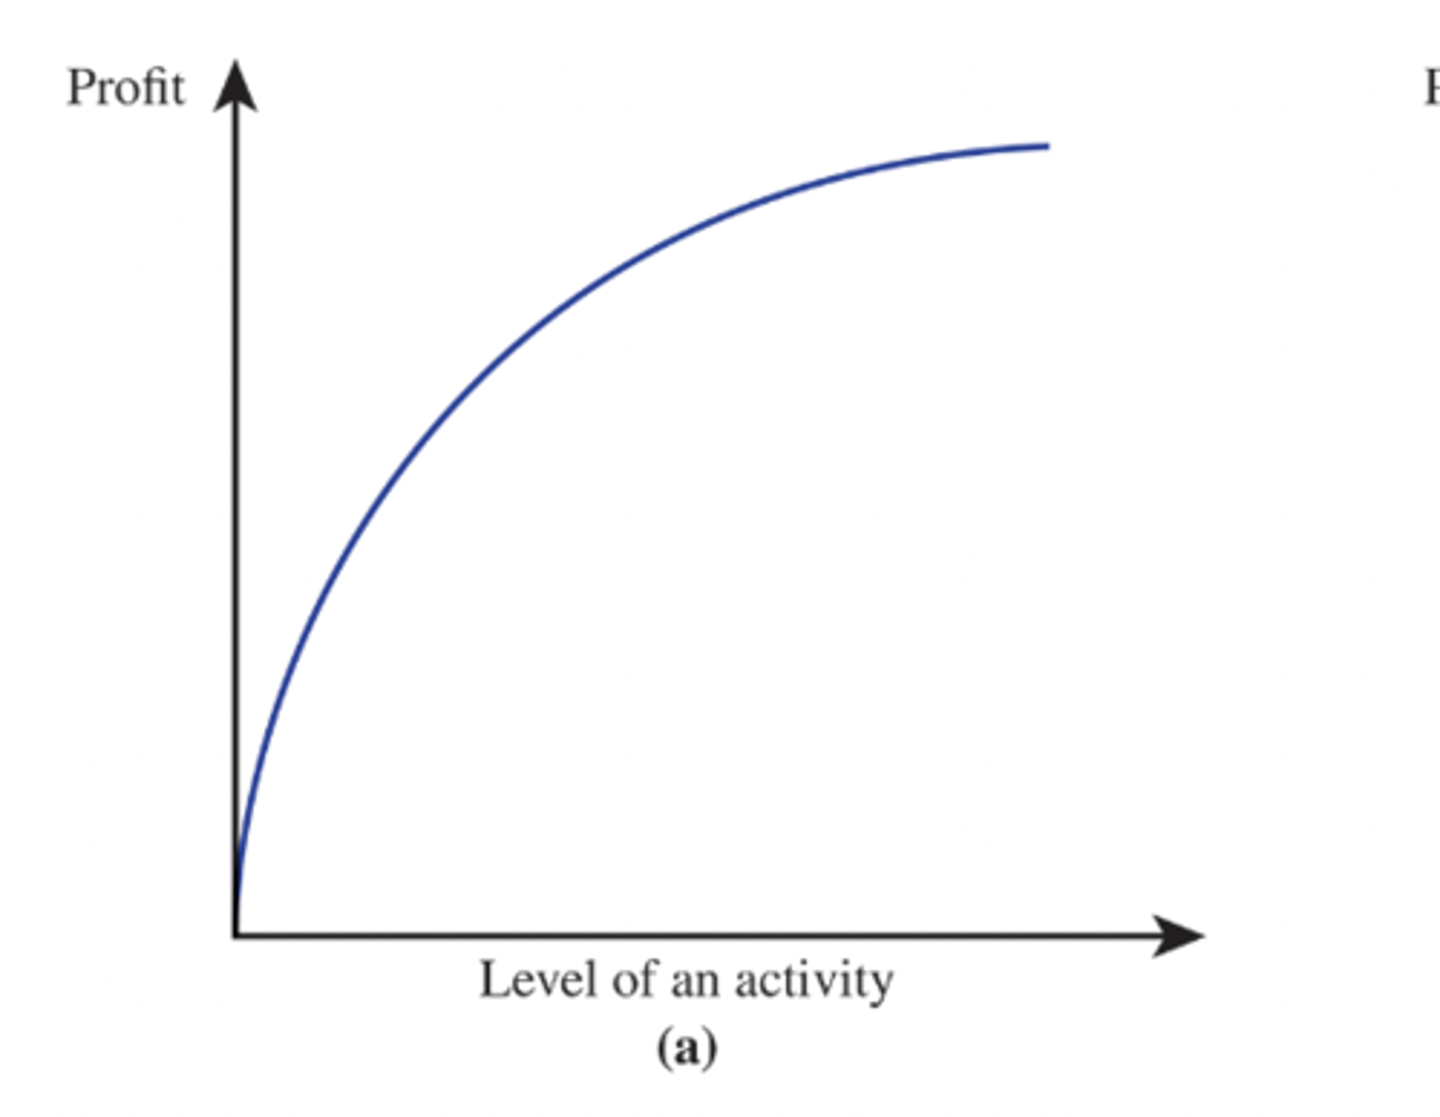
decreasing marginal returns
slope of graph profit never increases but sometimes decreases as the level of activity increases
-profit never increases and smtimes decreases for each increase in the level of activity
*for profit, if it were for cost than the graph is flipped downward
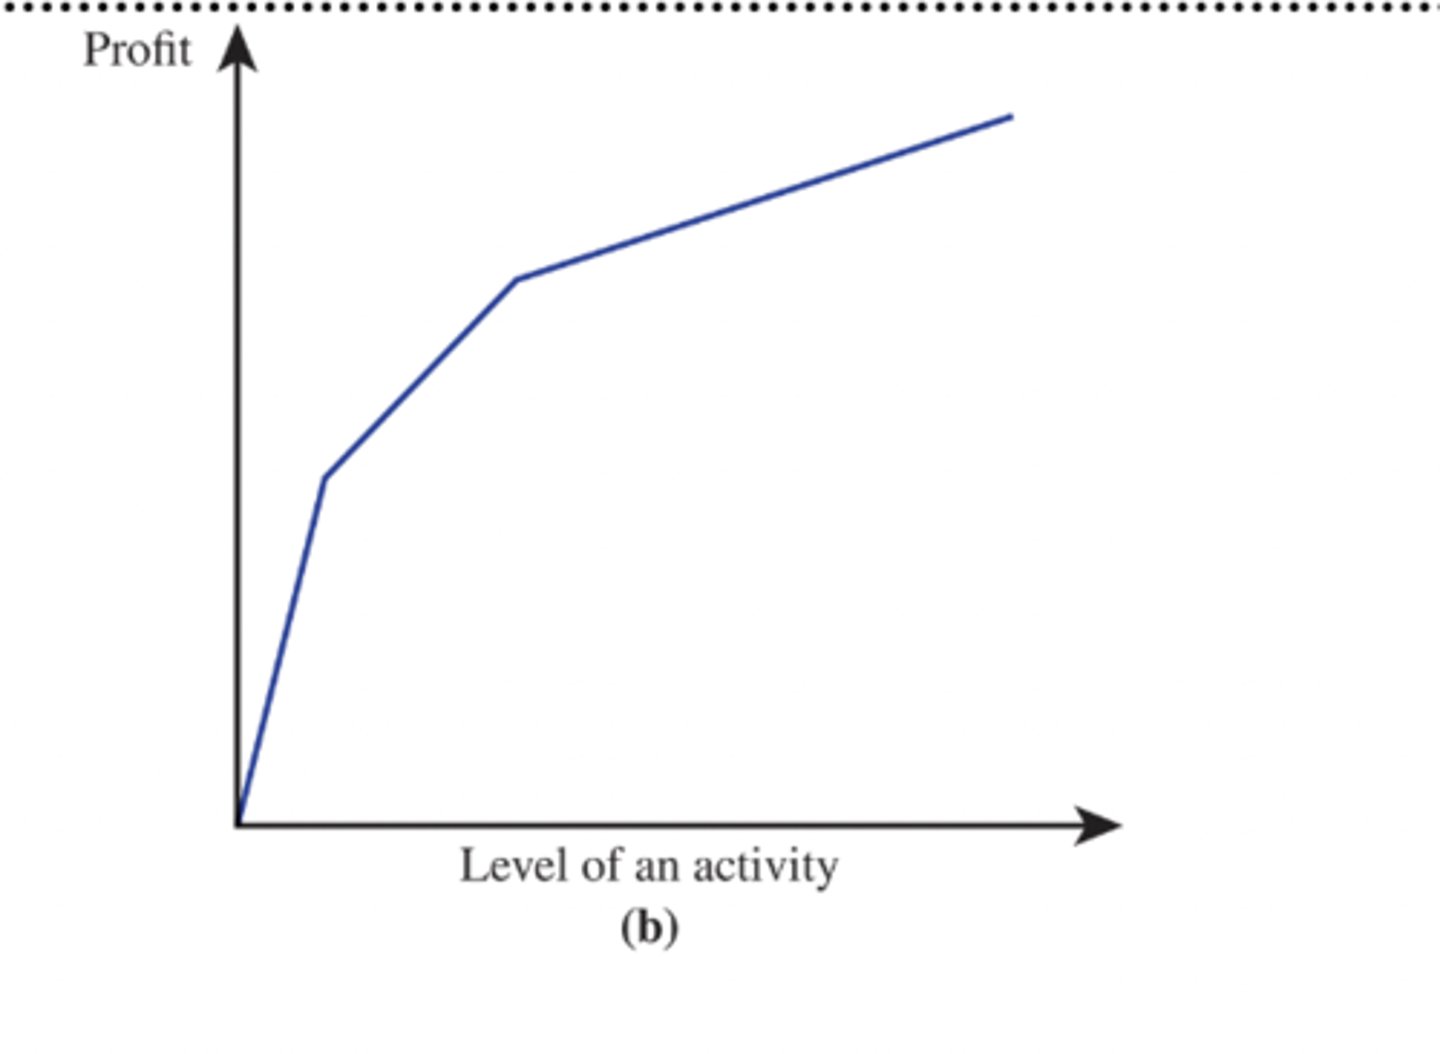
piecewise linear
as level of activity increases, the slope of profit stays the same within each line segment but than decreases at the kink where the next line segment beings
-sequence of connected line segments
*ex: overtime expenses!
*for profit; if it were for cost than the graph is flipped downward
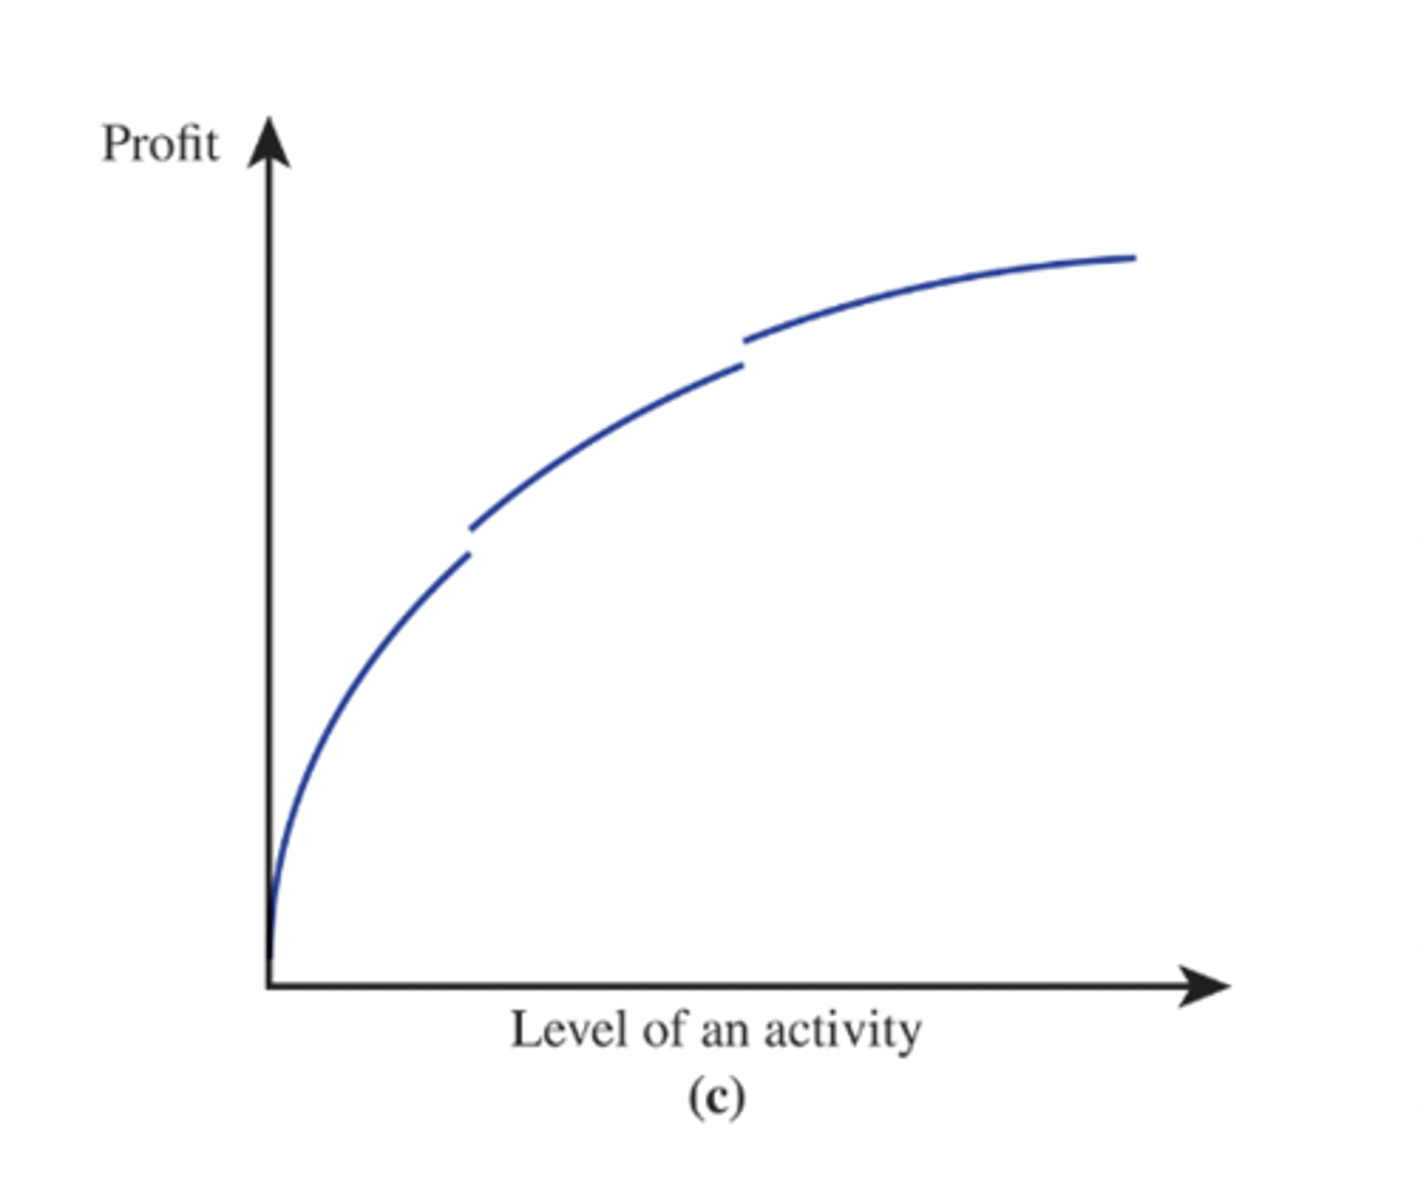
discontinuities
-profit graph is disconnected bcs it suddenly jumps up or down
*ex: quantity discounts
*for profit, if it were for cost than the graph is flipped downward
increasing marginal returns
efficiency increases as the level of the activity increases
-slope of profit graph never decreases but sometimes increases as the level of activity increases.
*for profit, if it were for cost than the graph is flipped downward

nonlinear programming
arise when the proportionality assumption is violated
-occurs when any activity has a nonproportional relationship
-proportionality assumption: contribution of each activity to the value of the objective function is proportional to the level of the activity (objective function has a coeffient times a decision varibale is the level of activity)
*probs that have decreasing marginal returns or max profits or min costs r easier to solve
*hard to solve when theres discontinuities or increasing marginal returns
Quadratic Formula
ax^2+bx+c
*x= -b/2a
nonlinear marketing example
Windor Prob
-same info from windor prob but change unit profit of doors to 375 and unit profit of windows to 700; delete the #'s out of yellow changing cells and delete orange cell.
-under units produced (yellow cells) type marketing cost: for doors do =25(marketing cost for doors)*doors produced(yellow)^2; for windows do =66.667(marketing cost for windows)*windows produced(yellow)^2
-make gross profit from sales cell: do =sumproduct(unit profit blue, unit produced yellow)
-make total marketing cost cell: do =sum(marketing cost for doors, marketing cost for windows)
-make total profit cell(orange): do =gross profit from sales-total marketing cost
-solver, objective is max, set objective is orange total profit cell, changing cell is yellow units produced, constraint is hours used <= hours availible, *change solving method from Simplex LP to GRG Nonlinear
nonlinear overtime example
Windor Prob
-same info but delete #'s out of yellow cells and delete orange cell
-under regular unit profit type overtime unit profit do 200 for doors and 100 for windows (blue).
-under regular units produced yellow cells type overtime units produced(yellow)
-nxt to yellow cells type max door and max window (blue) from prob how much produced in overtime and regular time than put <= constraint btwn (yellow) changing cells and max door and max window(blue)
-under yellow overtime type total produced: for doors do =sum(yellow doors) and for windows do =sum(yellow windows)
*adjust formulas in hours used!(white constraint): for each plant do =sumproduct(blue infront, total produced); so do total produced(white) instead of using (yellow) changing cell
-make total profit cell(orange): do =sumproduct (all blue profit, all yellow cells)
-solver, max objective, set objective is orange cell, changing cells r yellow, constraint r hours used <= hours availible other constraint is all yellow
<= max door/max window(blue)
-Use GRG Nonlinear solving method
triple bottom line
-social (people)
-environmental (planet)
-economic/finantial (profits)
*supports sustainability and continous improvement
*the 3 pilars need to be in balance in order to be sustainable and have a beneficial impact on economic growith
environmental
if company is making decisions that harm the environment, longterm ur gona have economic(profit) problems as social media sees what ur doing
*planet
social
if u have employees or community members being harmed by choices u make, in longrun ur gonna have economic impact as social media and news spread
*people and community
Global Reporting Initiative (GRI)
Sustainability reporting framework developed among stakeholders that promotes greater transperancy and facilitates benchmarking Corporate Social Resposability (CSR) efforts accross orgs
*track what ur org is doing (carbon emmisons, how far employees r driving to and from work, how much waste u have)
Sustainability
meet the needs of the present w/o compromising the ability of future geenerations to meet their needs
environmental sustainability strategy
actions to protect the enironment, provide longitivity of natural resources, mantain ecological support systems for future generations, and gaurd the endagerment of the planet
*its right to do the right thing
*u can be sustainable, socially resposable, and profitable at the same time
using sustainability and CSR
increases buyers (loyalty), reduced risk of reputation getting damaged, lowers costs and enhances employee recruting and retainment, revenue enahancements, its in the longterm intrest of shareholders
TBL
u cant just look at ur finantial bottom line, u have to look and see how ur finantial, environmental, and social responsabilities r all interconnected and how a change in 1 is gna have an impact on the other 2.
the overlap of
-people and planet r bearable
-people and profit r equitable
-planet and profit r viable
business report
when writting report think of it as a communication process, u need the reader to know, do, or understand and communicate clearly so they can use the info provided to achieve intended outcome
-guides decision making and identifies issued needed to be solved
*content, structure, and style of report is determined by ur audience and aim.
audience
request information for a specific purpose, both expert and nonexpert
aim
present facts and information, offer interpretation and analysis, recommend actions to solve an issue, help in decision making
features of report
-front matter, body, backmatter
front matter
cover, title page, executive summary (complete and consice overview of report), table of contents, list of figures
-content at the beginning of report
body
introduction (provide context, aim, structure), findings (tell reader what u found), discussion (interpret the findings), conclusions (sumarize the findings), recommendations (suggest a specific action)
back matter
Any information at the end of the report that isn't part of the text itself like the references, appendicies, equations, data, surveys, diagrams, notes
overall tips of report
-analyze the context
-write for ur audience
-chunk info and use headings
-analyze and interpret findings
-consider logical flow
Best Practices for creating reports
-Set strategic goals and objectives
-Gather and clean ur data
-Pick the right KPIs for ur audience
-Set mesurable targets and benchmarks
-Take customer feedback into consideration
-Tell story w data
-Make it visually pleasing
-Make it clear
-Dont mislead (have labels, dont be bias in info)
-Go digital
actionable insights
basis for reccomendations in a report
-novel, unusual, unexpected, unfamiliar
-aligned w key business goals and strategic initiatives
-insights come from multiple variables and r inductive or deductive conclusions.
*data>information>insights>actionable insights
researchers responsaibility to
-make sure audience understands how any insights was reached
-provide correct support so audience can understand its value and embrance the insight
insight
conclusions generated by analyzing information
data centric planning
focuses on data or info and sharing as much data or info as was discovered
-more factual and statistical
audience centric planning
focus on gaining the audiences embrance of data insights and reccomendations
-more persuasive and tells a story
-desired audience effect, report structure, content and style
*desired audience effect is the primary purpose to ultimate success of report
desired audience effect
influenced by the research question and its managment dilema, and findings and insights
-what we want them to think, feel, and do as a result of the research report
-when researcher knows the reaction wanted from research report
-controls the report structure, report organization, content and style, and info visualization
2. report structure
usually indicated by the research sponsor
-the combination of oral or written elements in the research report
-influenced by the audience composition, its size and location, and the time allocated for oral component of report
3. content and style
determined by 3 planning choices the level and types of support needed to clarify the researchers insights and reccomendations
-what info findings, insights, and reccommendations should be presented to achieve the audeince effect and in what order
-how should these be presented
-how,when,where the report will be delievered
*level of persuasion affects it
oral only structure
no official written report
-adv: ability to spread/disseminate the report quickly
-provide some written material like a handout or slideshow
written only structure
becoming less popular as tech advances
-adv: allows audience member to digest a large volume of info at their own pace
-dis: dosent offer immideate feedback and may be forgot about on the shelf and never looked at again
*can be weak on execution of change
oral plus written structure
-offers research insights and recommendations
-immidate clarification of info and analysis
-ability to develope into more detail as needed during executing decsions
-greatest flexibility
management report
adresses an audience of managers
technical report
adresses an audience of researchers that knowledgeable in analysis
infographic
visual display of most important info needed to achieve goals, compressed into a single image file
-addresses nontechnical audience like employees, suppliers, customers, media
-more complete managemnt or technical report
*more appealing (engaging), comprehensive (easy to understand), and retention (remember data)
*best to use cuz more intresting since its visual
report components
1. introduction
2. background
3. methodology
4. findings,insights,recommendations
5. appendices (for written)
1. introduction
prepares audience for report & establishes researches credibility & makes it easy for audience to navigate the info
-Title, researches profile: name, title, company, educational and experince background)
-executive summary (2 pages max) and table of contents (if report is more than 10 pages): only for written report
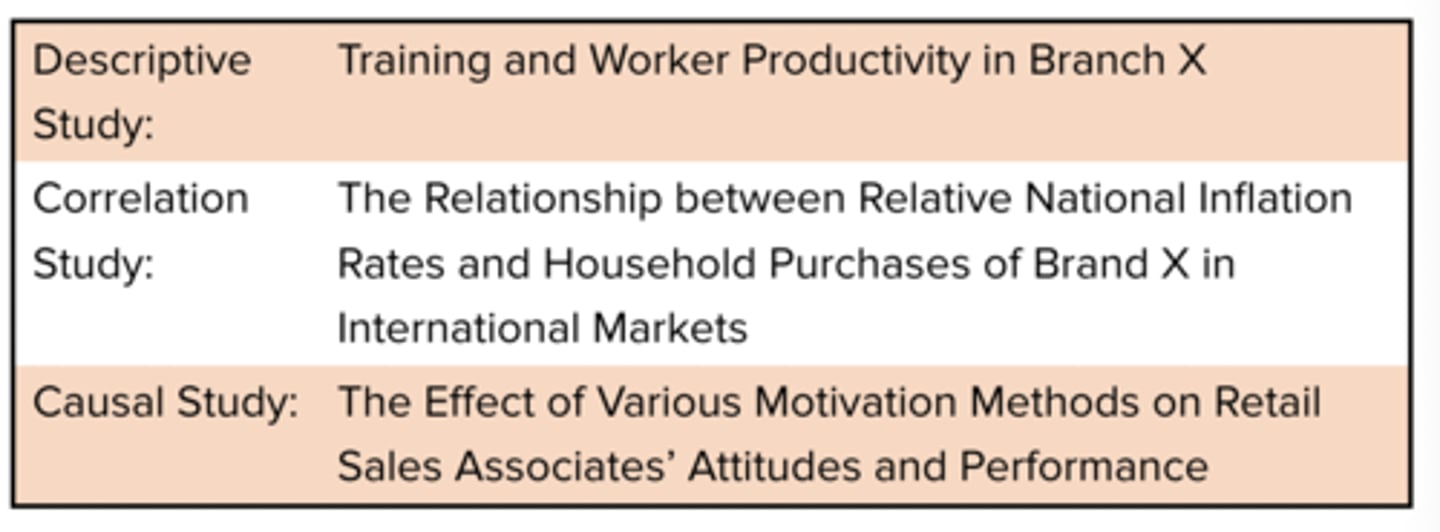
how to title business report
-be descriptive and consice, containing the scope of relevent info from project
-scope includes: variables included in study, type of relationship among the variables, population to which results r applied to
-Ex: on the pic
2. background
provide audience w knowledge critical to interpreting the research findings, establish credibility for researcher, and establish validity of the findings.
-in oral: determined by degree which auidence is involved in project decisions; the more involved the less detail
-in written: level of detail depends on project but usually includes managment question, research objectives, any info discovered during exploration that was used to interpret the data
3. methodology
summarize the sample design and profile, and the margin of error and level of confidence which the data were interpreted
-describe research design: how data was colected and why they used those methods to collect the data; longer report means more detailed info
-describe data analysis: more technical audience and longer written report, the more detailed info (written report)
-projects limitations: presentation of any methodology problems. researchers credibility increases when he discusses problems and how they were handled and increases studys validity determined by audience
4. findings, insights, recommendations
dont need to include everything u collected. include info thats critical to the audiences understanding of any hypothesis, the insights, and recommendations
-for oral: keep in mind the time aloted and audiences ability to process large amounts of info at a time
-reccomendations and their supporting data r only in written
*largest section of research report & when audience pays attention
*consider the order(report framework)of what should be reported due to shortterm or longterm recall of audience to know when to present inmportant info so they'll remeber!!
report framework
influences content order and the type of support materials
-research brief: most common
-topical, narrative(story), classification(puts recommendations, insights, and findings into categories, motivated, problem/solution, climax (least important to most important),
support materials
data visualizations, their interpretations, and stories, audio clips, and demonstrations that shows and validates the insights and reccomendations
-creates audience intrest, clarifys the researchers insights, provides emphasis for a actionable insight, offers evedence that influences audience belief
-w/o it researchers insights r percieved as unsupported claims
variety
the report shouldnt only rely on one type of support, but should instead use different forms of support
*support material
balanced
the report should include enough amount of support but show a balance btwn quantity and variety, while not overburdening the audience
*support material
spatial
the material must be workable within time and space limits
*support material
speaker specific
the support should be selected to enhance the researchers style of delivery as well as the message
*support material
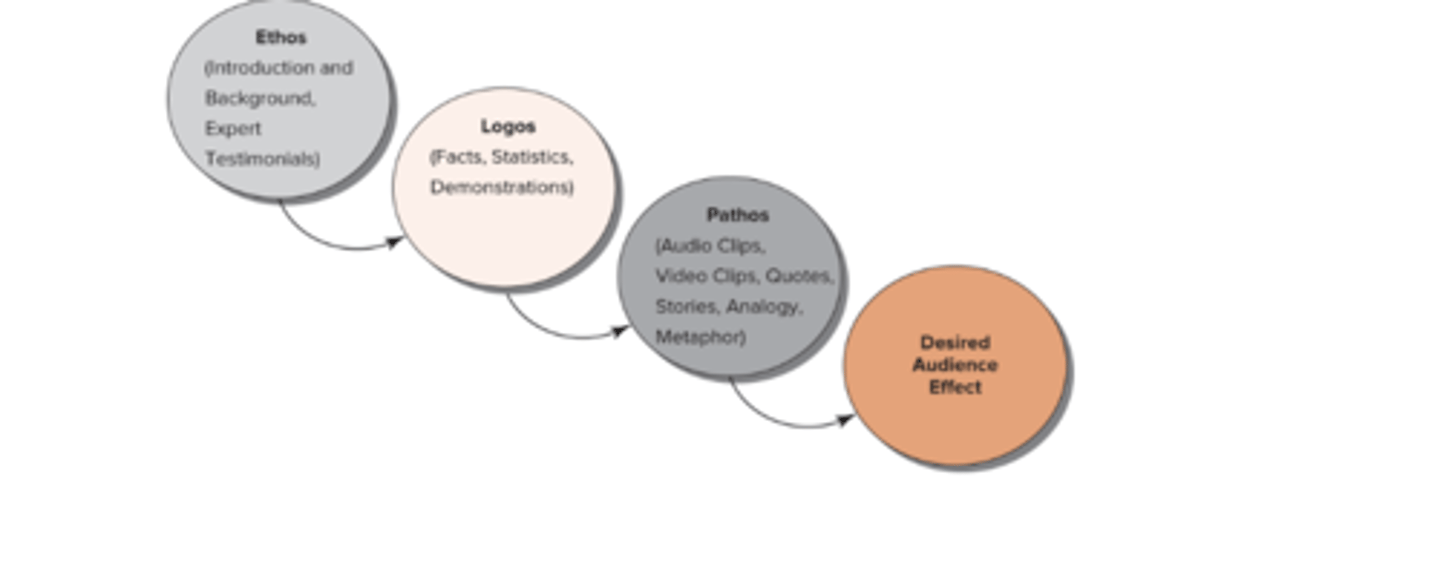
analogy
comparison of two diff things to highlight a point of similarity
*may be useful to clarify the insight, contributes to pathos
-EX: brand x is like a house w all its busy feautres and details; brand y is like a cabin thats sturdy and functional but not modern
-makes insights about perticipants perception of the construct of style come alive
presenting findings
-words/text
-tables
-graphs
words/text
when theres a small # of statistics to present words r good like phrases, sentences, lists, bullet points.
-must highlight relevant statistics like highlight it during a oral presnttion or bold it in a written presntation
tables
present data/statistics in rows and columns; more complex table more explenasion in nesessary in written
-complex tables arent in oral presentation
-if it dosent contain info central to supporting an insight that it goes to appendix in written report
graphs
reveal less info that a table but implies that the info is of greater importance, conveys comparisons more easily, and increases audience retention of the info
-diagram that shows relationship of values from a single variable or btwn two or more variables
data visualization for oral report
-picture must be on same topic as slide to enhance memorability
-audio and video clips to improve persuasivness
-motion enhances data clarity
-whitespace to leave empty space around key visuals to focus
-reduce clutter
-presentation flow markers
oral reports can be delivered
-physical venue
-via web based platform
-in combination
written reports can be delivered
-in person
-via mail or email
-as a download from server
-can go before oral, at the time of oral, or after the oral
To be ethical, researchers should
-educate the audience to the scope of the research to avoid questions that ask the researcher to go beyond the scope
-protect personally identifiable info (PPI): remove PPI data before sharing file w sponsor; keep videos and written quotes anonymos; get consent when using videos or quotes of participants whops image or PPI r used in reports
max flow prob
firm is attempting to determine the total shipping capacity of its supply network, which links a single manufacturing plant to a single customer which is a ----
proportionality assumption
requires the contribution of each activity to the value of the objective function to be proportional to the level of that activity
*nonlinear programming problems occur when this is violated and the contribution of the activity isnt proportional to the level of the activity
seperable programming technique
converts decreasing marginal return where graph is piecewise linear into a equivilant linear programming problem
-make seperate new decision varibale to represent overtime