Statistical Graphs + One and Two Variable Statisitcs
1/43
There's no tags or description
Looks like no tags are added yet.
Name | Mastery | Learn | Test | Matching | Spaced | Call with Kai |
|---|
No analytics yet
Send a link to your students to track their progress
44 Terms
Relative Frequency Formula
frequency / number of outcomes
How to do combined mean questions
1) Turn the original mean into a total
total sum = original mean x no. of values
2) Add or remove the unknown
if a no is added → new total = total sum + x
if a number is removed → new total = total sum - x
3) new mean = new total / new no of values
4) find the unknown!
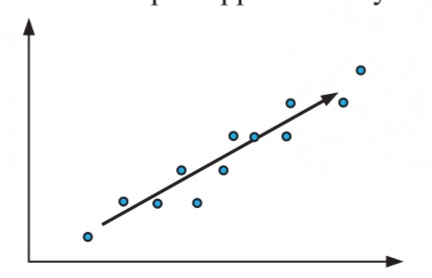
Linear correlation relationship
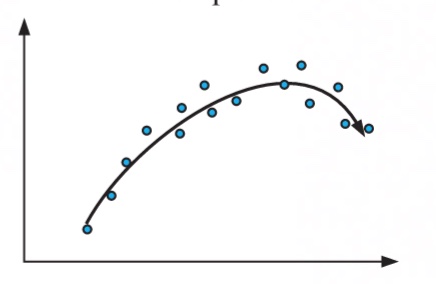
non-linear correlation relationship
which strength?
strong
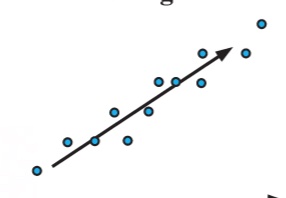
which strength?
moderate
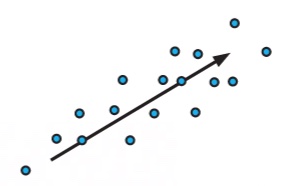
which strength?
weak
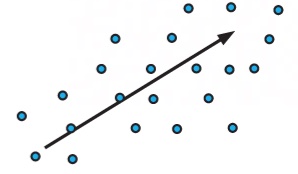
pos or negative?
postitive
Number data
data which can be written as numbers
Discrete numerical data
takes exact number values, and results from counting
Continuous numerical values
within a continuous range, and usually results from measuring (eg. time, height)
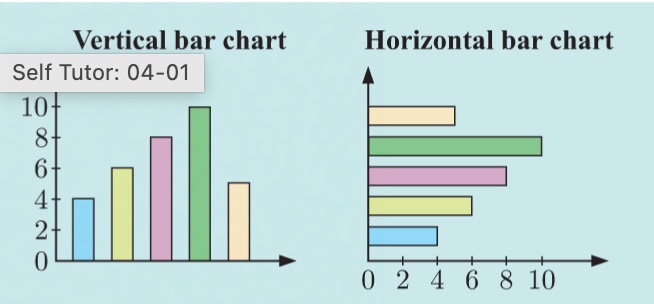
What is this?
Bar chart
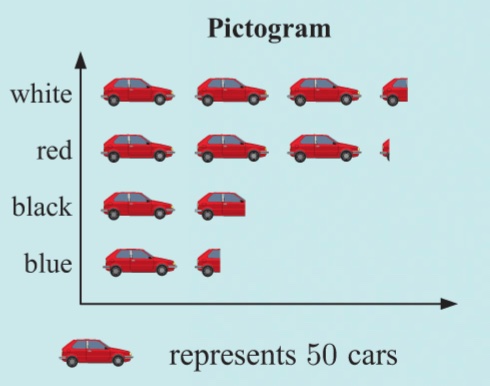
What is this?
Pictogram
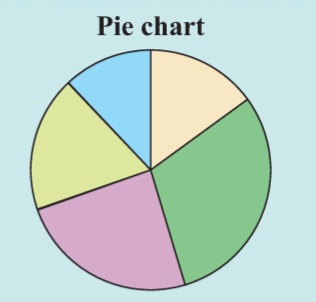
What is this?
Pie Chart
how to find a sector of a pie chart?
sector angle = value/total x 360
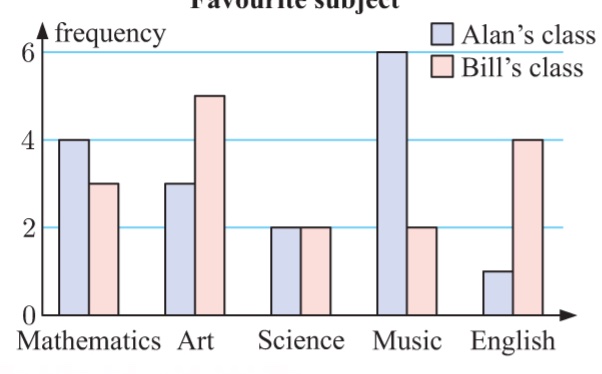
what is this
multiple bar chart
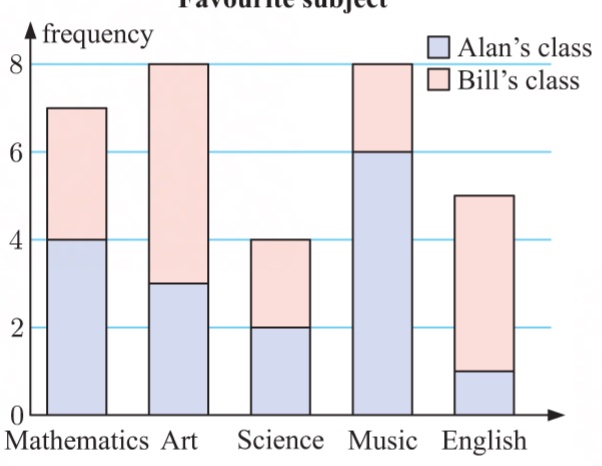
what is this
composite bar chart
population
is a collection of individuals or objects about which we want to draw conclusions
cenus
process of collecting data from the whole population
sample
a group of individuals from the population
survery
process of collecting data from a sample
quantitative varible
data is given in number form, is often called a numerical variable, info collected is called numerical data
quantitative can be
discrete or continous
discrete quantitative variable
takes exact number values, usually a result of counting
continuous quantitative variable
any numerical value with a certain range, usally a result of measuring
How to construct a stem plot
firstly unordered stem plot and then CAREFULLY order the stem plot
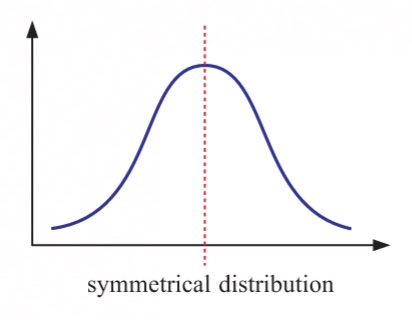
what is this? distribution
symmetrical
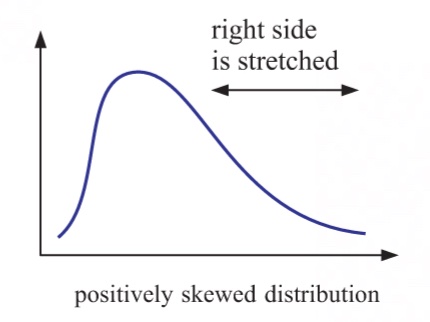
what is this? distribution
positivity skewed
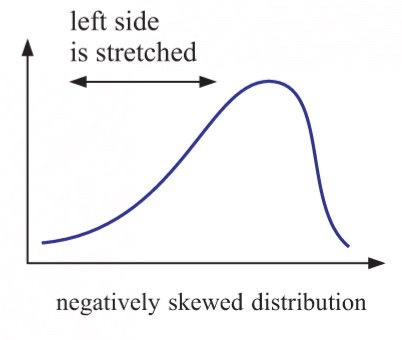
what is this? distribution
negatively skewed
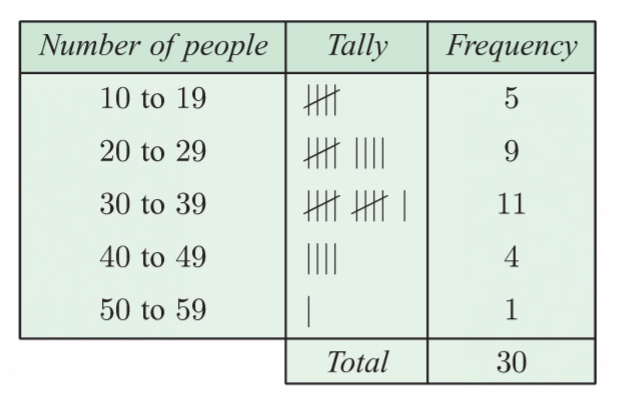
group discrete data
we group the data into class intervals
continuous data
organised using class intervals, commonly use a frequency histogram (no gaps)
modal class
the class of values that appears most often, on a freq histogram the modal class has the highest bar
mode
most frequently occurring value in the data set
mean
mean = sum of all data values / the no. of data values
median
middle value of an ordered-data set (n+1)/2
range =
maximum - minimum
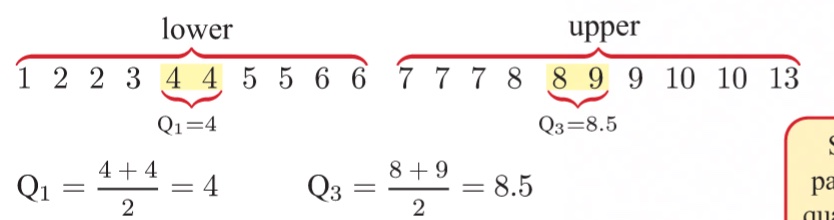
quartiles + interquartile range
the median divides the ordered data set into two halves and these halves are divided in half again by the quartiles

interquartile range
the range of the middle half of the data
interquartile = upper quartile - lower quartile = Q3 - Q1
estimating the center of data in class intervals
find the midpoint
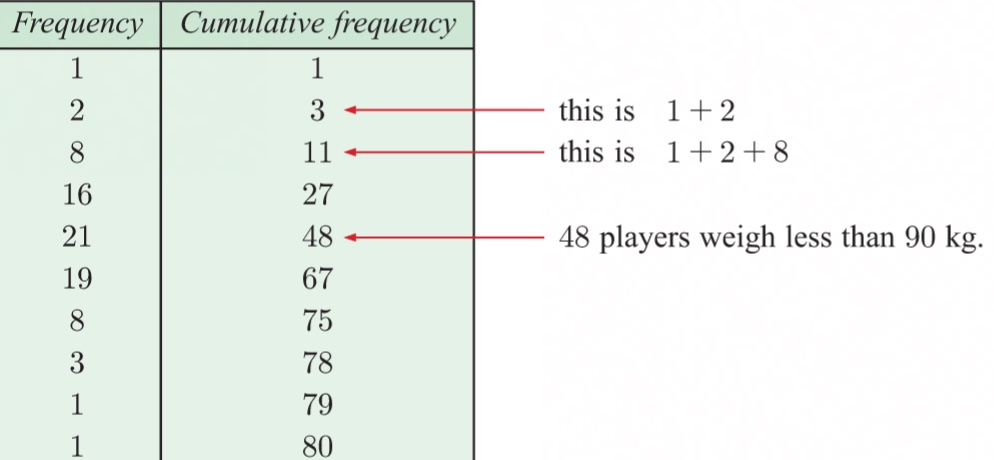
cumlative frequency
gives a running total of the scores up to a particular value, total frequency up to that value, nth percentile is the score value n% if the data lies at or below
comparing distributions of equal size
percentile = (cumulative frequency / number of data) x 100%
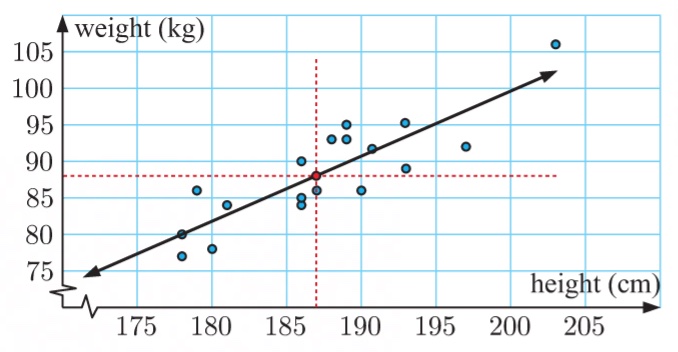
line of best fit by eye
1) find the mean of x and y
2) plot the mean point on the diagram
3) draw a line through the mean, have as many points below and above it

extrapolation + interpolation
interpolation - between the poles, it is reasonable to interpolate between the poles
extrapolation, outside the poles to estimate a point, is unreliable to extrapolate outside them
linear regression, line of best fit on calculator
lists & spreadsheet: enter x values into a + name it and put the y values into b and name the list
add calculator
6 stats
1 stat calcs
3 linear regression (mx+b)