PAA 4
1/14
There's no tags or description
Looks like no tags are added yet.
Name | Mastery | Learn | Test | Matching | Spaced | Call with Kai |
|---|
No analytics yet
Send a link to your students to track their progress
15 Terms
retinotopy
neighbour relationships in retina are retained in the cortical map
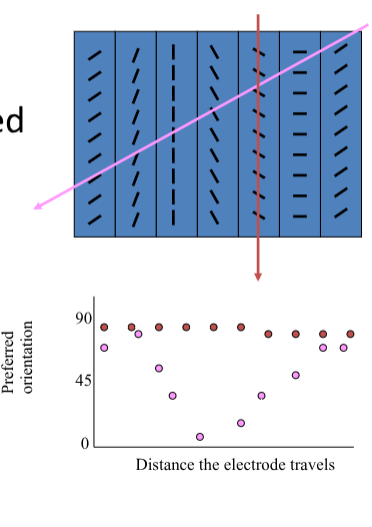
organisation of V1
Neurons all responding to the same type of orientation stacked on top of each other
-> orientation columns
All orientations covered within about 0.5mm
Ocular dominance bands
hypercolumn
a part of V1
neurons analyse the same part of visual space and respond to all different types of orientations (orientation column), and neurons that respond mainly to the right eye and mainly to the left eye
Essentially a processing device that extracts what orientations are present in visual space and what shape and size
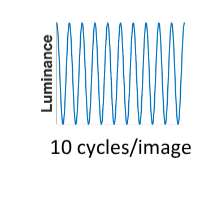
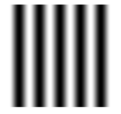
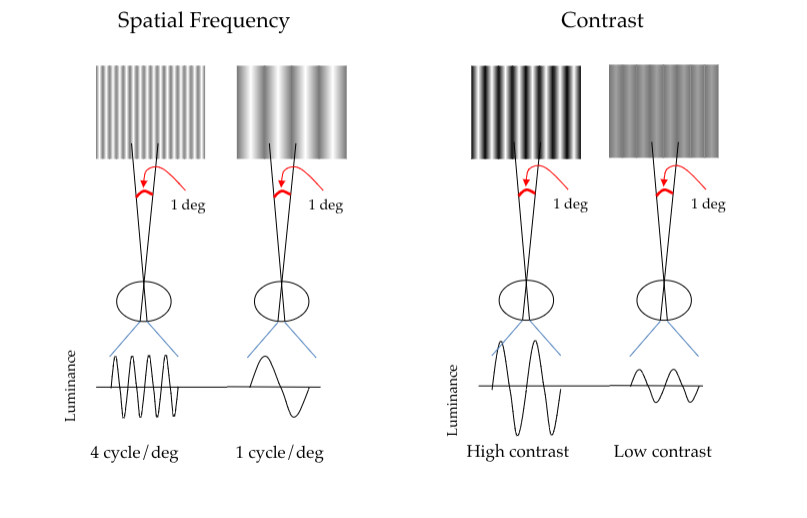
Sinewave or Sinusodial gratings – look at luminous profile
Different waves of luminsocity from black to white -> a smooth gradual change
Can manipulate orientation and width of bars (spatial frequency) - how often does the stimulus go from black –white-black again
Spatial frequency = 10 cycles/image e.g.
Contrast = changing the depth of the lines
Phase = starting with black, white or in between
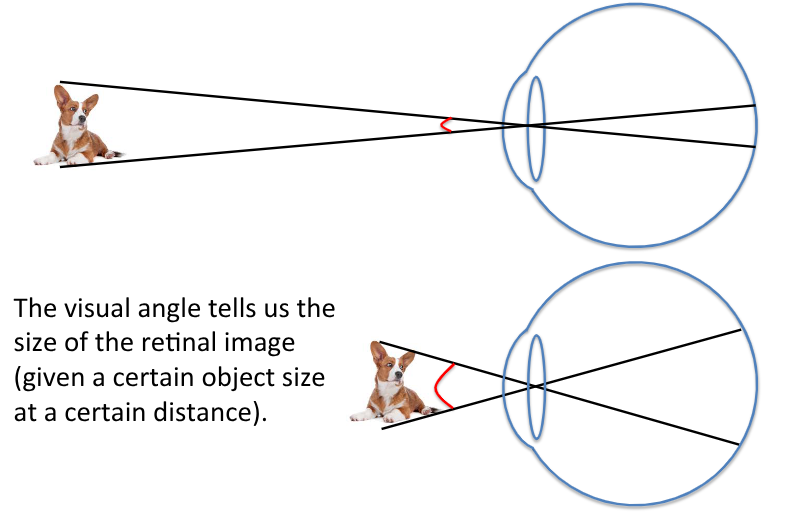
visual angle
The visual angle tells us the size of the retinal image (given a certain object size at a certain distance).
larger angle = larger visual image
comparing spatial frequency with contrast
Jean-Baptiste Joseph Fourier
• Every image can be broken down into sinewave components – Fourier analysis
-> by studying sinewave components can help us learn about how the visual system works
• The visual system conducts the equivalent of a local Fourier analysis
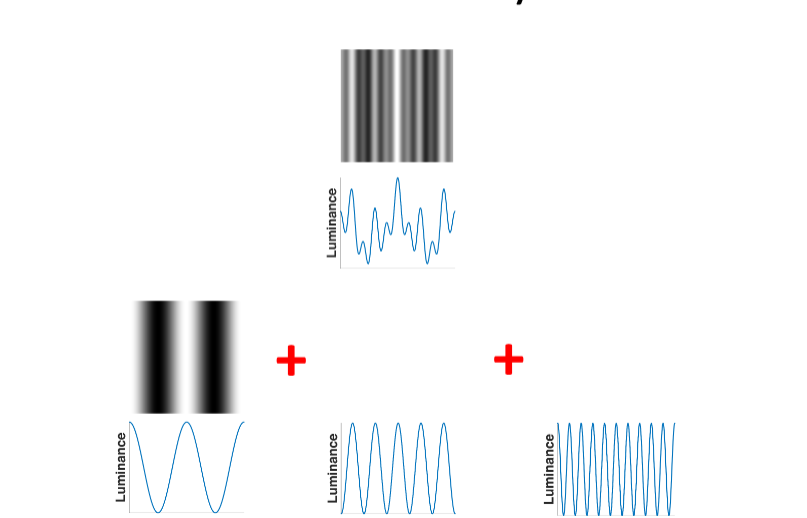
Fourier analysis
allows you to break down visual image into the sinewave gratings its composed of (and put it back together to create image again)
smallest units of the image
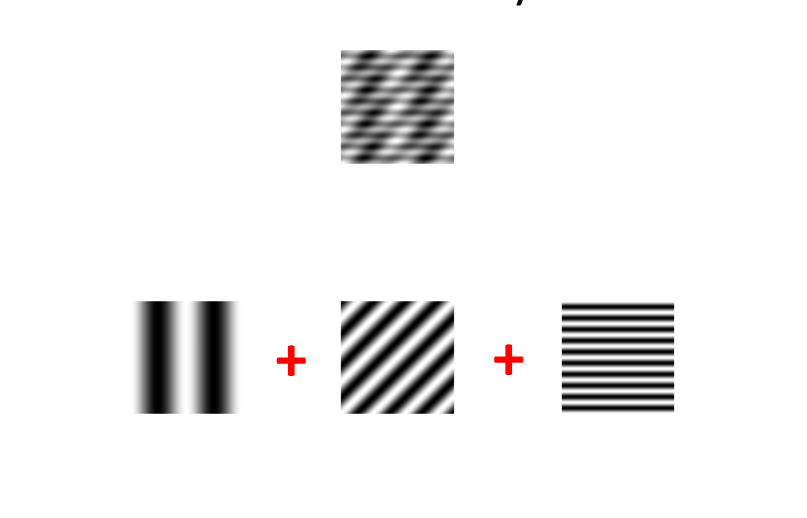
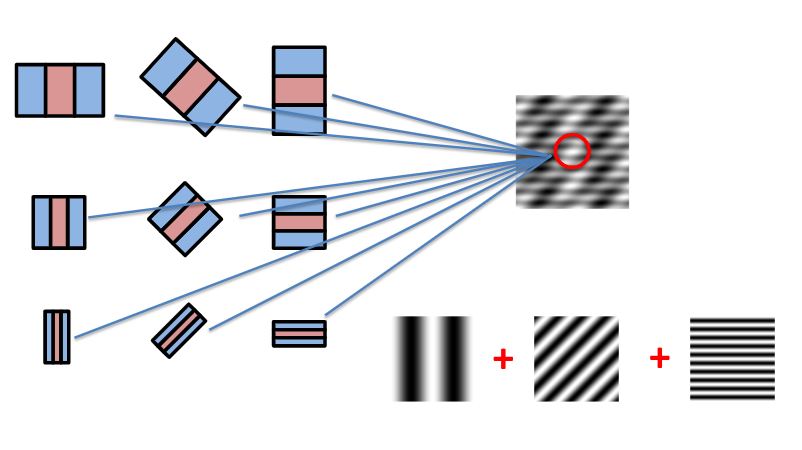
early vision as local Fourier analysis
Hypercolumns contain neurons tuned to different orientations and spatial frequencies
All of these neurons analyse the same patch of visual space
-> essentially conduct a local Fourier analysis of the visual space as together they extract spatial frequencies and orientations contained in their local patch
e.g. Top left neuron reacts, middle neuron reacts and bottom right neuron reacts to this patch of stimulus
adaption
• Both a method and a process in the visual system
• Method: Stare at the same stimulus for a long time
• Process: As a consequence of long exposure, those neurons that are tuned to the stimulus property decrease their sensitivity
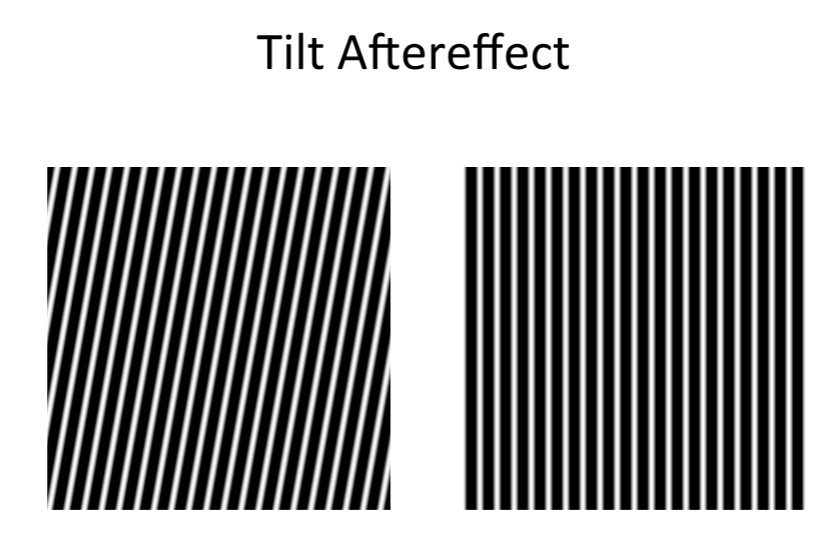
V1 receptive fields
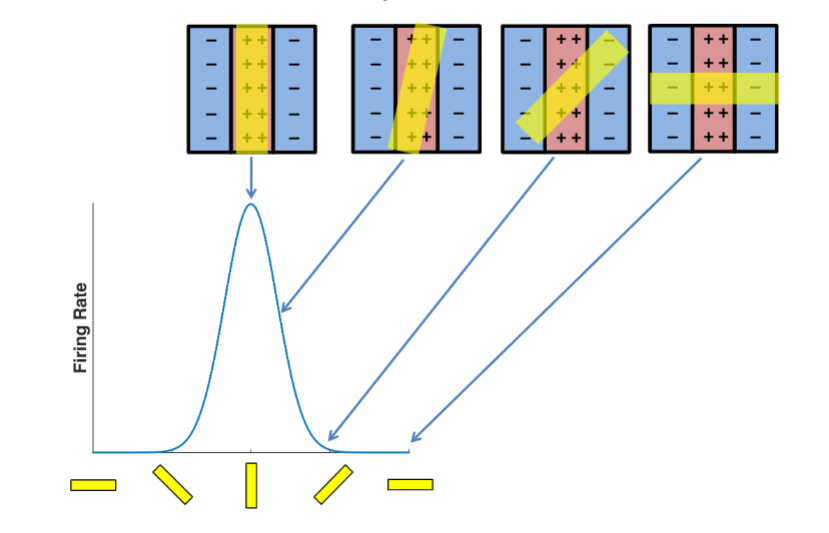
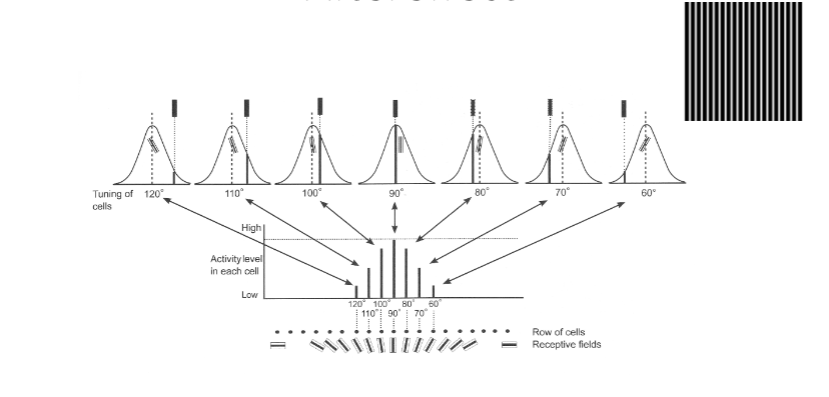
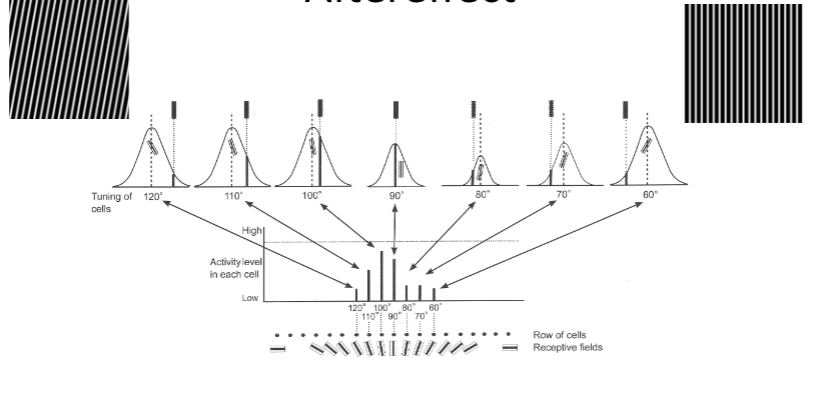
population code of tilt aftereffect
The more neuron responds, the more neuron fatigues
The neuron that best responds to vertical lines, is not the one that responds the most as fatigues
The lines around it has less adapted, so responds more, biases the orientations to the left when is in fact vertical
contrast sensitivity and spatial scale
whether you are equally sensitivie to different spatial scales
We are mostly sensitive to midrange spatial frequencies
Sensitivity of our visual system differs for different visual spatial scales
contrast sensitivity function (CSF)
like a window of visibility of spatial scales
peak sensitivity in the midrange
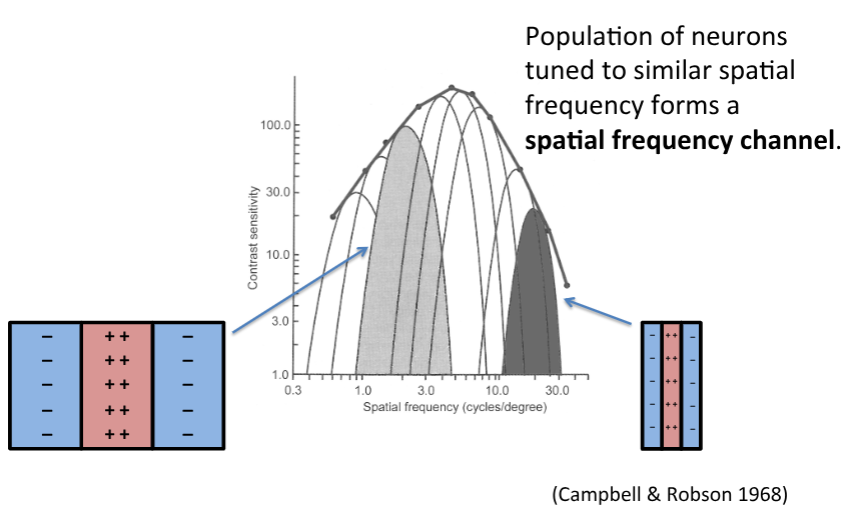
what produces the CSF?
populations of neurons tuned to similar spatial frequency forms a spatial frequency channel
these spatial frequency channels have different sensitivities
close by see as Albert Einstein - presented in high spatial frequency channels
the distinct channels of neurons that process different spatial frequencies
pasted together different frequencies of the two images
far away Marilyn Monroe - presented in low spatial frequency channels