statistics: 6.3 LINEAR REGRESSION IN JASP
1/10
There's no tags or description
Looks like no tags are added yet.
Name | Mastery | Learn | Test | Matching | Spaced | Call with Kai |
|---|
No analytics yet
Send a link to your students to track their progress
11 Terms
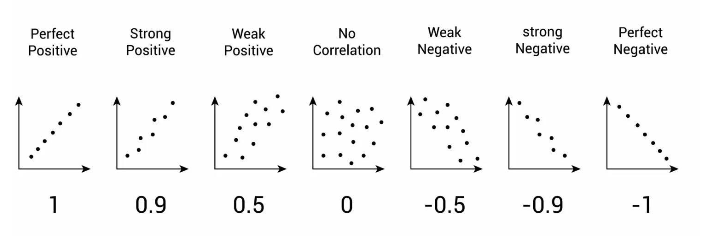
assumption checks for simple linear regression on jasp: linearity? 7 pts
through a scatterplot:
open the dataset on jasp
click on regression
click on classical-correlation
select BMI then variables
select PA then variables
click on scatterplots
see the results on the right side and check for a correlation
assumption checks for simple linear regression on jasp: outliers? 7 pts
through a scatterplot:
open the data set on jasp
click on regression
click on classical correlation
click on BMI then variables
click on PA then variables
click on scatterplots
check the results on the right side and find any outliers using the max and min standardized residual statistics
what are standardized residual statistics? 2 pts
it is a measure of the strength of the differences between observed and expected results that can be interpreted like z-scores; the min and max residuals should not exceed -3.0 to +3.0 and if they do then there are outliers
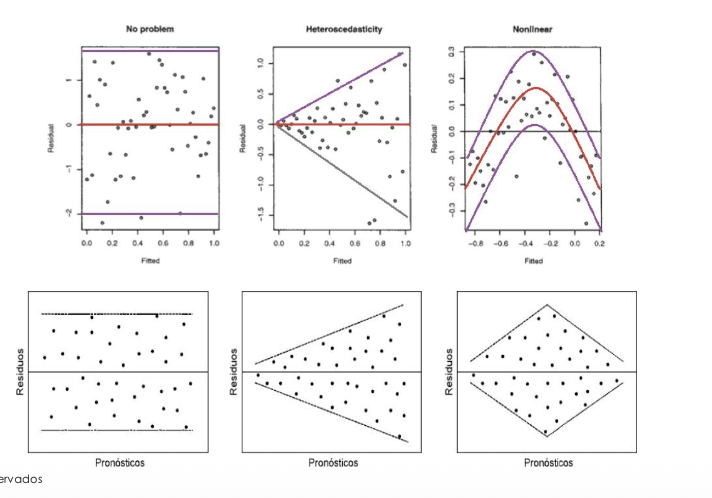
assumption checks for simple linear regression on jasp: homoscedasticity?
through a scatterplot that represents the level in the DV and the size of the residual:
open the data set on jasp
click on regression
click on linear regression
select BMI then dependent variable
select PA then covariate
click on plots
select residual vs predicted
check the results on the right side and see if the data points are approx symmetrical around the line of best fit
assumption checks for simple linear regression on jasp: normality of residuals? 8 pts
through histograms and Q-Q plots:
open the data set on jasp
click on regression
click on linear regression
select BMI then dependent variable
select PA then covariate
click on plots
select residuals histogram, standardized residuals, and Q-Q plot standardized residuals
check if it looks like a normal distribution
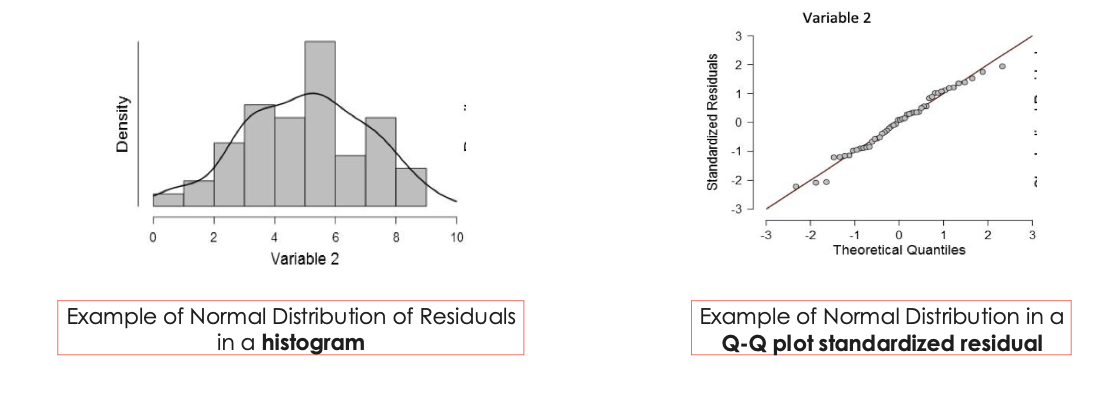
what is Q-Q plot? 1 pt
a plot that shows the quantiles of the residuals against those expected for a normal distribution
how to interpret a Q-Q plot? 3 pts
if the residuals are normally distributed the points will be close to the diagonal line
if the points concentrate above or below the line there is a problem with kurtosis
if the points snal around the line then there is a problem with skewness
assumption checks for simple linear regression on jasp: multicollinearity? 9 pts
through a collinearity diagnostic:
open the data set on jasp
click on regression
click on linear regression
select BMI then dependent variable
select PA then covariates
select variable 3 then covariates
click on statistics
select collinearity diagnostics
check teh results on the right side and see if tolerance is above 0.1 and if VIF is below 10
what is tolerance? 5 pts
it indicates the amount of variance of each IV that is shared with the rest of the IVs
tolerance = 1→ perfect non-collinearity (IV shares no variance with other IVs)
tolerance </= 0.1→ problems of collinearity (IV shares </= 90% variance with other IVs)
tolerance = 0→ perfect collinearity (IV shares all variance with other IVs)
tolerance > 0.1 is considered okay
what is VIF? 3 pts
VIF- variance inflation factor
VIF < 10→ low collinearity : non-problematic (IV shares no variance with other IVs)
2. VIF > 10→ high collinearity : problematic estimation of the regression coefficient (IV shares </= 90% variance with other IVs)
how to report assumption checks? 3 pts
assumption of linearity- a scatterplot that shows the relations beyween IV and DV was positive/negative and linear
assumptionof no outliers- an analysis of standard residuals showed that the data contained no outliers
assumptions of normality of errors and homoscedasticity- residual plots showed homoscedasticity and normality of the residuals