OM Week 10
1/27
There's no tags or description
Looks like no tags are added yet.
Name | Mastery | Learn | Test | Matching | Spaced | Call with Kai |
|---|
No analytics yet
Send a link to your students to track their progress
28 Terms
Crash Limit
The maximum number of days you can shorten it
Each extra day of speedup has a
Cost per day
Crashing
Spending extra to shorten an activity
Overtime crews, rush fees, expedited delivery, temporary staff
4 Steps of The Crashing Decision
Filter to critical path activities only: Only these determine the project duration. Crashing anything else just adds slack that nobody needs
Filter to activities with remaining crash capacity: If an activity is already at its minimum duration, skip it
Among what is left, pick the cheapest per day: You are buying time → buy it at the lowest price
Recompute all path lengths: The critical path may have changed → go back to step 1
2 Main Components of The Variable World
Uneven arrivals
Uneven Processing Times
Average Capacity > Average Demand is necessary for stability but variability
Can still create queues
Queues form because capacity supply and demand arrivals
Do not line up perfectly in time
Variability creates [BLANK 1] mismatches
High Utilization makes those mismatches [BLANK 2]
Temporary
Painful
Basic Process Analysis says
“No Waiting”
Demand Rate Formula
1/a
a is min/email
Process Capacity Formula
m/p
each employee does 1/p per min; m employees in parallel
Flow Rate Formula
min(1/a, m/p)
Limited by the tighter constraint
When does the model predict no waiting?
What is a flaw of this prediction?
When Capacity > Demand
Ignores how much arrivals and service times bounce around averages
What do the following stand for:
Iq
I
Ip
Average Inventory in queue
Average Inventory in system
Average Inventory in processing
What are the 5 assumptions of queueing formulas?
No balking or abandoning
Single waiting line with ample space
m >= 1 servers
Random but stable arrival and processing patterns
Must have u < 1
What are the three supporting formulas or the queueing formulas?
u = p/am
CVa = oa/a
CVp = op/p
Approximate Waiting-Time Formula
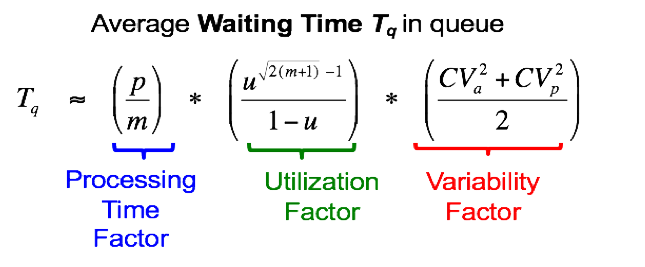
What does each component of the waiting time formula stand for?
p/m = processing time factor
u(SQRT(2(m+1))) - 1/1 - u = utilization factor
CVa² + CVp² /2 = variability factor
Waiting gets worse when (3 points)
Jobs take longer
Servers are busier
Arrivals/Service are more variable
What do the coefficients of variation tell us (3 points)?
Arrivals are very vary variable
processing times are variable but less so
Demand-side randomness is the bigger issue here
Variability mainly creates
Waiting inventory
What stays the same when we move from Basic Process Analysis (No Randomness) to adding Variability (3 points)?
Average processing time
Average flow rate
Average number being actively worked on
What changes when we move from Basic Process Analysis (No Randomness) to adding Variability (3 points)?
Waiting time
Queue length
Total Flow Time
Adding labor units reduces waiting but raises
Direct Labor cost per unit of output
Core economic tradeoff
In variable systems, the first bit of extra capacity is often the [BLANK] variable
Most/Least
Most
variability creates waiting lines by
Causing temporary mismatches between demand and capacity
The approximate queueing formula says waits rise with (3 points)
Processing time
Utilization
Variability