7.2 Indifference Curves & Budget Lines
1/33
There's no tags or description
Looks like no tags are added yet.
Name | Mastery | Learn | Test | Matching | Spaced | Call with Kai |
|---|
No analytics yet
Send a link to your students to track their progress
34 Terms
What is an Indifference Curve (IC)
A curve showing all combinations of two goods that give a consumer the same level of satisfaction/ utility.
They represent consumer preferences.
What does indifferent mean
The consumer has no preference between any combinations of goods on the same indifference curve.
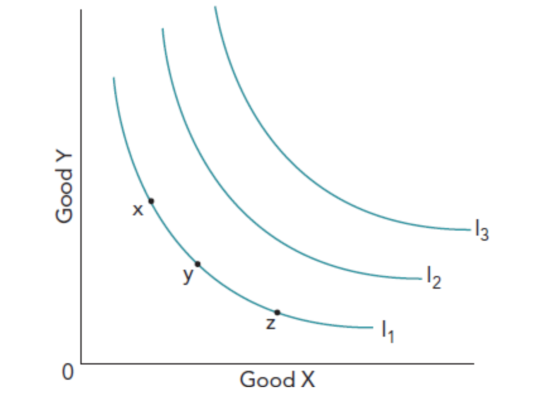
Draw an example of an indifference curve and what does it show
Shows three examples of indifference curves out of the many that can apply to a particular consumer.
The consumer in indifference curve I1 is indifferent with respect to the combinations x, y or z since each are on the same indifference curve.
Moving from I1 to I2 to I3 represents an increase in consumer levels of satisfaction
What are the 4 properties of indifference curves
Downward Sloping Indifference Curve
An indifference curve slopes downward because to gain more of one good, a consumer must give up some of the other.Concave Indifference Curve
Indifference curves are concave to the origin due to a diminishing marginal rate of substitution.Non-Intersecting Indifference Curves
Indifference curves cannot intersect (cannot be transitive) because this would imply inconsistent consumer preferences and consumer irrationality.Higher Indifference Curve means higher satisfaction
An indifference curve further from the origin represents a higher level of satisfaction (highest total utility). - so if rational, consumers will always opt for the highest indifference curve.
Along every indifference curve, what is constant
Total utility
What is the Marginal Rate of Substitution (MRS)
The rate at which a consumer is willing to give up one good to gain one more unit of another good while maintaining the same level of satisfaction.
The MRS is the slope of the IC.
What is the Diminishing Marginal Rate of Substitution
As a consumer consumes more of one good, they are willing to give up less of the other good for each additional unit.
MRS diminishes as consumption increases.
What is the slope of an Indifference Curve
The slope of an indifference curve represents the marginal rate of substitution.
What is a Budget Line (BL)
A line showing all combinations of two goods that a consumer can afford given their income and prices. (opportunity cost & purchasing power)
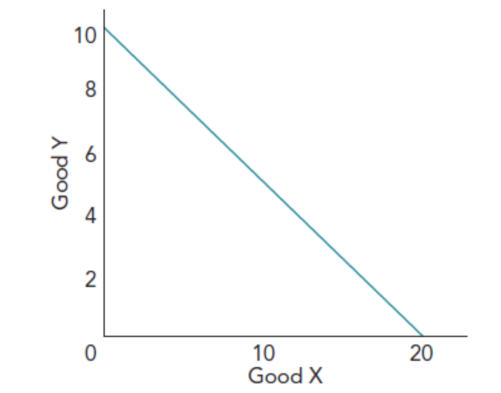
Budget Line Equation
PxX + PyY = Income
What is the slope of the Budget Line equal to
The slope of the budget line is equal to –Px / Py.
What one thing do budget curves and indifference curves each represent
Budget curve = opportunity cost
Indifference curve = trade-off
What is Consumer Equilibrium
Consumer equilibrium occurs where an indifference curve is tangent to the budget line.
- At equilibrium, the marginal rate of substitution equals the ratio of the prices of the two goods.
- It is the optimal consumption point, given preferences, current prices, current relative prices and budget.
What causes the budget line to shift
Changes in income or price
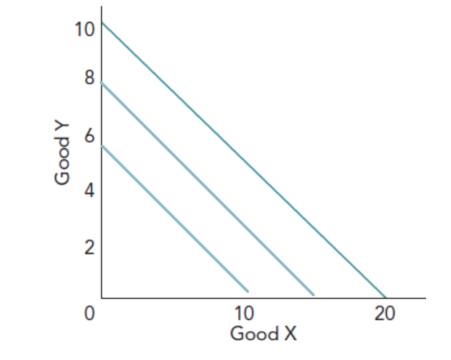
How does a change in income affect the budget line
An increase in income shifts the budget line outward in a parallel way, while a decrease shifts it inward. (Prices unchanged, slope stays the same.)
• Income ↑ → budget line shifts outwards (parallel)
• Income ↓ → budget line shifts inwards
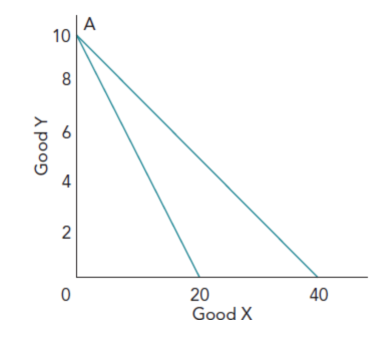
How does a change in Price of a Good affect the budget line
A change in the price of one good causes the budget line to rotate about the axis of the other good.
• Price of X ↓ → budget line rotates outwards
• Price of X ↑ → budget line rotates inwards
For example: If the price of good X falls, the budget line will move outwards.
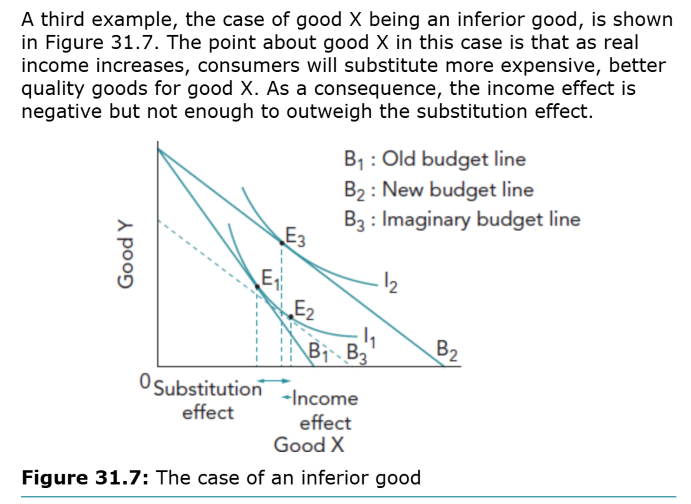
What is Substitution Effect and it's effects (is it always negative or positive)
The change in consumption resulting from a change in the relative price of a good, holding real income constant.
- Where, following a price change, a consumer will substitute the cheaper good for the one that is relatively more expensive.
- The substitution effect always causes consumers to buy more of the relatively cheaper good, hence is always positive.
What is the Income Effect and what does it depend on
The change in consumption resulting from a change in real income following a price change.
Where, following a price change of a good, a consumer has higher real income and will purchase more of this good.
Depends on whether the good is:
• Normal
• Inferior
• Giffen
What is the Price Effect
The total change in quantity demanded resulting from a change in price.

What is a Normal Good and it's price effect
A good for which demand increases when income increases.
For a normal good, both the income effect and substitution effect reinforce each other.
• Income ↑ → consumption ↑
• Substitution effect: positive
• Income effect: positive
• Price effect: negative relationship between price and quantity
📌 Downward-sloping demand curve
What is an Inferior Good and it's price effect
A good for which demand decreases when income increases.
For an inferior good, the income effect is negative but smaller than the substitution effect.
• Income ↑ → consumption ↓
• Substitution effect: positive
• Income effect: negative (but smaller)
📌 Demand still slopes downward.
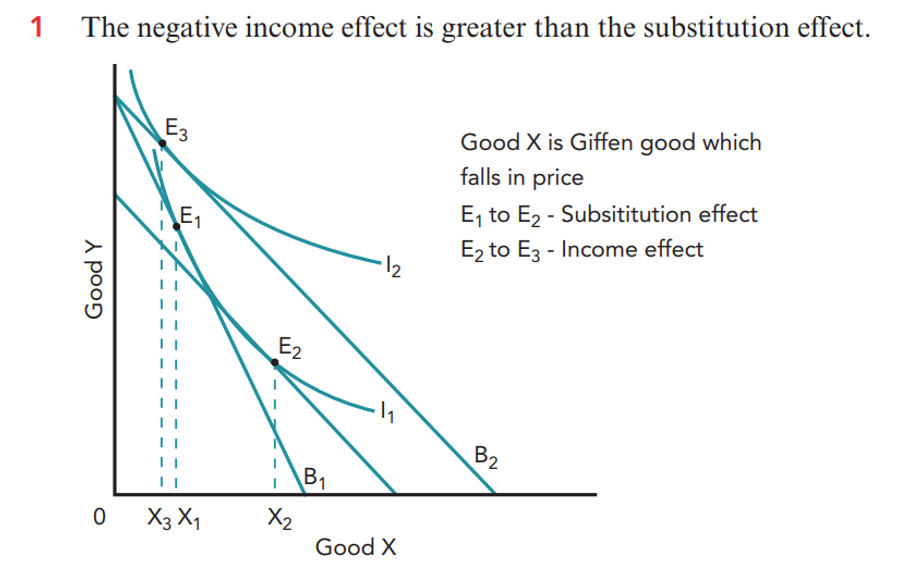
What is a Giffen Good and it's price effect
A strongly inferior good for which the income effect outweighs the substitution effect, causing an upward-sloping demand curve.
• Strongly inferior good
• Income effect > substitution effect
• Price ↑ → quantity demanded ↑
📌 Upward-sloping demand curve because a rise in price leads to an increase in quantity demanded.
How to draw the price change diagram (EXAM METHOD - 6)
Draw initial budget line
2. Draw initial IC tangent
3. Rotate BL after price change
4. Draw new IC tangent
5. Draw hypothetical BL parallel to new BL (to isolate SE)
6. Label:
• Substitution effect
• Income effect
• Price effect
📌 Missing labels = lost marks.
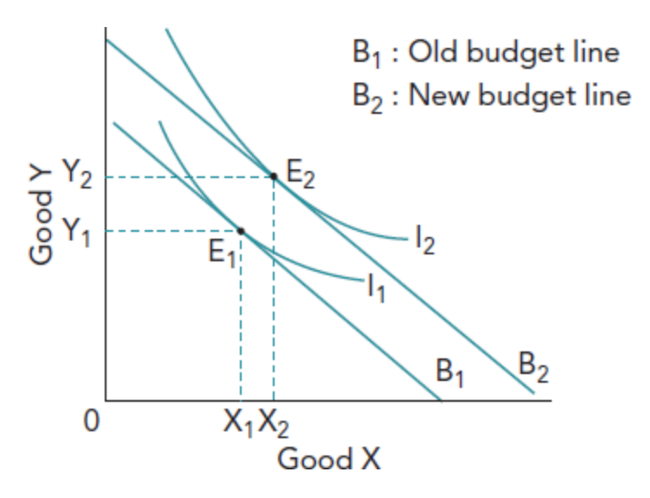
Explain the effect of an increase in income on consumption of goods X and Y on a budget line indifference curve diagram
Shift all outwards
E1 will give the consumer the maximum combined consumption of goods X and Y given the budget constraint shown by budget line B1.
If income increases, then this will allow the consumer to choose a better combination of each good.
So if the budget constraint rises to B2, then the consumer will increase consumption of good Y and also of good X(although to a lesser extent)
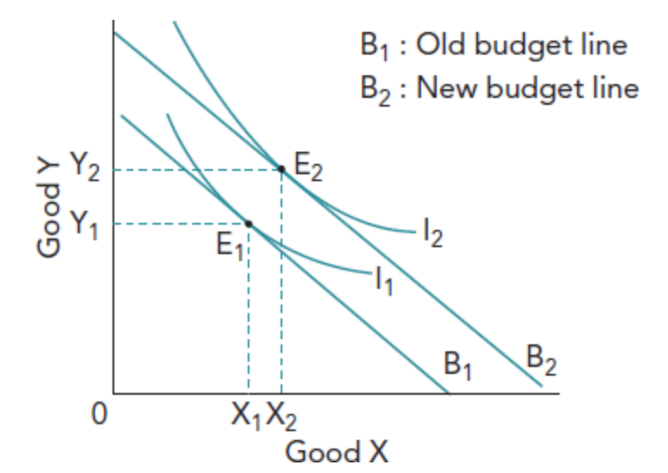
Where is consumer choice optimal(With diagram)
Where the budget line touches, or is at tangent to, the highest indifference curve.
So E2 is the optimal position.
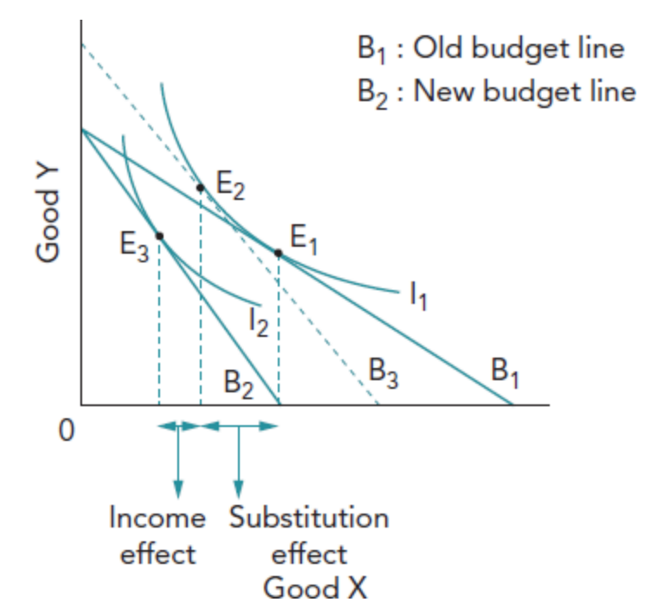
Explain the income and substitution effects of an INCREASE in price of good X on a budget line - indifference curve diagram (Use chain of reasoning for the 2 stages) (HINT: 3 BL, 2 IC, 3 E)
If the price of good X increases (and good Y remains unchanged), this means consumers have less spending power, represented by a new budget line B2.
The change occurs in two stages:
1. A movement along I1 to point E2. This is the substitution effect as the consumer buys less of good X as it is now relatively more expensive than good Y
2. A shift downwards to a lower indifference curve I2 moving from E2 to E3. This is the income effect as the consumer has less spending power due to the increase in price of good X. The income effect is negative, resulting in a decrease in consumption of both goods.
B3 shows the imaginary budget line which is parallel to the new budget line but at a tangent to the original indifference, in order to show the substitution and income effect separately.
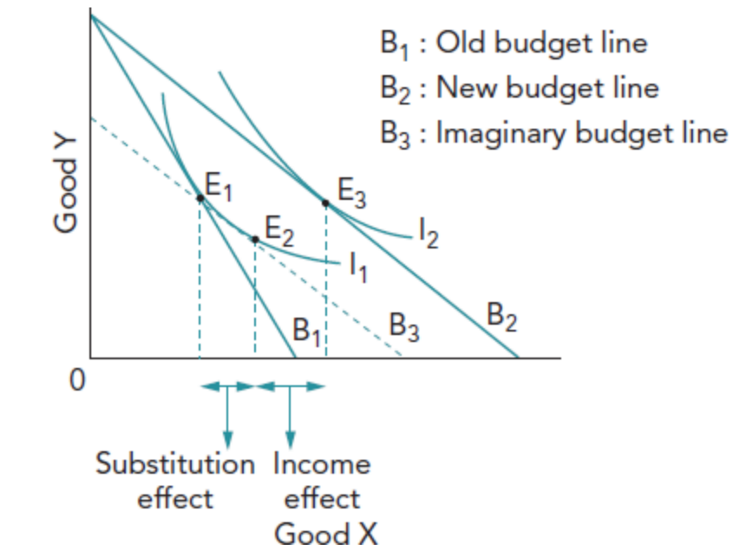
Explain the income and substitution effects of a DECREASE in price of good X on a budget line - indifference curve diagram (Use chain of reasoning)
A fall in the price of Good X is equivalent to a rise in real income, hence the budget line pivots from B1 to B2.
The substitution effect is the move from E1 TO E2 where more of Good X is being consumed.
The income effect is positive and involves the move from E2 to E3 as the consumer reaches a higher indifference curve through a further increase in consumption of good X.
Explain the income and substitution effects of a increase in real income on a budget line - indifference curve diagram in the case of an inferior good
Explain the income and substitution effects of a decrease in price of good X on a budget line - indifference curve diagram in the case of a giffen good with an example
With a giffen good, demand falls as price falls and demand rises as price rises.
For example low-income families, a staple such as rice or bread, as the price of the staple food increases, consumption will increase since real income has fallen (so cannot afford other goods - must consume more staple).
Demand curve is upward sloping as income effect is negative and greater than the substitution effect.
Tips for indifference curves:
Key concept link between the margin and decision making:
What are the 5 limitations of indifference curve analysis
Rational Behaviour Assumption - assumes consumers behave rationally, which may not reflect real behaviour - people regularly choose sub-optimal outcomes
Stable Preferences - The model assumes consumer preferences are stable and consistent over time which is unrealistic.
Two-Good Model - only considers two goods, which oversimplifies consumer choice as in reality thee is way more than two options.
Ignores psychological and social influences which further oversimplifies.
Difficulty of Empirical Testing - Preferences and indifference curves cannot be directly observed or measured.
Overall Evaluation of Indifference Curve Analysis
Indifference curve analysis is more realistic than marginal utility theory but still relies on simplifying assumptions.
SUMMARY of indifference curves topic (memorise)
• ICs show equal satisfaction
• BL shows affordability
• Equilibrium at tangency
• Price effect = substitution + income effect
• Normal vs inferior vs Giffen
• Model is useful but unrealistic