PSYCH 492: Final
1/132
There's no tags or description
Looks like no tags are added yet.
Name | Mastery | Learn | Test | Matching | Spaced | Call with Kai |
|---|
No analytics yet
Send a link to your students to track their progress
133 Terms
How does test reliability influence the interpretation of an individual’s test score?
Test reliability tells us how much error is in an individual’s score. We use it to calculate the Standard Error of Measurement (SEM), which estimates the amount of measurement error.
Then, we use SEM to create a confidence interval around the observed score, giving a range where the true score likely falls.
What is Standard Error of Measurement?
SEM is the standard deviation of the errors in measurement
SEM gives us an indication of the amount of variability in an individual’s test score that is due to measurement error (in the test)
Why is test reliability important in real-world decision making?
Test reliability directly affects how we interpret an individual’s observed score.
Low reliability = more measurement error → less confidence in scores
High reliability = more precise and trustworthy scores
Because of this, tests used to make decisions about people (e.g., hiring, admissions) should have reliability ≥ .90 to ensure accuracy and fairness.
True or false: a measure can't be valid if it is not reliable
True.
Conceptually we need reliability to show validity
How does reliability influence correlations and validity?
Reliability limits correlations and validity.
Low reliability (high error) → weaker correlations
A measure cannot correlate well with others if it is unreliable
Therefore, validity is limited by reliability
Conceptually:
A test cannot be valid if it is not reliable
When do we use the maximum observed correlation formula?
We use this formula to determine the highest possible correlation between two measures, given their reliabilities.
It shows the upper limit of the observed correlation
Helps explain why correlations may be lower than expected
Used to assess whether a low correlation is due to low reliability
What is the correction for attenuation formula and when is it used?
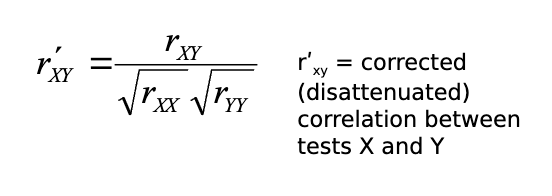
The correction for attenuation formula estimates what the correlation would be if both variables were perfectly reliable (no measurement error). It reveals the true/latent relationship between the variables.
How does reliability influence results of multiple regression?
Reliability affects regression because it limits correlations between variables.
Low reliability → weaker correlations
Weaker correlations → predictors may appear non-significant
Results can be misleading due to measurement error
Why might a predictor appear non-significant in regression?
Because of low reliability.
High measurement error reduces correlations
This can make a real relationship appear insignificant
Why do we report reliability (rₓₓ) in correlation/regression tables?
To show the quality of the measures.
Helps interpret results correctly
Low reliability may explain weak or null findings
What is the risk of low reliability in regression analysis?
It can lead to incorrect conclusions (e.g., thinking a predictor doesn’t matter when it actually does)
How does reliability influence composite scores and how does reliability increase?
Composite scores are usually more reliable than individual tests.
Reliability increases when:
There are more tests
Tests are reliable
Tests are highly correlated
What is the reliability of a composite score? (Formula)
Number of tests (k)
Average reliability of tests
Average correlation among tests
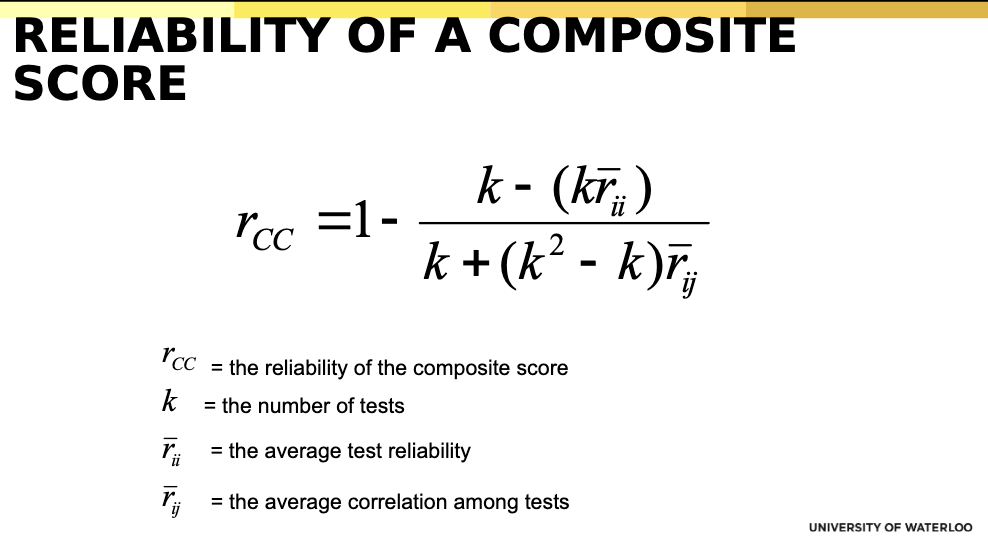
Why do correlated tests increase composite reliability ?
Because they measure the same underlying construct, making the combined score more consistent.
What happens if tests in a composite are not correlated?
Composite reliability decreases because the tests are measuring different things.
Can highly reliable tests still produce a weaker composite?
Yes, if the tests are not correlated, the composite reliability is lower.
What are the two common situations for reliability of observed behaviour?
Judge’s ratings (continuous data)
Coding behaviour (nominal data)
A teacher rates a student’s participation on a scale from 1–5 (judge’s rating), while another observer records whether the student spoke in class (yes/no) (coding behaviour).
How do we assess reliability of coded behaviour?
Use Cohen’s Kappa, which measures agreement beyond chance.
What is the key difference between alpha and kappa?
Alpha → continuous ratings (agreement in degree)
Kappa → categorical coding (agreement beyond chance)
What does reliability of observed behaviour measure?
The consistency/agreement between raters or coders
What is the average inter-item correlation in judge ratings?
The average correlation between all raters.
Ex: Three judges rate the same people. If Judge A and B correlate at .80, A and C at .70, and B and C at .75, the average inter-item correlation is about .75 — meaning the judges generally agree in their ratings.
What formula is used to calculate reliability of judge ratings?
Cronbach’s alpha
Treat raters as items and use Cronbach’s alpha to assess consistency
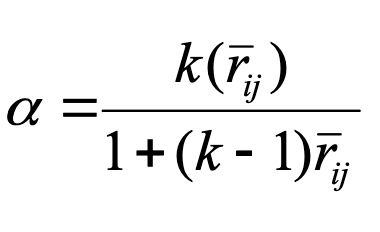
What does α = .81 mean in judge ratings?
There is good agreement between raters, meaning ratings are reliable.
How do we assess reliability when coding behaviour (nominal data) and why can’t we just use percentage agreement?
Use Cohen’s Kappa, which measures agreement beyond chance.
We can’t rely on percent agreement because some agreement occurs by chance, which overestimates reliability.
What does Cohen’s Kappa measure?
The proportion of agreement between raters after removing chance agreement.
Example: Two teachers rate whether students are “on-task” or “off-task.” They agree 80% of the time, but 50% agreement could happen by chance—so Cohen’s Kappa measures the agreement beyond that chance portion.
What do the diagonal cells in a coding table represent?
Instances where both raters agreed on the same category.
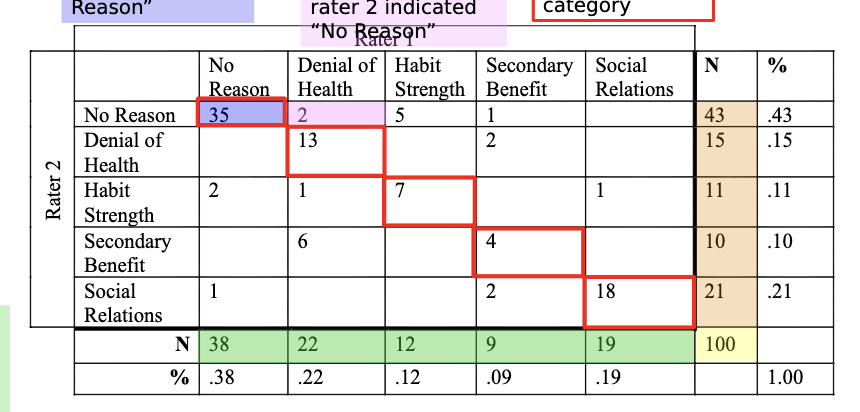
What are the two components needed to calculate Kappa?
Observed agreement (P)
Chance agreement (Pc)
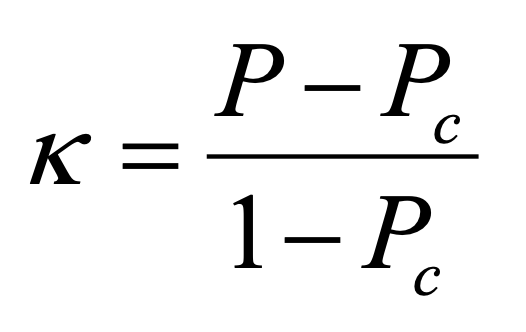
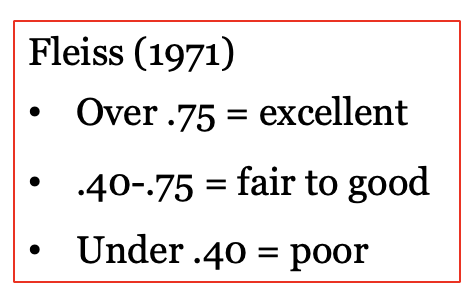
How do we interpret Kappa values?
How do you calculate chance agreement (Pc) in Cohen’s Kappa?
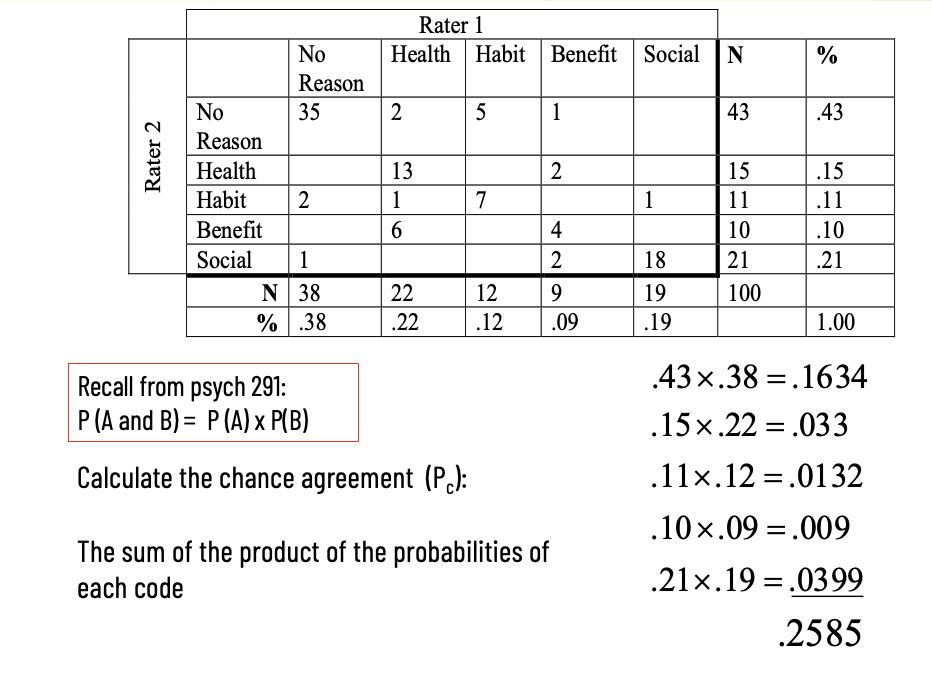
The probabilities come from when calculating Pc from the marginal totals (row % and column % for each category).
What does chance agreement (Pc) represent?
The proportion of agreement expected by chance alone.
Why do we calculate Pc in Kappa?
To remove agreement due to chance and get a more accurate measure of reliability.
Why can high percentage agreement be misleading?
Because some agreement occurs by chance.
If chance agreement is high, the true reliability may actually be low.
How can coding data help improve reliability?
By identifying where raters disagree, allowing researchers to refine categories and coding rules.
What is item difficulty?
Proportion of respondents with correct response
Most relevant for intelligence tests
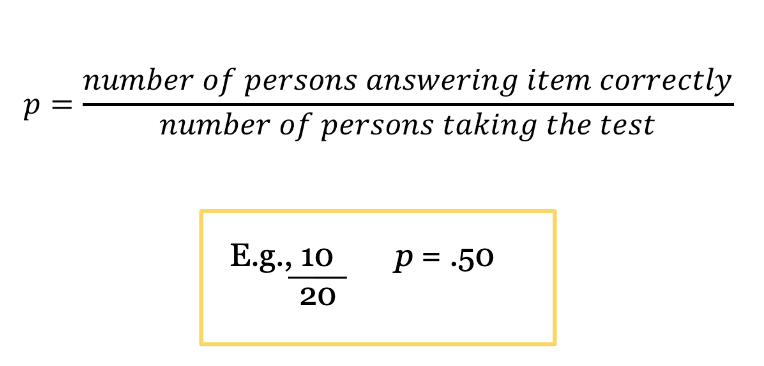
What does p = .20 and p = .80 mean?
20% of respondents answered correctly → the item is difficult.
80% of respondents answered correctly → the item is easy.
What is the range of item difficulty (p), and is item difficulty (p) the same as a p-value?
0 to 1
No, item difficulty is a proportion, not a significance test.
What is the optimal item difficulty?
Approximately p = .50 (range ≈ .30–.70), where item discrimination and variance are maximized.
Why is p = .50 optimal?
Because it maximizes variability and allows the item to best distinguish between high and low ability individuals.
What happens if an item is too easy or too difficult?
It reduces variability and discrimination because most people get the same answer.
How does item difficulty affect discrimination?
Moderate difficulty (p ≈ .50) leads to maximum discrimination across ability levels.
What are the two qualifiers of optimal item difficulty?
Guessing – inflates item difficulty, so p must be adjusted
Purpose of the test – optimal difficulty depends on whether you want to detect low or high ability
How does guessing affect item difficulty?
When guessing is possible, item difficulty (p) is artificially inflated.
Some correct answers come from chance
Therefore, p must be adjusted upward based on number of answer choices
👉 More options = less guessing effect
👉 Fewer options = more guessing effect
How do answer choices affect guessing and item difficulty?
More answer choices → lower probability of guessing correctly
Fewer choices → higher probability of guessing correctly
👉 This increases the observed item difficulty (p)
How does the purpose of a test affect item difficulty?
To detect low ability → use easy items (high p ≈ .80)
To detect high ability → use difficult items (low p ≈ .20)
What is distractor analysis in multiple-choice questions?
It evaluates whether incorrect answer choices attract students who answer the item incorrectly.
How do you evaluate whether distractors are effective?
Compare actual selections to expected (even distribution).
Good distractor → chosen by some students
Bad distractor → rarely chosen
When is item variability maximized?
When the mean endorsement is near the midpoint of the scale, and responses are well spread (high SD).
Simplified:
When answers are spread out and not all the same (around the middle of the scale).
Example:
On a 1–7 scale, if people give answers from 2 to 6 (not all 1s or all 7s), variability is high.
What are mean endorsement and item variability?
Mean endorsement = average response to an item (level of agreement)
Item variability = how spread out responses are (measured by SD)
When is item variability maximized?
When mean item endorsement is around the midpoint of scale
What are floor and ceiling effects?
Floor effect → responses cluster at the low end
Example: Mean = 1.6, SD = .60
Ceiling effect → responses cluster at the high end
Example: Mean = 6.0, SD = .40
👉 Both indicate low variability and poor discrimination
Why is a midpoint mean not enough to ensure good item variability?
Because responses may still be clustered, you must also check standard deviation (SD).
Why are low-variability items problematic?
They do not differentiate between individuals and contribute little to total test variance.
What is the item discrimination index (D)?
It measures how well an item distinguishes between high and low scorers.
High D → good item (high scorers correct, low scorers incorrect)
Low or negative D → poor item
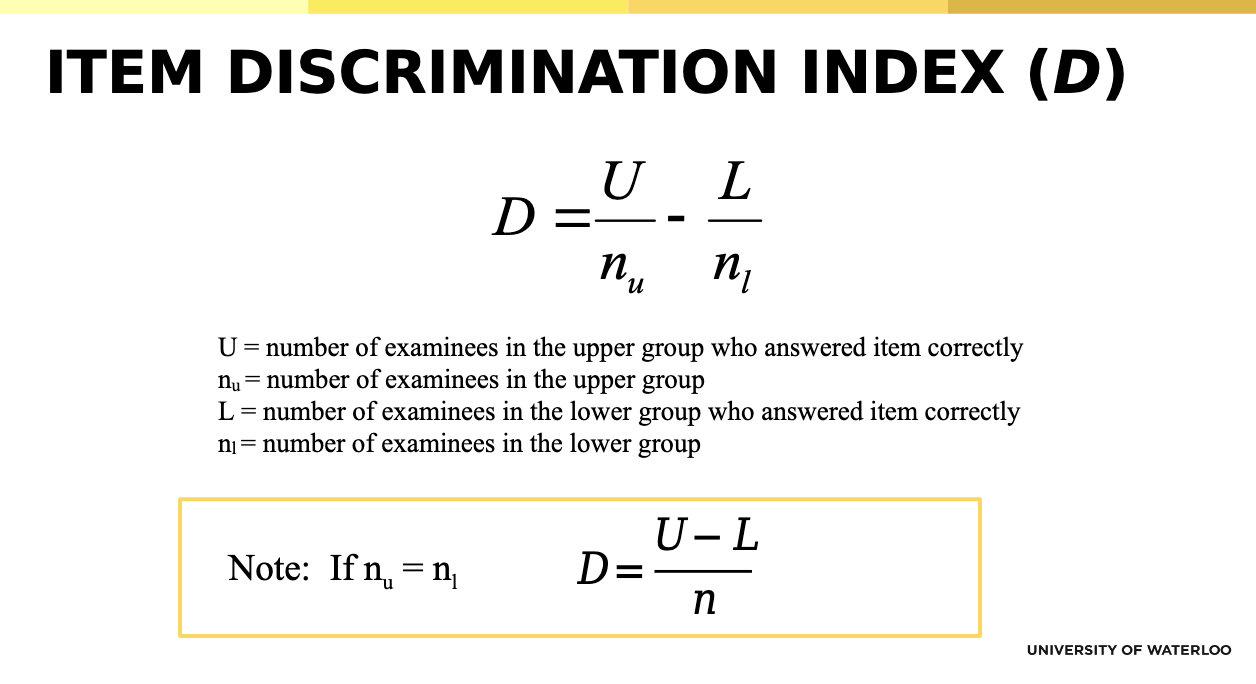
How do you interpret values of the item discrimination index (D)?
+1 → perfect discrimination (ideal item)
0 → no discrimination
-1 → negative discrimination (bad item; low scorers outperform high scorers)
How do item difficulty (p) and discrimination (D) relate?
Item difficulty limits discrimination
Maximum discrimination occurs when p ≈ .50
But p ≈ .50 does not guarantee good discrimination
What are Ebel’s guidelines for interpreting item discrimination (D)?
D ≥ .40 → optimal
.30–.39 → acceptable
.20–.29 → marginal
≤ .19 → poor
👉 D should always be positive
What is item-total/rest correlation (Rᵢₜ)?
The correlation between an item and the rest of the test.
👉 Indicates how well the item fits the overall scale
How do you interpret item-total correlation values?
High → good item (fits test)
Low or near 0 → poor item (does not measure same construct)the
How do inter-item correlations help evaluate test items?
They show how strongly items relate to each other.
👉 Items with low correlations with others likely do not measure the same construct and may need revision or removal.
What is content saturation in item analysis?
It refers to how well an item measures the intended construct.
👉 Good items correlate highly with the relevant scale and weakly with irrelevant scales.
How do you evaluate social desirability effects at the item level?
By correlating each item with:
the relevant scale (should be high)
a social desirability scale (should be low)
What does an item characteristic curve (ICC) show?
It shows the relationship between a person’s level of an attribute (ability) and their probability of answering an item correctly.
👉 As ability increases, probability of correct response increases
What is validity?
The extent to which a test measures the construct it is intended to measure.
How is validity different from reliability?
Reliability = consistency
Validity = accuracy (measuring the correct construct)
What are the main types of validity evidence?
Face validity
Content validity
Criterion-related validity
Construct validity
What is face validity?
The extent to which a test appears to measure what it is intended to measure.
What is the difference between high and low face validity?
High → items clearly reflect the construct
Low → items are indirect or unclear
Why is face validity useful but limited?
It improves acceptability and motivation but does not guarantee true validity.
What is content validity?
The extent to which a test adequately represents all aspects of the construct being measured.
How is content validity assessed?
Define the construct
Experts match items to the construct
Compare to see if items adequately cover it
What does low content validity indicate?
That the test does not fully represent the construct (important aspects are missing).
What is criterion-related validity?
The extent to which a test predicts or correlates with a real-world outcome (criterion).
What is the difference between concurrent and predictive validity?
Concurrent → measured at the same time
Predictive → measured at a later time
How is criterion-related validity assessed?
By calculating the correlation between test scores and criterion performance.
What does r2 represent in criterion validity?
The proportion of variance in the outcome explained by the test.
What determines whether criterion validity is predictive or concurrent?
The timing of when the criterion is measured (later vs same time), not the statistical method used.
Does using regression mean a study is predictive validity?
No. Regression can be used in both predictive and concurrent validity. Timing determines the type.
Are criterion validity coefficients typically very high?
No. They are often modest (e.g., .20–.30), especially in real-world settings.
What is restricted range?
A reduction in score variability because only a limited portion of the full range is observed.
How does restricted range affect correlations?
It lowers correlations, making relationships appear weaker than they actually are.
Why does restricted range occur in predictive validity studies?
Because only selected individuals (e.g., top applicants) are followed up, reducing variability.
What is construct validity?
The extent to which a test truly measures the theoretical construct it is intended to measure.
What is convergent validity?
Evidence that a test correlates highly with other measures of the same or related constructs.
What is discriminant validity?
Evidence that a test does not correlate strongly with unrelated constructs.
What is a nomological network?
A set of expected relationships between a construct and other variables used to evaluate construct validity.
How do researchers evaluate construct validity using a nomological network?
By examining whether the measure correlates with related constructs (convergent validity) and does not correlate with unrelated constructs (discriminant validity).
What magnitude of correlations is expected for convergent vs discriminant validity?
Convergent validity → high correlations
Discriminant validity → low (or non-significant) correlations
Why is relative difference more important than absolute magnitude in construct validity?
Because correlation sizes depend on the study; what matters is that correlations with related constructs are higher than with unrelated constructs.
What is incremental validity?
“The extra predictive value a measure adds beyond existing predictors.”
Example (to remember it):
SAT predicts GPA → adding a personality test improves prediction → that improvement = incremental validity.
Why is incremental validity important in research?
It ensures new measures contribute additional knowledge and helps prevent unnecessary construct proliferation.
What is the difference between criterion-related validity and test utility?
Criterion-related validity → how well a test predicts a criterion
Test utility → how useful the test is for making real-world decisions
What does test utility refer to?
The extent to which a test improves the accuracy of decisions (e.g., hiring or selection).
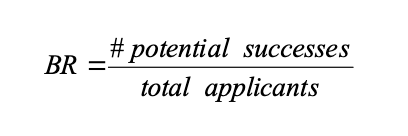
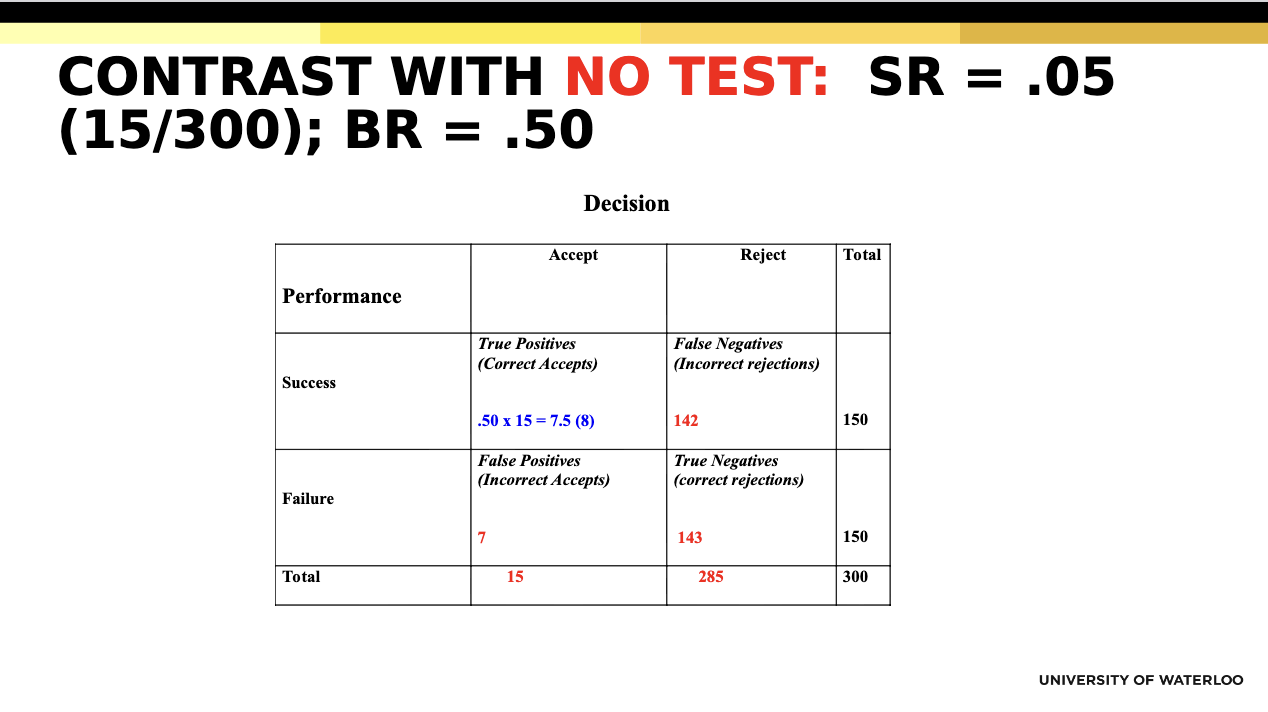
What is the base rate (BR)?
The proportion of people in the population who would succeed on the criterion.
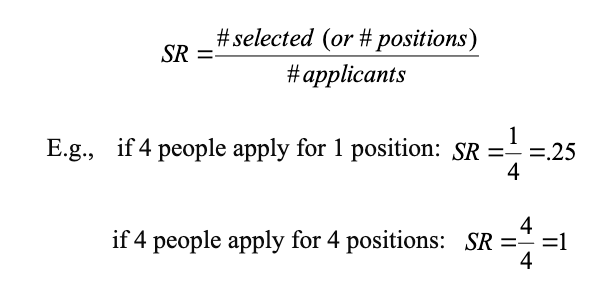
What is Selection Ratio (SR)
Proportion of applicants selected relative to those applying
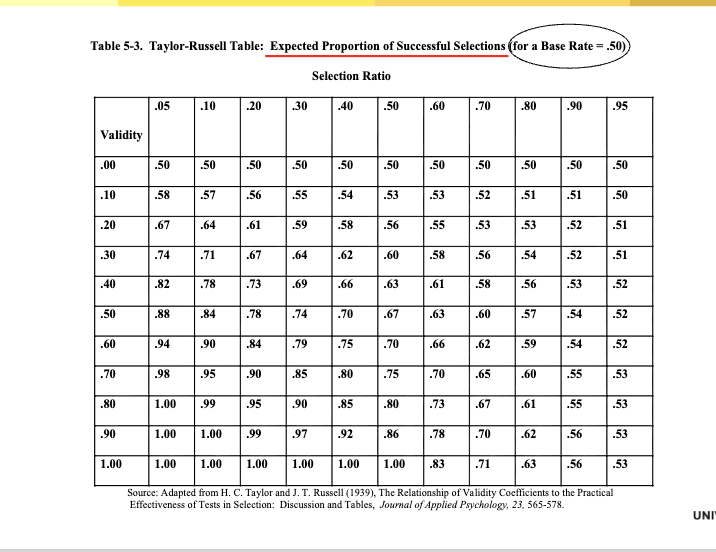
Taylor and Russel (1939)
Tables that give the expected proportion of successful selections from using a
test as a function of varying:
1. Test validity
2. SR
3. BR on the criterion
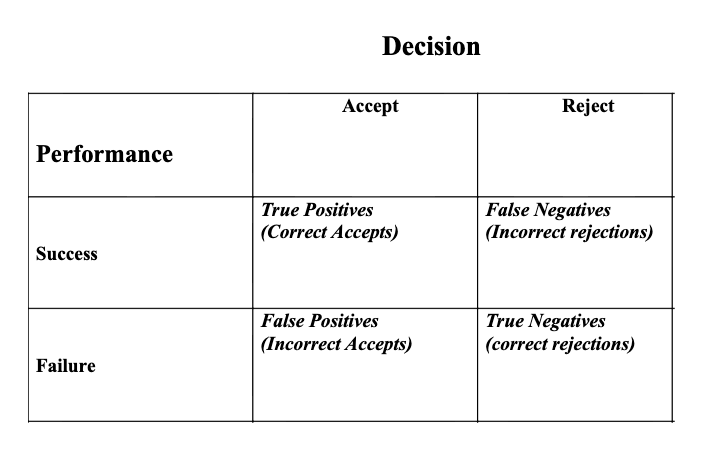
What is a true positive vs false positive?
True positive → accept someone who succeeds
False positive → accept someone who fails
Why do we consider the four decision outcomes?
To evaluate the usefulness (utility) of a test by examining all possible decision consequences.
Why was Hull wrong about test usefulness?
Because test usefulness depends on context; even tests with low validity can be useful, and tests with high validity may not be useful.
What is factor analysis?
A method that groups related variables into a smaller number of underlying factors.
Example:
Questions about stress, worry, and nervousness all group into one factor: anxiety.
What is a latent factor?
An unobserved (hidden) variable that explains patterns of correlations among observed variables.