Pre-Q Economics - Term 2 Examinations
1/42
There's no tags or description
Looks like no tags are added yet.
Name | Mastery | Learn | Test | Matching | Spaced | Call with Kai |
|---|
No analytics yet
Send a link to your students to track their progress
43 Terms
PPC
Production Possibility Curve
Y Axis = Capital Goods
X Axis = Consumer Goods
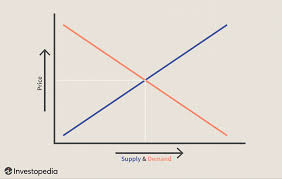
Supply V Demand
Elasticity
% Change in QD
PED = ————————-
% Change in Price
New Price - Old Price
—————————— x 100 = % Change in price
Old Price
QD - Old QD
—————— x 100 = % Change in QD
Old QD
Macroeconomics
How a national economy works as a whole.
Fiscal Policy
Involves varying the level of public expenditure and taxation to influence aggregate demand.
Expansionary Fiscal Policy
Used when:
unemployment is high
economy is slow/recession
Government will:
increase spending (G ↑)
OR reduce taxes (T ↓)
Effect:
people have more money
businesses earn more
demand increases
jobs increase
👉 Result: AD (Aggregate Demand) shifts RIGHT
Contractionary Fiscal Policy
Used when:
inflation is too high
economy is overheating
Government will:
decrease spending (G ↓)
OR increase taxes (T ↑)
Effect:
people have less money
spending drops
demand falls
👉 Result: AD shifts LEFT
Problems with Fiscal Policy
Hard to predict
Higher taxes reduces work incentives
Government Aims
Low & Stable inflation
High & Stable employment
Economic Growth
GDP
Gross Domestic Product = The measurement of the monetary value of all finished goods and services produced within a nation over a period of time.
Conflicts with Government aims
Too much growth causes demand inflation
Boosting employment can trigger inflation
Increased output raises poullution
Consumer Expenditure (C)
Spending within households, holidays, foods, etc.
Monetary Policy
The manipulation of interest rates, exchange rates, and money supply, to influence AD
Expansionary Monetary Policy
Lower interest rates - Cheaper to borrow, less return on saving, good to spend
Quantative Easing = Printing more money to buy bonds, giving banks more money
Contractionary Monetary Policy
Raise interest rates - More expensive to borrow, high return on savings, bad time to spend
Government sells bonds to banks to reduce lending
Exchange rate policy
Lower interest rates reduce demand for NZD, lowering exchange rate (Cheaper exports)
Higher interest rates attract overseas investors, increase demand for NZD, raising exchange rate
Supply side policies
Used to boost AS (Aggregate Supply)
Tax incentives
Education and training to upskil the workforce and increase productivity
privatisation
competition policy to reduce prices and monopolies
Government Expenditure (G)
Total consumption and investment spending by the public sector and the government. Hospitals, public schools
Investment Expenditure (I)
The expenditure undertaken by a private sector business to expand long term productivity. New machines
Exports (X)
Money generated by selling domestic goods and services overseas. Dairy to china
Imports (M)
The outward payments made to buy overseas products. Cars and technology
Economic Growth
Occurs when GDP rises faster than Inflation
Drivers of Growth
Factor Endowments
- High dairy and fertile landLabour force
- Scale and skillLabour Productivity
- GDP / Country’s workforce
Advantages of Economic Growth
More goods and services to satisfy needs and wants
More sales and business profits
Higher employment rates
Better living standards
Disadvantages of Economic Growth
Technology may take over jobs, causing unemployment
Expansion can reduce the amount of natural resources we have
More factory production = more pollution
Negative Economic Growth
Total productive output shrinks
Fewer goods and services are produced
Living standards decline
Long time = Slump
Short time = Recession
Living Standards with Economic Growth
Living standards may not always increase as Country X has deprived cities, then very rich and modern cities that produce lots, contributing to GDP. Their GDP is very high, and increases more than inflation, but the country’s living standards are still low.
The role of the government (As a producer)
Providing:
Public goods
Merit Goods
Public Services
Welfare Services
Public Good
100% Needed in consumption (Defence force, police)
Merit Goods
Have social benefits but are under-consumed (Education)
Public Services
Directly provided services (Transport, ambulances)
Welfare Services
Supporting those in need of jobs and payments (JobSeeker)
Tax Burden
Measuring the proportion of tax from national income of an economy.
Good tax requierments
Equity - Fair for everyone to have the ability to pay
Non-discretionary - Should not be so high that people stop working
Certainty - People know how much to pay
Convenience - It is easy and simple to do
Reasons for tax
Fund public expenditure
Manage the macroeconomy
Reduce income inequality
encourages to buy local rather than overseas
discourages harmful products
Total Cost (TC)
TC = FC + VC
Marginal Costs (MC)
Change in Total Cost / Change in quantity
Average Cost (AC)
TC / Total Output (Q)
Total Revenue (TR)
Price per unit (P) x Quantity sold (Q)
Average Revenue (AR)
Total Revenue (TR) / Total units sold (Q)
Break Even
Total Revenue = Total Cost
Contribution Per Unit
Contribution = Selling price (SP) - Variable cost per unit
Break even point volume
Break-even point = fixed costs / contribution per unit