ACIS Exam 2 Studying
1/68
There's no tags or description
Looks like no tags are added yet.
Name | Mastery | Learn | Test | Matching | Spaced | Call with Kai |
|---|
No analytics yet
Send a link to your students to track their progress
69 Terms
Descriptive Analytics
Analytics performed that characterizes, summarizes, and organizes features and properties of the data to facilitate understanding.
Brief summaries (or factoids) of a data-set that provide a representation of that data as a whole. Generally classified as measures of central tendency or measures of variability.
First step in data analysis performed before diagnostic, predictive, or prescriptive analytics.
What happened? What is happening?
Finds anomalies.
Explains in detail what happened, faithfully representing the substance of what actually occurred without bias or error.
Different tools/techniques:
Pivot tables & charts
Ratio analysis (including DuPont ratios)
Plotting data visually
No requirement that this is done before other analyses (diagnostic, predictive, prescriptive) but often first step performed to begin to address a question of any type.
Accounting needs to be…
Analytics performed that characterizes, summarizes, and organizes features and properties of the data to facilitate understanding.
The four primary financial statements and other financial reporting items provided in an annual report or in a 10K submission to the SEC include:
Balance Sheet
Income Statement
Statement of cash flows
Statement of stockholders’ equity
Footnotes
Balance sheet
Reveals the resources (assets) available for management to utilize and invest as well as who has claims on those resources (summarized as liabilities) and those investing equity (as summarized in stockholders’ equity) at the balance sheet date
Income statement
Summarizes the company’s revenues and expenses during the year (or accounting period); reports income earned and taxes paid.
Statement of cash flows
Reveals the cash inflows and outflows during the year (or accounting period)
Statement of stockholders’ equity
Explains the changes in retained earnings from net income or losses and any (cash) dividends paid to investors
Footnotes
The footnotes to the financial statements provide details on the following:
Expected annual cash paymetns associated iwth long-term debt and lease paymetns
Accounting policies chosen:
Inventory method
Depreciation method
Pension plan assumptions
Segment performance, including sales and oeprating income by segment.
Stock market performance
Other 10K filing information
The 10K has infomration beyond the annual report such as management compensation (stock options and stock ownership), board compensation, biographies of the board (prior background, how long they’ve been on the board, etc.), and board committee membership.
Measures of central tendency include:
Mean, median and mode: Summary measures of the central tendency of the data.
Medians are usually most useful when there are extreme, or skewed, observations (as often shown by extreme minimums or maximums)
By looking at HR data for a period of time, the results can be organized to calculate the average employee salary. However, the data can be skewed by including outliers such as CEO salary, which is generally many times more than the average employee earns.
Measures of variability include:
Minimums, maximums, standard deviations
Minimums/maximums
Summary measures showing extreme values to help explain what happened
By sorting sales data from smallest to largest, you can easilysee the minimum and maximum refunds made last month
Were there any journal entries that had negative numbers (that might be found by looking at minimums), that might be erroneous?
What was the highest stock price in the past 52 weeks? What was the lowest stock price in the past three months?
Standard deviations
Summary measure that shows the extent of the variability for the sample or population
What is the standard deviation of the company’s stock price over the last quarter?
Quartiles
Division of data observations into four defined intervals based on data values as way of comparing to the overall data set
In what quartile does Ford fall based on its leverage compared to the automobile industry as a whole
Deciles
Division of data observations into 10 defined intervals based on data values as way of comparing to the overall data set.
Percentiles
Division of data observations into 100 defined intervals based on data values as way of comparing to the overall data set.
Counts
The number of occurrences of a certain data item or event.
Totals, sums, subtotals
Summary measures of the data
Graphs (line, bar, column charts)
A diagram showing interrelationships between two or more variables
Percentage change
The extent to which a data item gains or loses magnitude or value
Pivot tables
A tool that allows reorganization and summarization of certain data using cross-tabulations without changing the underlying spreadsheet (or data)
Histogram
Display of rectangles with area proportional tot he underlying frequency of the data
Ratio analysis
Quantitative analysis of financial statement items to help evaluate liquidity, solvency, profitability, and efficiency of the underlying company.
Vertical analysis
Expresses financial informaiton in relation to some relevant figure or base.
Descriptive analysis
Used to examine financial performance over a period of time, explaining what happened this year as compared to the year before.
Horizontal analysis
Provides comparative changes about various line items of each financial statement over time.
Displays the dollar and percentage change in financial statements from one period to the next.
Examples of Descriptive Analytics
Descriptive analytics of financial performance using tables and graphs
Considering the right comparison group for analysis
Descriptive analytics using pivot tables and bar charts for accounts receivable aging
Profitability by customer and SKU (individual product)
Horizontal, vertical, and DuPont anaysis of financial performance
Using descriptive analytics to identify phenomena that mgiht require additional analysis, including diagnostic analytics
Pivot chart
Visualization of summarizations included in the pivot table
Percentage change (increase or decrease)
(New - Old) / Old
DuPont Ratio Analysis
Summarizes and disaggregates company performance and can help answer the important question of what happened.
Originally created by the DuPont Corporation to decompose performance (return on equity) into three component parts: profitability (profit margin), activity (asset turnover), and solvency (financial leverage) ratios.
Return on equity, return on assets
Return on equity
Profit margin (net income/sales) x Asset turnover (sales/total assets) x Financial leverage (Total assets/equity)
Measure of profitability generated for each dollar of stockholders’ investment defined as net income (aka net profit) divided by stockholders’ equity, or net income/sales.
Return on assets
Sometimes done for return on assets instead of return on equity (ROE).
A measure of profitability for each dollar of resources (assets) available for management to use, computed as net income / total assets.
Profit margin (net income/sales) x Asset turnover (sales/total assets).
Histograms
Most part expected to be normal (bell curved symmetric about the mean)
Just below 0 → missing observations/lower expected frequency (suggesting anomaly)
Just above 0 → extra observations (higher than expected frequency, also suggesting anomaly)
Descriptive analytics leads to additional questions:
Why would this be?
Did managers make this happen?
Do managers not like small losses? Do they prefer small gains?
Do managers use the flexibility within accounting standards to make earnings higher (or lower) than the expected? If they do manage earnings, how do they do that?
What incentives do they have to manage earnings up or down? To maximize bonus? To maintain a string of positive earnings?
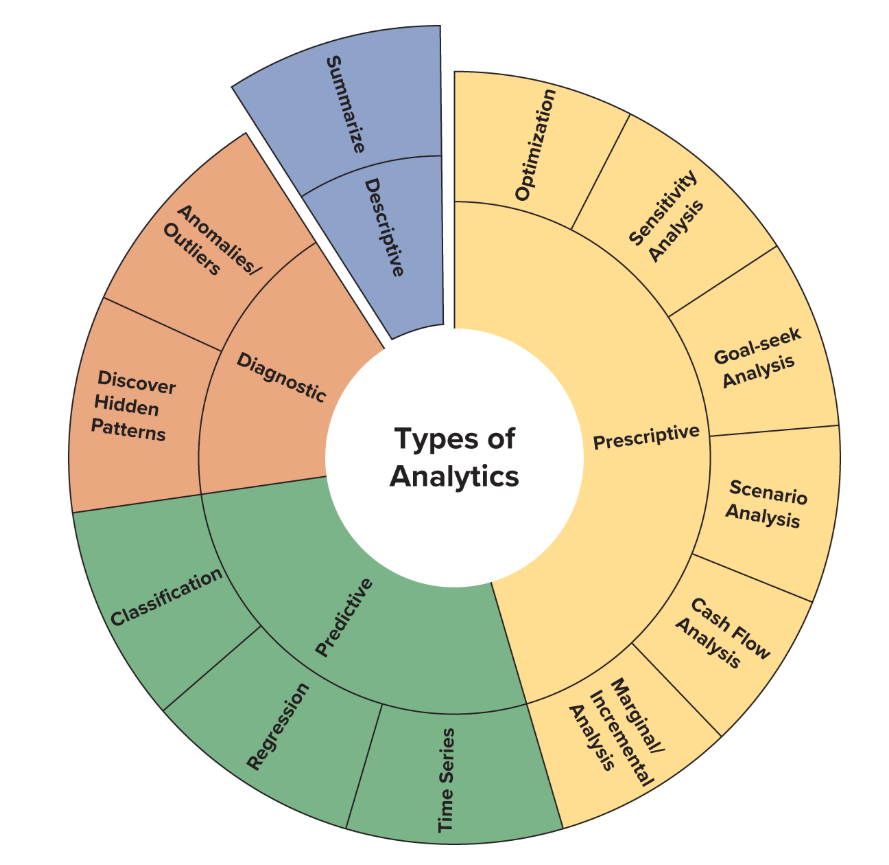
Types of analytics
Sparklines
Brief visuals that fit within one cell in Excela nd visually depict what happens in the cells next to it.
Accounts receivable aging
Popular technique used to determine if credit sales are ultimately going to be collected (or collectible).
The longer the receivable is due and outstanding, the lower the likelihood that the receivable will ever be collected. (Greatest amount of receivables would be in the earliest days due to this)
Diagnostic Analytics
Why did it happen?
What are the reasons for past results?
Analytics performed to investigate the underlying reasons for past results that cannot be answered by simply looking at the descriptive data.
Two categories
Anomalies/outliers - identify unusual, unexpected results or transactions
Discover hidden patterns
Performing drill-down analytics - by looking for patterns in the underlying data set or an external dataset, we can identify potential correlations. Looks for underlying patterns in the data by examining the data at a more detailed level.
Performing statistical analyses - looks to uncover patterns in the data or how data moves together
Considered to help management decide next steps in a rational way rather than based on emotion
Can also be performed through the use of hypothesis testing, either investigating a difference in means or using regression to understand a relationship between the independent and dependent variables.
Anomaly
Something that departs, or deviates, from the norm or the expectation.
Could tell us why something happened
Outlier
Similar to an anomaly
Observation or data point that lies outside its expected distribution
Could be error, fraud, or truth
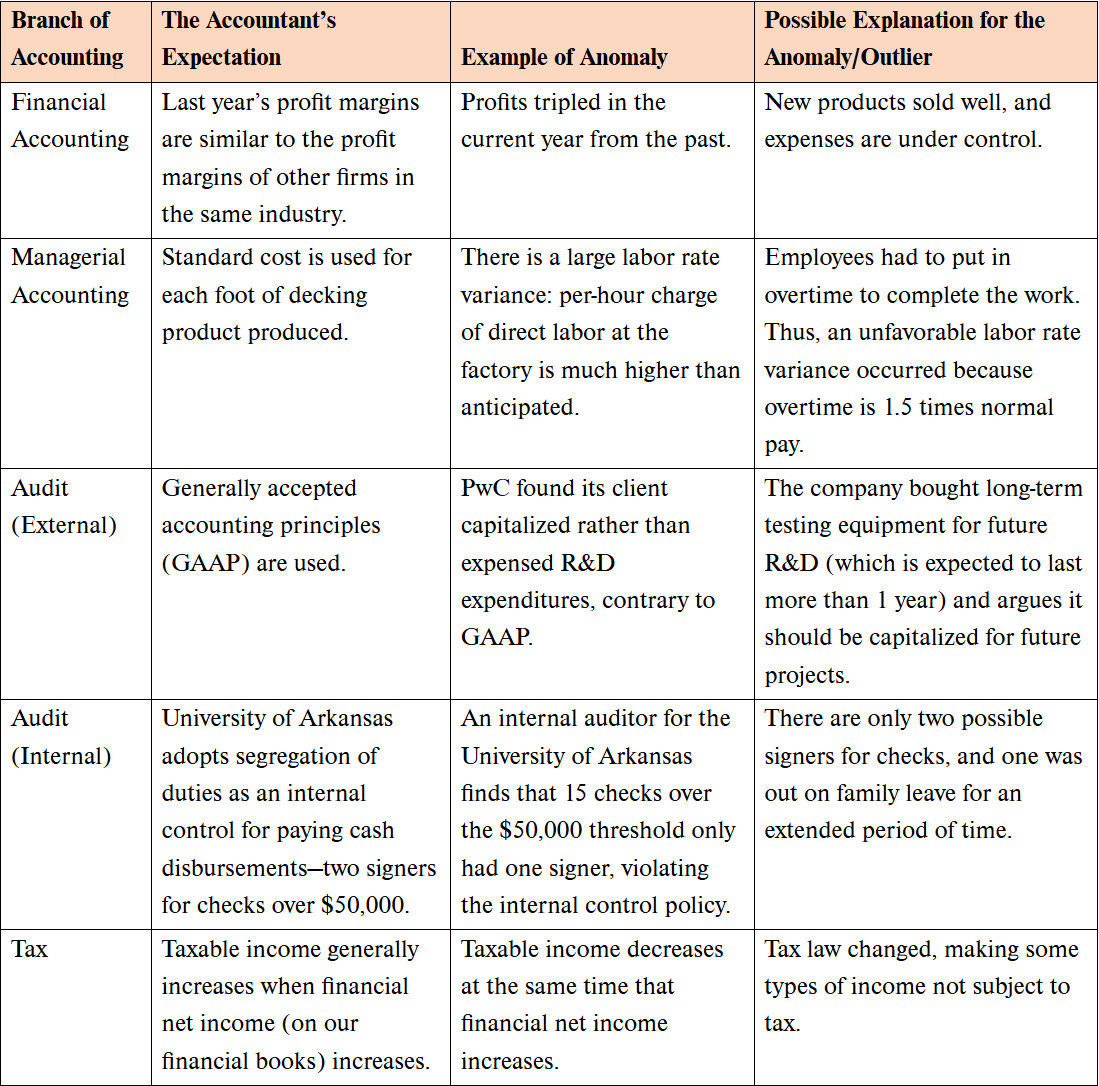
To detect an anomaly or an outlier…
It is important to establish the norm or expectation
Expectation could be:
Standard cost (estimated cost of producing a good or service)
GAAP (generally accepted accounting principles)
Performance by similar companies or performance by the industry as a whole
Management by exception
The practice of bringing specific issues to the attention of management if they depart from expectation
Accountant’s expectation, example, and possible explanation
Diagnostic analytic techniques for identifying anomalies and outliers
Testing for separation of duties
Unusual activity
Duplicate transactions
Fuzzy matching
Sequence checks
Performing:
Bank reconciliations
Variance analysis
Benford’s law
Internal controls testing - separation of duties (segregation of duties)
A common internal control that requires more than on eperson to complete accounting tasks to help prevent fraud and/or errors from occurring. It is important to separate:
Custody of assets
Authorization of hte use of the assets
Recordkeeping
Using diagnostic analyses to evaluate the segregation of duties (or other internal controls)
Was there a violation of the segregation of duties?
Were some large cash disbursements approved by someone who also had recordkeepign responsibility or who had custody of the assets, violating the company’s internal controls of the segregation of duties?
If there was a violation of the segregation of duties, why did it occur?
Was it fraudulent or an error or were there extenuating circumstances that would justify or excuse the violation?
Internal controls testing - unusual weekend, holiday, or end of the quarter accounting activity
Sometimes unusual transactions occur on holidays, weekends, or end of the quarter (end of accounting period), when it is harder to find approval and authorization for certain transactions.
Diagnostic analyses - evaluating holiday, weekend, or end-of-the-quarter activity
Was there abnormal weekend, holiday, or end-of-the-quarter activity?
Were there a large number of transactions that occurred on those dates, and did they have proper authorization?
If there were a lot of abnormal weekend, holiday, or end-of-the-quarter accounting activity, why did it occur?
What was the nature of the transactions?
Was it fraudulent or an error or were there extenuating circumstances that would justify or excuse the violation?
Testing for duplicate transactions
Occassionally, invoices (or other transactions) are recorded twice on the same date, for the same amount, and with the same vendor. We call these duplicate transactions.
If receive error message from accounting system stating that invoice has already been processed → they will gain assurance that the system is working properly.
Were there duplicate invoices (or other transactions) recorded twice on the same date, for the same amount, and with the same vendor?
If there were dplicate invoices, why did it occur?
What was the nature of the transactions?
Why are there duplicates of some transactions in the financial reporting records? Are tehy fraud or just errors?
Fuzzy Matching
A technique used to find potential equivalents when there is less than an exact fit.
Were there any close or fuzzy matches of employee, vendor, or customer names?
If there were fuzzy matches among employee, vendor, or customer names and addreses, why did it occur?
What was the nature of the transactions?
Was it due to fraud, error, or just a coincidence?
Tolerances can be set to note how close of a mathc is close enough - 50, 70, or 80%
Tolerances too low - Type 1 error
Tolerances too high - Type 2 error
Sequence check
An analysis to see if the key number field i the record is in the correct ascending or descending order.
Were there any sequence gaps?
If there were sequence gaps, why did they occur?
What was the nature of the transactions?
Was it due to fraud, error, or just a coincidence?
Bank reconciliation
A type of diagnostic analytics for identifying anomalies is reconciling the cash account in the general ledger to the bank statement. Helps identify transactions on the bank statement that do not correspond with the company’s general ledger and vice versa.
Potential reconciling items include:
Outstanding checks → checks written by the company but not yet processed by the bank
Outstanding deposits → deposits recorded by the company but not yet processed by the bank
NSF checks → checks reported as received by the company, but the bank does not recognize them becasue the check writer has insufficient funds
Electronic funds transfer (wire transfer) → transfers received by the bank but not yet reflected by the company
Notes (loans made to customers collected by the bank) and interest (owed on notes from the customers and collected by the bank) → the company may nt be aware of the amounts of these items until it receives the bank statement
Bank service fees → fees the bank charges for its services and checking accounts. the bank deducts these fees directly from the company’s checking account. The company may not account for the fee until it receives the monthly bank statement
Errors → sometimes made by the company ro the bank in recording a transaction. Accountants find these errors by comparing the amounts for each transaction on the general ledger and each transaction on the bank statement
Expectation and anomaly
Cash balance at the bank is te same amount as cash balance in the general ledger
The cash balance at the bank is not the same amount as the cahs balance on the company’s general ledger. Why?
Variance analysis
Management accountants need to perform this to identify and explain the difference between a budget amount (or standard costs) and actual performance. The anomaly would be the difference or variance form what was expected.
Price variance
Variance due to the changing price of materials
Quantity (or usage) variance
The company used too many mateirals to produce each product than it budgeted to use.
Labor rate variance/quality
Labor rate being lower or higher than expected, hours worked higher or lower than budgeted
Fixed manufacturing overhead variances/variable manufacturing overhead variances
Consider the impact of overhead costs that are different from expectation.
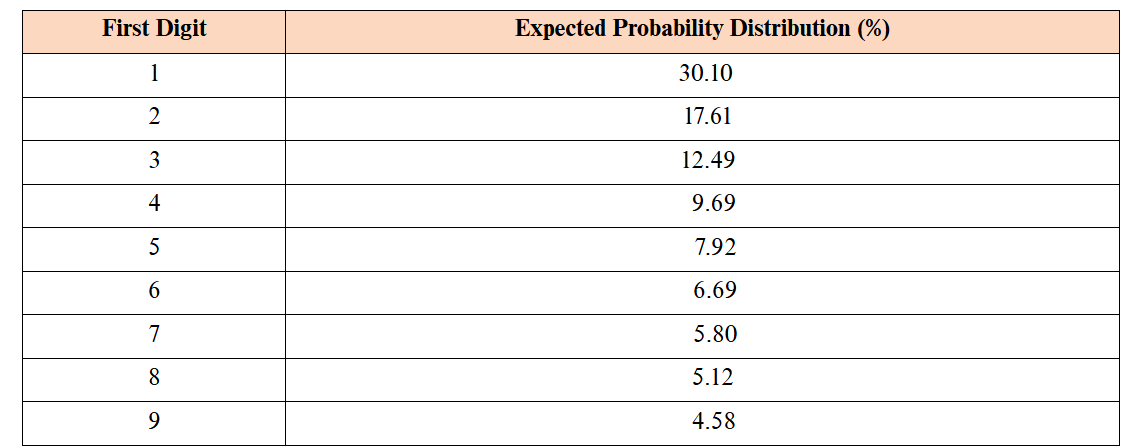
Benford’s law
The principle that in any large, randomly produced set of natural numbers, there is an expected distribution of the first, or leading, digit.
More numbers in a population of numbers start with 1 than any other digit, followed by those that begin with 2, then 3, and so on.
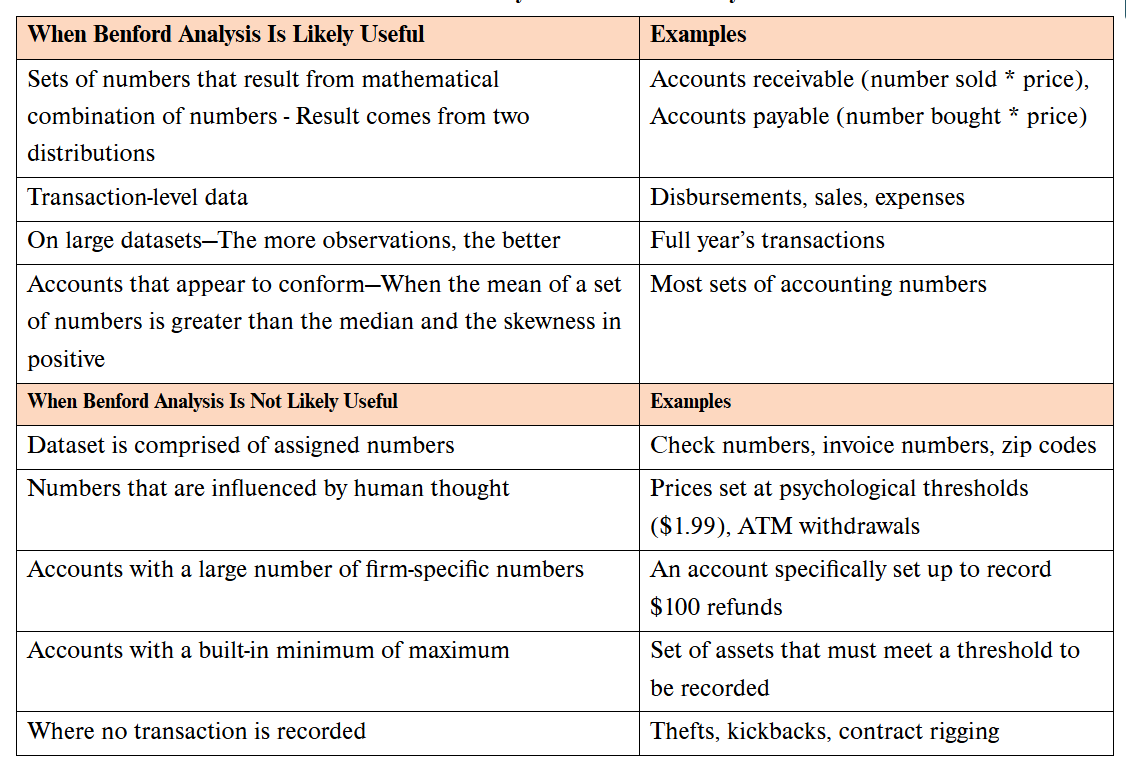
Any time there is a limitation placed on naturally occurring datasets, the dataset will usually violate Benford’s law
Examples of accounting based data that in general conform with Benford’s law
Earnings per share
Earnings
Sales
Forecasts of earnings by financial analysts
Total assets of the fortune 500 or russell 3000, etc.
When Benford’s law is useful and when it isn’t
Drill down analytics
Looks for underlying patterns in the data by examining the data at a more detailed level.
Peeling each layer of an onion and deciding whether it is reasonable and/or feasible to go down one more layer to understand the pattern.
Analysts can identify potential correlations
Examples of drill down analytics
Analysis of the highest owning customer
By having more infroamtion about what individual customers owe, we will have a better idea of the deb’s collectability
Analysis of the most profitable customer
Company can better work and cater to these customers and work to make unprofitable customers more profitable
Analysis of the most profitable product
Company can bette prmote them to its customers
Analysis of the relationship between accounts payable clerks and its vendors
Looking to detect relationships within a data file that could be potential indicators of fraud
See if there is any unusual relationships between them
If an A/P clerk is paying one vendor more quickly, perhaps the vendor is also providing some favors back to the A/P clerk such as a kcikback scheme or side payment to the A/P clerk for this and other favors
Sunk cost fallacy
Commitment to past investments made escalates and makes it harder to abandon prior investments that may no longer be profitable even if it may not make rational sense.
Determining statistical linkages, patterns and relationships among variables using statistical tools and techniques
It is important to determine this.
Looking at events that identified anomalies may uncover hidden relationships
Correlation, tests of differences in means, regression analysis, cross-tabulations, filtering, and time-series data analytics can all be useful techniques for uncovering hidden or unknown patterns, or stories, in the data
Two-sample t-test difference of means
One way of uncovering causal relationships is to form hypothesis of what you expect will or will not occur.
Used to determine if the means of two different populations are the same or statistically different from each other.
Regression
A basic technique used in diagnostic analytics that allows the accountant to evaluate whether a specific dependent variable outcome value is related to independent variable inputs
Determining the relationship between two sets of variables when we believe that one variable is dependent on the other.
Diagnostic analytics summary
Attempts to address the question of why something happened
Break down into 2 broad categories
Exploring anomalies and outliers (including a discussion of how the expected amounts are determined)
Drilling in to the detail using various tools and techniques
Techniques:
Benford’s law
Bank reconciliations
Fuzzy matching
Sequence checking
Duplicate payments
Predictive analytics
Analytics performed to provide foresight by identifying patterns in historical data and assessing likelihood or proabability.