Part 4: Consumer behaivour
1/19
Earn XP
Description and Tags
Consumer equilibrium,Deriving the DC, Income& Substituion effects
Name | Mastery | Learn | Test | Matching | Spaced | Call with Kai |
|---|
No analytics yet
Send a link to your students to track their progress
20 Terms
What is consumer equilibrium and how can consumers do this with reference to the curves
We have one of what? and multiple of what?
The consumer’s goal is to make themselves as happy as they can, within the constraints of what they can afford.
Trying to reach the HIGHEST indifference curve, subject to their budget constraint
One budget line and multiple IC’s, the BUNDLE that touches the BL is the equilibrium
What does Optimal bundle choice mean
-Tangency
-MRS=
-Occurs when
IC tangent to BL, SLOPES are equal at this point
MRS=MRT
Consumer is willing to trade between Good A and B at the same ratio the Market forces them to trade (trade at rate of Oppo. cost)
True/ False:
MRT is consumer based and MRS is market based
False
The other way around
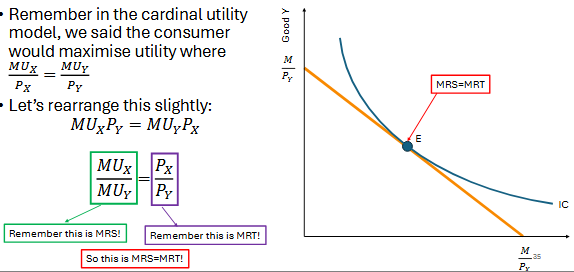
How would Consumers maximise utility cardinally and how can we rearrange this so that its MRS= MRT
MUx/Px=MUy/Py
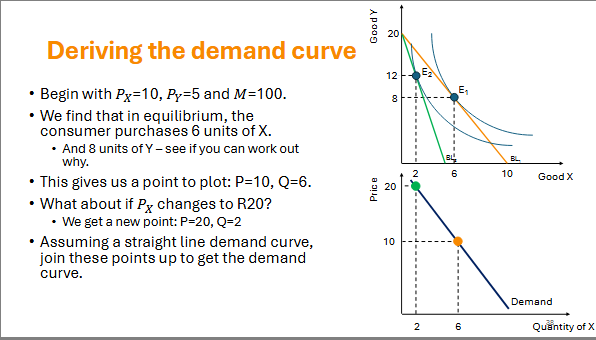
Deriving the Demand curve
We have the budget line 10x+5 Y=100
Sub in 6(given) to get y=8
Demand curve: The price is given as R10 and we know at equilibirum the consumer buys 6 units
When price changes to 20 (given),the units consumed is 2 (given)
Sub in 2 into the new budget line 20x+5y=100 and you get the 12
What’s the:
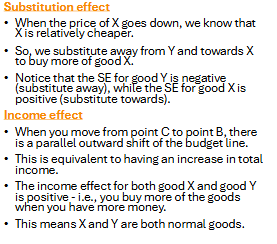
Substitution effect
Income effect
The relative price of good X and good Y has
changed. So, you may choose to substitute
between the goods now that one may look
relatively cheaper/more expensive
This effect says that because of the change in
relative prices, your real income has changed. As
a result, you may choose to adjust how much of
each good you purchase
Real income vs nominal income
Nominal income: The actual amount of money you have (here, M=100).
Real income: The purchasing power of that money — i.e., how many goods and services you can buy with it, given current prices.
(Purchasing power and real income)
(When the price of Good X rises from 10 to 20:
Your nominal income hasn’t changed (still 100).
But your real income falls, because that same 100 now buys fewer units of X than before.)
Which effect do the following questions fall under:
Under the new relative prices, which consumption bundle would I substitute for, so that I have the same level of utility as before?
How does my consumption of the goods change if I were to change my income, without varying the prices of goods X and Y?
Substitution effect
Income effect
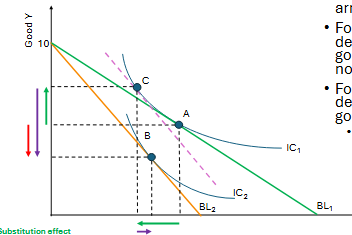
What type of movements does the substitution effect and income effect cause and where do they move
movement along the same indifference curve
parallel shift of my budget line
How should the hypothetical budget line look when working out income and substitution effects,2 important points
Have new relative price ratio (i.e., be parallel to our new budget line)
• Be tangent to our original indifference curve
Add point C (point of tangency)
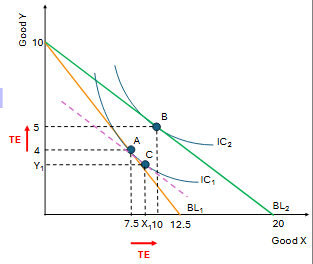
What is the Total Effect
What is it made of
(btw Px decreased in this example)
We say the total effect on consumption is the shift from A to B.
Income and Substitution effect (vector arrows)

Explain this graph in terms of the two effects
ADDING ON* :A and C are both on the same utility curve.Substitution effect means utility must be the same
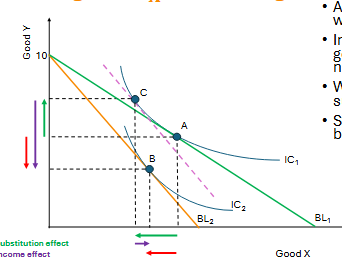
What happened to price X now
Px increased
How do we know this is an example of inferior goods(HINT:Purple arrows)
Look at the Income Effect
arrows now (purple arrows)
• For good Y, when real income decreased, consumption of good Y decreased (this is a normal good).
• For good X, when real income decreased, consumption of good X increased.
• This is the characteristic of an inferior good.Meaning Good X is it. When income falls consumers substitute for the cheaper item
Imagine a price change in good x
NORMAL GOODS
When price changes, the____ always goes opposite to the price change.
The _______ works in the same direction as the substitution effect.
So both effects reinforce each other.
substitution effect
When the price of a good falls, it becomes cheaper relative to other goods.
Rational consumers substitute toward it → buy more of the cheaper good.
Always moves opposite to the price change.
income effect
A price fall increases real income (your money can buy more).
For a normal good, higher real income means you buy more of that good.
For a price rise, real income falls → you buy less.
So the income effect moves in the same direction as the substitution effect for normal goods.
Imagine a price change in good x
INFERIOR GOODS
The substitution effect still goes____ to the price change.
But the income effect goes in the ____ direction to the substitution effect.
Substitution effect is stronger, so it dominates the income effect.
-What does second point mean
opposite
opposite
Opposite direction means substitution says ‘buy more,’ while income says ‘buy less.’
What is the paradox of value(it asks what questions,using which 2 resources) ,who invented it
Adam smith
• Why is water cheap and diamonds expensive?
• Water is very useful – it supports all life on Earth.
• Diamonds are largely useless
What is the Basic idea of the Paradox of value and explain using diamond-water paradox
Basic idea is to consider the marginal utility of the products not
their total utility
The paradox
Water: essential for life, huge total utility, but very cheap.
Diamonds: not essential, small total utility, but very expensive.
Why? Because prices reflect marginal utility, not total utility.
Explanation
Total utility: Water gives enormous satisfaction overall (we need it daily).
Marginal utility: Each extra unit of water adds very little satisfaction (the 100th glass doesn’t matter much).
Diamonds: Total utility is small (not life‑saving), but each extra unit adds a lot of satisfaction because they’re rare.
So the marginal utility of diamonds is high, while the marginal utility of water is low.
Prices are determined by marginal utility → diamonds are expensive, water is cheap.
Marginal utility can be modelled by a .
• Total utility can be modelled by
Demand curve
-Demand is about how much extra satisfaction (marginal utility) you get from each additional unit.
As marginal utility falls with more consumption, willingness to pay falls → this shapes the downward‑sloping demand curve.
Consumer surplus
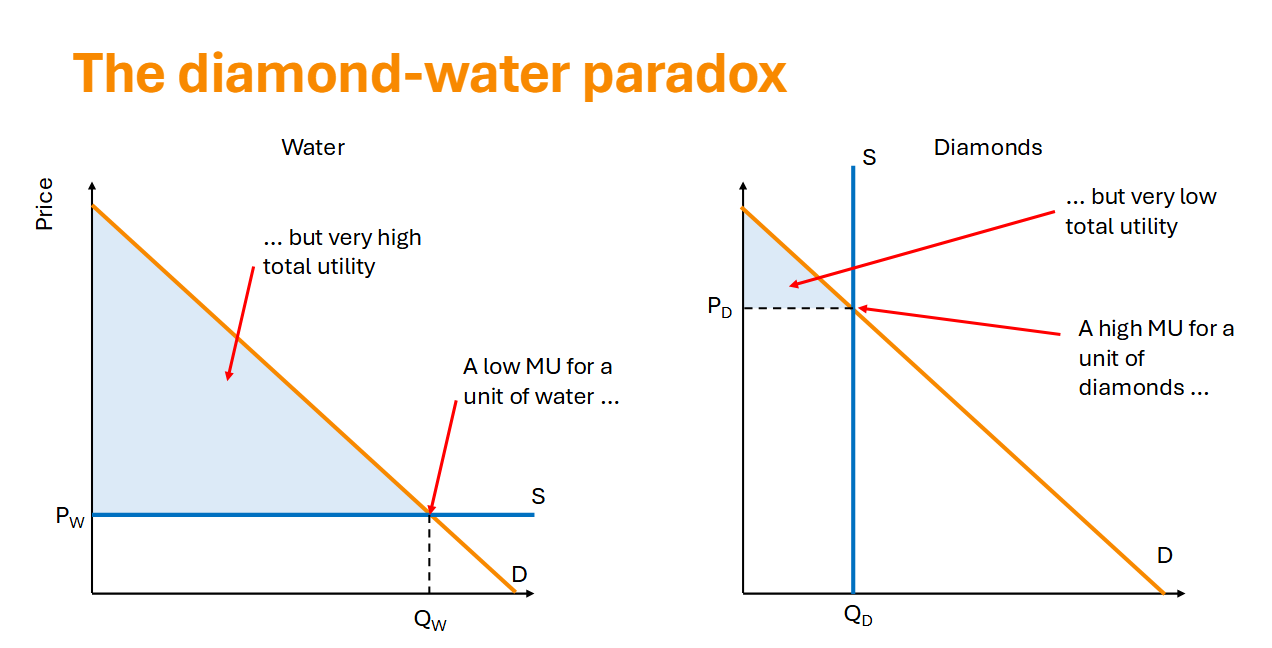
How to read this graph? How is MU low when quantity demanded is is high for left graph
Explain right graph
High quantity demanded at low price → means people consume a lot of water overall. That’s why the shaded area (total utility) is huge.
Marginal utility is low → because once you already have plenty of water, each extra unit adds very little satisfaction.
On the graph:
The demand curve itself represents marginal utility (willingness to pay for one more unit).
At the equilibrium point, the price of water is low, so the marginal utility of an extra unit is also low.