measures of central tendacy and graphs and standard dev
1/22
There's no tags or description
Looks like no tags are added yet.
Name | Mastery | Learn | Test | Matching | Spaced | Call with Kai |
|---|
No analytics yet
Send a link to your students to track their progress
23 Terms
measures of central tendency
mean median or mode
measures of dispersion
to what extent is the data spread out e.g. range or standard deviation
graphical representations
bar chart
histogram
tables
mean advantages
most sensitive measurement because it uses all data
mean disadvantages
can be effected by extreme scores and distort the value
median advantages
not affected by extreme scores
median disadvantages
not as sensitive as the mean because not all data is used in its calculation
mode advantage
not affected by extreme values
mode disadvantage
not as sensitive because it only shows the most frequent score
which measure of central tendency do you use
mean is normally the most accurate
avoid using mode if the data is bimodal
do not use median if the data is wide ranging because it wont give a true reflection
range advantage
easier to calculate and understand than other measures e.g. standard deviation
range disadvantage
gives no information about whether the scores are clustered around the mean or spread out
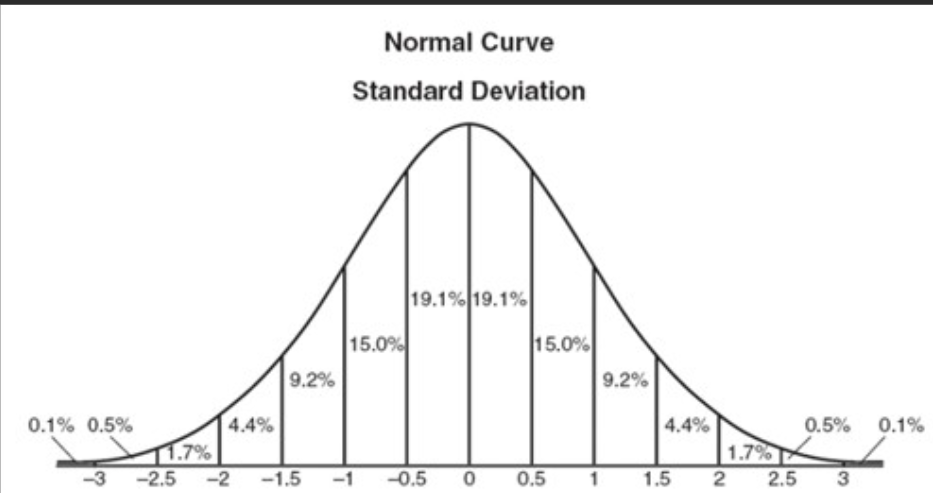
standard deviation
this measures how far each score was away from the mean
larger standard deviation = scores are very spread out away from the mean
standard deviation advantage
all scores are used so its a very sensitive measure of dispersion - better than range
standard deviation disadvantage
more time consuming to calculate than the range
bar chart
represents categories = discrete data
not continuous data on the X axis
histogram
bars touch each other
data on X axis is continuous
scattergram
only used for correlations
tables
show the raw data before any analysis
normal/symmetrical curve of standard deviation
the distribution and frequency of scores on the left side matches those on the right
height, weight, IQ, blood pressure
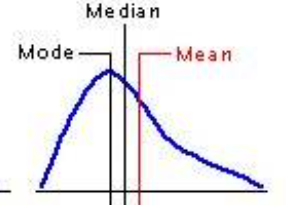
what type of data skew is this
positive skew
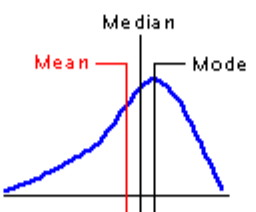
what type of data skew is this
negative skew
negative skew in a distribution curve
the mode is a higher number than the median and the mean because extremely low scores have distorted the mean