Bio II: Exam 3
 Call Kai
 Learn
Learn Practice Test
 Spaced Repetition
 Match
Match Flashcards
 Knowt Play
1/37

Earn XP
Description and Tags
aka the FINAL
Name | Mastery | Learn | Test | Matching | Spaced | Call with Kai |
|---|
No analytics yet
Send a link to your students to track their progress
38 Terms
population density and population structure
number of individual per unit of area or volume
ex. number of nests, fecal deposit, tracks, mark-recapture
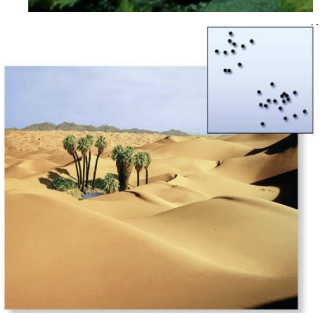
Clumped dispersal
Individuals are in patches
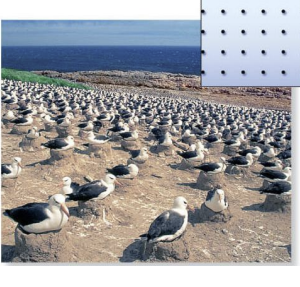
uniform dispersal
evenly spaced pattern of dispersion and direct interactions between individuals
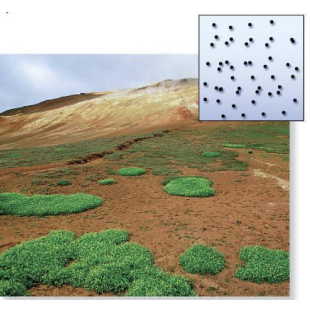
Random dispersal
When each individual in a population is independent of other individuals
life history
traits that affect an organisi’s schedule of reproduction and survival
semelparity
a one-shot pattern of reproduction
all offspring are made in one reproductive event
die after reproduction and common in invertebrates
usually occurs in harsh environments
iteroparity
reproduces several times throughout life
low chance of survival for juveniles, hence the repeated reproductions
can be seasonal or continuous
Stable population
when populations grow with many young individuals and decline with few evenly distributed
life tables
summarizes the survival and reproductive rates of individuals in specific age-groups within a population
cohort
group of individuals of the same age, from birth until all of the individuals are dead
survivorship curve
a plot of the proportion/numbers in a cohort still alive at each age
type I
Common in humans and mammals
few offspring
high parental care
die at old age due to sickness or predation
type II
annual plants, rodents, lizards, birds
survival probability does not change with age
occasional parental care
type III
high death rates for the young
alot of offspring
no parental care
those that survive reach old age
exponential growth
potential to expand greatly when resources are abundant
population growth is constant
carrying capacity (K)
the maximum population size that a particular environment can sustain
logistic growth
the per capita rate of population growth while it approaches zero as the population size nears the carrying capacity (more realistic)
biological community
an assemblage of populations of various species living close enough for potential interaction
intraspecific interactions
relationships among individuals of a population
interspecific interactions
relationships between species in a community
competition
(-/-) interaction
different species compete for a resource in short supply
can lead to competitive exclusion → local elimination of competition species
competitive exclusion principle
two species competing for the same limiting resource cannot exist in the same place (1 species per niche)
resource partitioning
differentiation of ecological niches, enabling similar species to coexist in a community
predation
(+/-) interaction
one species kills (predator) and eats the other (prey)
defensive adaptations
mechanical defense, chemical defense, aposematic coloration (warning), cryptic coloration (camouflage)
Batesian mimicry (harmless species mimics harmful one) and Mullerian mimicry (unpalatable species mimic each other)
herbivory
(+/-) interaction
eats part of plants or algae
secondary compounds = chemical defenses
mechanical defenses = often osmoregulated
symbiosis
can be (+/+), (+/0), (+/-))
a dependent relationship where two or more species live in direct and intimate contact with one another (long term)
ecological niche
total of a species’ use of biotic and abiotic resources
parasitism
(+/-) interaction
one organism, the parasite derives nourishment from the host who is harmed in the process
mutualism
(+/+) interaction
interspecific interaction that benefits both species
commensalism
(+/0) interaction
one species benefits and the other is apparently unaffected
species richness
total number of different species in the community
relative abundance
the proportion each species represents of the total individuals in the community (any dominant species?)
Shannon diversity index (H)
index of diversity based on species richness and relative abundance
higher H = more diversity)
Trophic structure
the feeding relationships between organism in a community
bottom-up model
community organization has a unidirectional influence from lower to higher trophic levels
primary producers → herbivores → predators
top-down model
proposes that control comes from the trophic levels above
predators → herbivores → primary producers