Econ 101 chapter 14
1/13
There's no tags or description
Looks like no tags are added yet.
Name | Mastery | Learn | Test | Matching | Spaced | Call with Kai |
|---|
No analytics yet
Send a link to your students to track their progress
14 Terms
Market structures
perfect competition, monopolistic competition, oligopoly, and monopoly
Profit
𝑇𝑅 (Total Revenue) − 𝑇𝐶 (Total Cost)
Profit = 𝑃 𝑞 − 𝑇𝐶(𝑞)
Both the total revenue and total cost are the determinants of profit and they depend on the output quantity, 𝑞.
Marginal Revenue, MR
The revenue of selling the next unit of output
The increase or change in TR of selling the next unit = Market Price
The MR curve for a competitive firm= the revenue received of selling the next unit to the market
Graphical analysis of profit maximization
(1) Determine 𝑞 so that 𝑃 = 𝑀𝐶.
(2) Use an area representing the profit or loss using the quantity determined in (1).
Profit = 𝑇𝑅 − 𝑇𝐶
• A firm incurs a loss if the area of 𝑇𝑅 < the area of 𝑇𝐶.
Measure the profit or loss at the output quantity
First method: Profit=TR-TC= P x q-ATC x q
Second method: Profit=Tr-TC= (P-ATC) x q
= profit per unit on average x quantity sold
Why use the second method?
At the output: P > ATC: Positive profit: Making profit.
P=ATC: 0 profit: Breaking even
P <ATC: Negative profit: Loss
The steps for doing the graphical analysis to determine profit:
(1) Determine the output quantity: Draw the MR curve; it is the price line for a competitive firm. Draw the MC curve: Use the intersection of the price line and MC curve to determine the quantity.
(2) Find the area representing the profit or loss using the quantity in (1).
Method 1: Identify the area of TR. Use the ATC curve to determine the area of TC.
The area of the profit or loss = Area of TR – Area of TC, or
Method 2: The area of the profit or loss =(𝑃 − 𝐴𝑇𝐶) x 𝑞
SR Individual Supply
The quantity supplied by an individual firm at different prices
SR Individual supply curve:
The portion of the MC curve above the minimum point of the AVC curve; the quantity supplied is zero when price < minimum AVC.
Market supply
Total market quantity supplied at different prices.
the sum of individual supplies at different prices= (the output quantity of a typical firm at different prices) x (number of firms)
Market supply decreases, number of firms increases.
Supply curve shifts left: number of firms shift right (increases)
SR Market Equilibrium
To determine the market price, determine the SR market equilibrium.
Find the price so that
market demand = market supply.
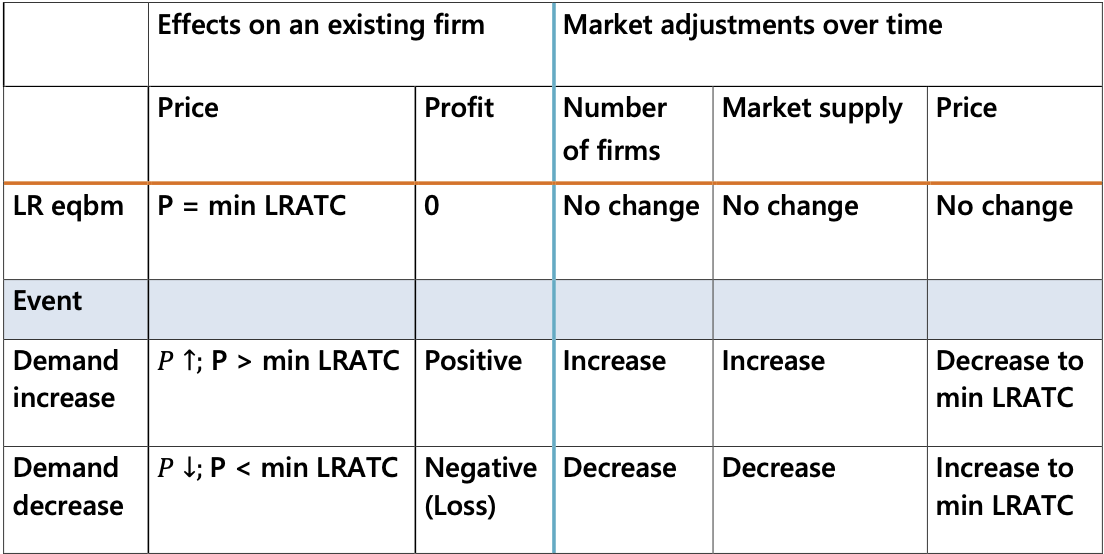
The basic idea of LR market equilibrium
A market is in a LR equilibrium when it does not have further changes.
This implies the price needs to be stable.
For the price not changing,
the number of firms and the market supply need to be fixed.
This implies the long-run profit needs to be $0.
Otherwise, new firms would want to enter or some existing firms want to exit.
The number of firms, market supply, and the price would be changing.
The market would not be in a LR equilibrium.
The two conditions required for long – run equilibrium:
(1) Demand = Supply
(2) 𝑃 = minimum 𝐿𝑅𝐴𝑇𝐶
A change in demand
Competitive markets have the following features:
1. Characterized by no barriers to entry, a large number of firms producing identical products, and firms that are price takers.
Firms maximize profits by choosing their output quantity so that their marginal cost equals to the market price.
In the SR, existing firms may make profits or incur losses because the number of firms is fixed.
4. However, the changing number of firms and market supply will ensure the LR profit is $0 for competitive firms.