Math 146 final exam (SCC) questions and answers
1/27
There's no tags or description
Looks like no tags are added yet.
Name | Mastery | Learn | Test | Matching | Spaced | Call with Kai |
|---|
No analytics yet
Send a link to your students to track their progress
28 Terms
Random variable for the average of a sample
X-bar
Random variable for a sample proportion
P-hat
Random variable for a population
X
4 conditions of P-hat
1. random sample
2. independence between values in sample
3. n/N < 10%
4. np >or= 10, nq >or= 10
4 conditions of X-bar
1. random sample
2. independence between values in sample
3. n/N < 10%
4. Central limit theorem holds
Central limit theorem guidelines
Symetric unimodal - n >or= 3 required
Slightly skewed - n >or= 15 required
Very skewed - n >or= 30 required
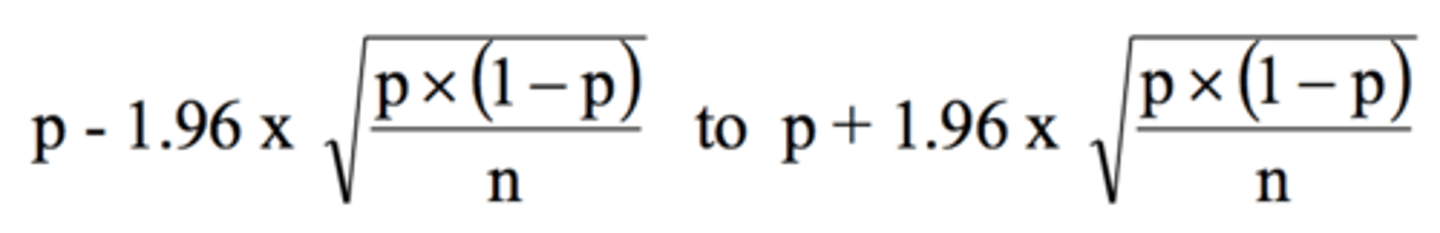
Equation for 95% CI
*all letters have a "hat" to indicate sample population
Explain Confidence Intervals (CI)
Given a sample from a population, the CI indicates a range in which the population mean is believed to be found, indicating the lower and upper boundaries.
2 ways to narrow a confidence interval
1. increase sample population (n)
2. decrease confidence level
p vs. P-hat vs. p-value
p: population proportion
P-hat: sample population proportion
p-value: area of the tail of a distribution
4 conditions for hypothesis testing
Same conditions as P-hat
1. random sample
2. independence between values in sample
3. n/N < 10%
4. np >or= 10, nq >or= 10
Interpreting p-value vs. alpha
p-value > alpha : reject the null
p-value < alpha : fail to reject the null
What is alpha?
Alpha is the area under the curve where a null hypothesis would be rejected
Type 1 error
rejected null when null was actually true
Type 2 error
failed to reject null when null was actually false
Error vs. CI
Error is 1/2 of the width of a confidence interval
Null hypothesis
the status quo, involves an equality (=), may be called "baseline"
Alternative hypothesis
not the status quo, what is suspected to be really happening
Probability of a type 1 error
P(type 1 error) = alpha
How the results of a CI test and hypothesis test can be consistent
If a 2-tailed hypothesis test is done with alpha=1-(confidence level) then the results will be consistent
4 conditions for hypothesis testing involving X-bar
similar to 4 conditions of X-bar
1. random sample
2. independence between samples
3. n/N < 10%
4. Central limit theorem holds
As n grows, a T-distribution will...
become a normal distribution
Positive association/correlation in a scatter plot
as x increases, y also increases
Negative association/corrolation
as x increases, y decreases
Describe the coefficient for association/correlation
represented with r
is between -1 and 1
can only be used for linearly associated data
Equation for line of best fit
y-hat = ax+b
a= slope
b= y-intercept
Explanatory variable
the x-variable
Response variable
the y-variable