4.1.1.5 - Production Possibility Diagrams
1/16
There's no tags or description
Looks like no tags are added yet.
Name | Mastery | Learn | Test | Matching | Spaced | Call with Kai |
|---|
No analytics yet
Send a link to your students to track their progress
17 Terms
Production Possibility Curve (PPC/PPF) =
A curve which shows the maximum combination of two goods that can be produced when all the available resources are fully and efficiently employed. (Max output)
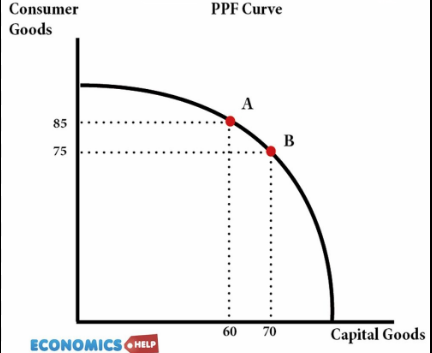
PPC Diagram
Axes either Good A & Good B, or Capital Goods & Consumer Goods
Any point within/inside PPF:
Resources are not being fully or efficiently used/employed. Resources used inefficiently - not maximising goods produced
Any point outside/beyond PPF
Currently unattainable without increasing number of resources or increasing productivity of its current resources or improving technology
Any point on PPF:
Resources are being fully and efficiently used/employed - productively efficient
Why is the PPF curved?
Economic resources are not completely adaptable to alternative uses - resources may be better at producing one type of good than another
Law of diminishing returns - The cost of producing successive units will eventually increase as additional inputs are less efficient
Opportunity cost is not constant along the PPF. Bowed outwards because of increasing opportunity costs of production
A combination of goods containing more of which type of good leads to more economic growth and consumption in the FUTURE?
Capital Goods. Because capital goods can be used to produce more consumer goods in the future
PPF to show Short Run Economic Growth
A movement of a point outwards
PPF to show Long Run Economic Growth
Shift of the curve outwards
Why do shifts in PPF occur?
Improvements of QQE of CELL
Capital:
Quantity - Investment in new machinery
Quality - Technological advances
Enterprise:
Quantity - Encouraging more entrepreneurial activity (e.g. by gov. grants)
Quality - Education, training & development
Land:
Quantity - New resources like oil and wind
Quality & Efficiency - Redevelopment (e.g. improving drainage)
Labour:
Quantity - More immigration, higher birth rates
Quality & Efficiency - Education and training, division of labour / specialisation
Flaws of PPFs
Unrealistic to only look at 2 goods
Impossible to know the exact output gained from each resource we have
Factors of production available are fixed in PPF's, however they are constantly changing in real life
Full employment of resources is often assumed, whereas this is rarely a reality
Productive Efficiency
When the maximum output is produced from the available factors of production
and when it is not possible to produce more of one good or service without producing less of another
Allocative Efficiency
When all the available economic resources are used to produce the combination of goods and services that MAXIMISE SOCIETY'S WELFARE
Requires value judgement, so unable to determine point on PPC
Economic Welfare
Utility gained through the achievement of material goods & services
Opportunity Cost
The cost of forgoing the production of one good to produce more of another
Trade-off
The act of choosing to produce one good over another
How does PPC illustrate different features of the Fundamental Economic Problem?
Resource Allocation:
Refers to how an economy decides to distribute its limited resources between the production of different g&s
The PPC shows the maximum potential output combinations of two goods, assuming efficient use of resources.
Points on the curve represent different choices of resource allocation
Opportunit Cost & Trade-offs:
On PPC, moving from one point to another invovles a trade-off - choosing to produce more of Good A instead of Good B.
This has an opportunity cost, being the amount of Good B sacrificed to increase the production of Good A
Unemployment of Economic Resources:
Points inside the PPC represent unemployment of resources - where there is inefficiency and resources are underutilised
This means the economy is not operating at full potential
Economic Growth:
SREG can be shown by a movement of a point outwards
LREG can be shown by a shift of the PPC outwards, showing an increase in productive capacity
Shift of PPC occurs due to improvements of QQE of CELL