AUCHE 220 Midterm #1
1/67
There's no tags or description
Looks like no tags are added yet.
Name | Mastery | Learn | Test | Matching | Spaced | Call with Kai |
|---|
No analytics yet
Send a link to your students to track their progress
68 Terms
Analytical Chemistry
The branch of chemistry that deals with isolating, identifying, and quantifying material of interest (the analyte).
Qualitative vs Quantitative analysis
Qualitative: determination of non-numerical properties
Quantitative: Determination of the numerical amount
Steps in chemical analysis
formulating the question, selecting analytical procedures, sampling, sample preparation, analysis, reporting and interpretation, drawing conclusions
Formulating a Question
Asking a meaningful question
Selecting an analytical procedure
availability, cost, speed. Composition and amount of sample available
Sampling
Lot: Total material from which a sample is taken
Sample: A dmaller, representative collection of units from the lot used to determine something about the lot
Sampling: process of selecting a representative material to analyze from the lot.(largest source of uncertainty)
Stratified sampling
Compositive sample
involves diving the lot into specific zones based on homogeneous characteristics
a sample formed by combining subsets of samples
Sample preparation
converts a representative bulk sample into a form suitable for analysis
Masking
To transform an interfering species into an undetectable form
Sample Prep diagram
Aliquot is portions taken for individual analysis
Solution
a homogenous mixture of two or more substances
Solute vs solvent
-substance that is being dissolved
-substance that is used to dissolve the solute
Concentration
amount of solute in a given volume or mass of solution or solvent
Mole(mol)
amount of substance that contains the same number of elementary entities as there are atoms in exactly 12g of carbon-12 isotope
Avogrado's number (Na)
6.02214199 times 10^23 mol^-1. Number of elementary entities in 1 mole of a substance
Molarity (molar conc.(M))
number of moles of solute per liter of solution. Changes with temperature
Molality(m)
number of moles of solute per kg of solvent. Independent of temperature
Avogrado's Law
Part of ideal gas law; the volume of an ideal gas is proportional to the number of moles when pressure and temperature is constant.
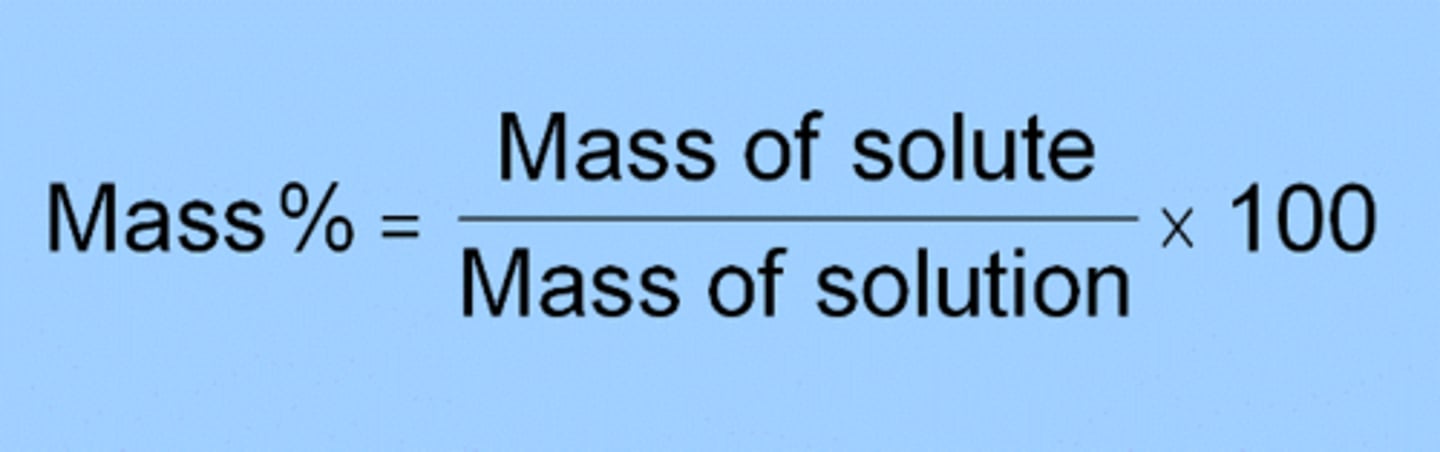
Percent composition
The percent of each element present in a compound
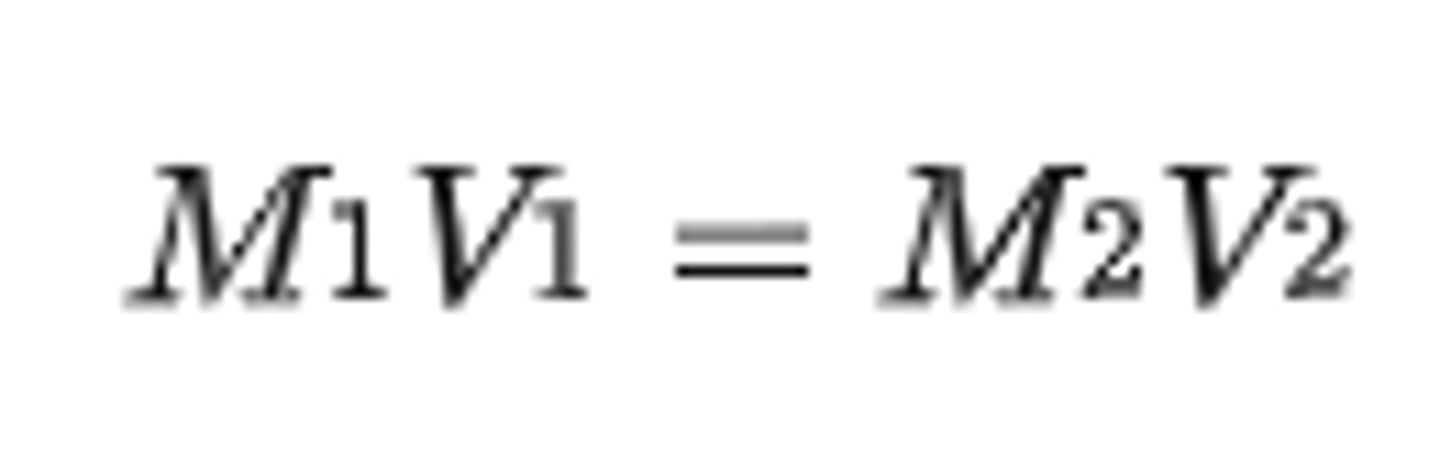
Dilution of Solutions
When preparing a solution of a certain molarity, a reagent is weighted out and dissolved in a volumetric flask.
Diluted for time efficiency and consistency
Moles taken from conc. solution = moles placed in dilute solution
Stoichiometry
used to determine the quantitative relationship between reactants and products in a chemical reaction.
Mole ratio is used to relate the number of moles of any two substances in a reaction
How is a balance chosen?
based on the performance range required.
Top loading vs. analytical balance
for large quantities and approximate weights.
for small quantities and precise weighings.
Weighing errors
- balance not level - check the liquid bubble on the floor of the weighing chamber
-balance pan is dirty
-air current/draft = close ALL windows on the balance
-fingerprints (can transfer 0.3-0.5 mg) - use finger clots or folded paper
-static charge - use an anti-static brush prior to weighing
-Beaker + sample must be at ambient temperature
-beaker + sample must be dry
Weighing by addition
the standard procedure
- weigh container = W1
add sample to container
weigh container and sample = W2
Wsample= W2-W1
Weighing by difference
For hydroscopic compounds and multiple weighings.
-tare
weigh sealed bottle of hydro agent = W1
Quantitatively transfer reagent from bottle to beaker
reweigh sealed bottle = W2
W sample = W1-W2
What are the differences between weighing by addition vs. difference?
Addition:
2n weighings for n samples
Difference:
req n+1 weighings for n samples
Buoyancy effect
Buoyancy: upward force on an object in a liquid or gaseous fluid
Archimedes principle: an object in fluid will experience a loss in weight = weight of fluid it displaces
balances are calibrated with dense, steel weights
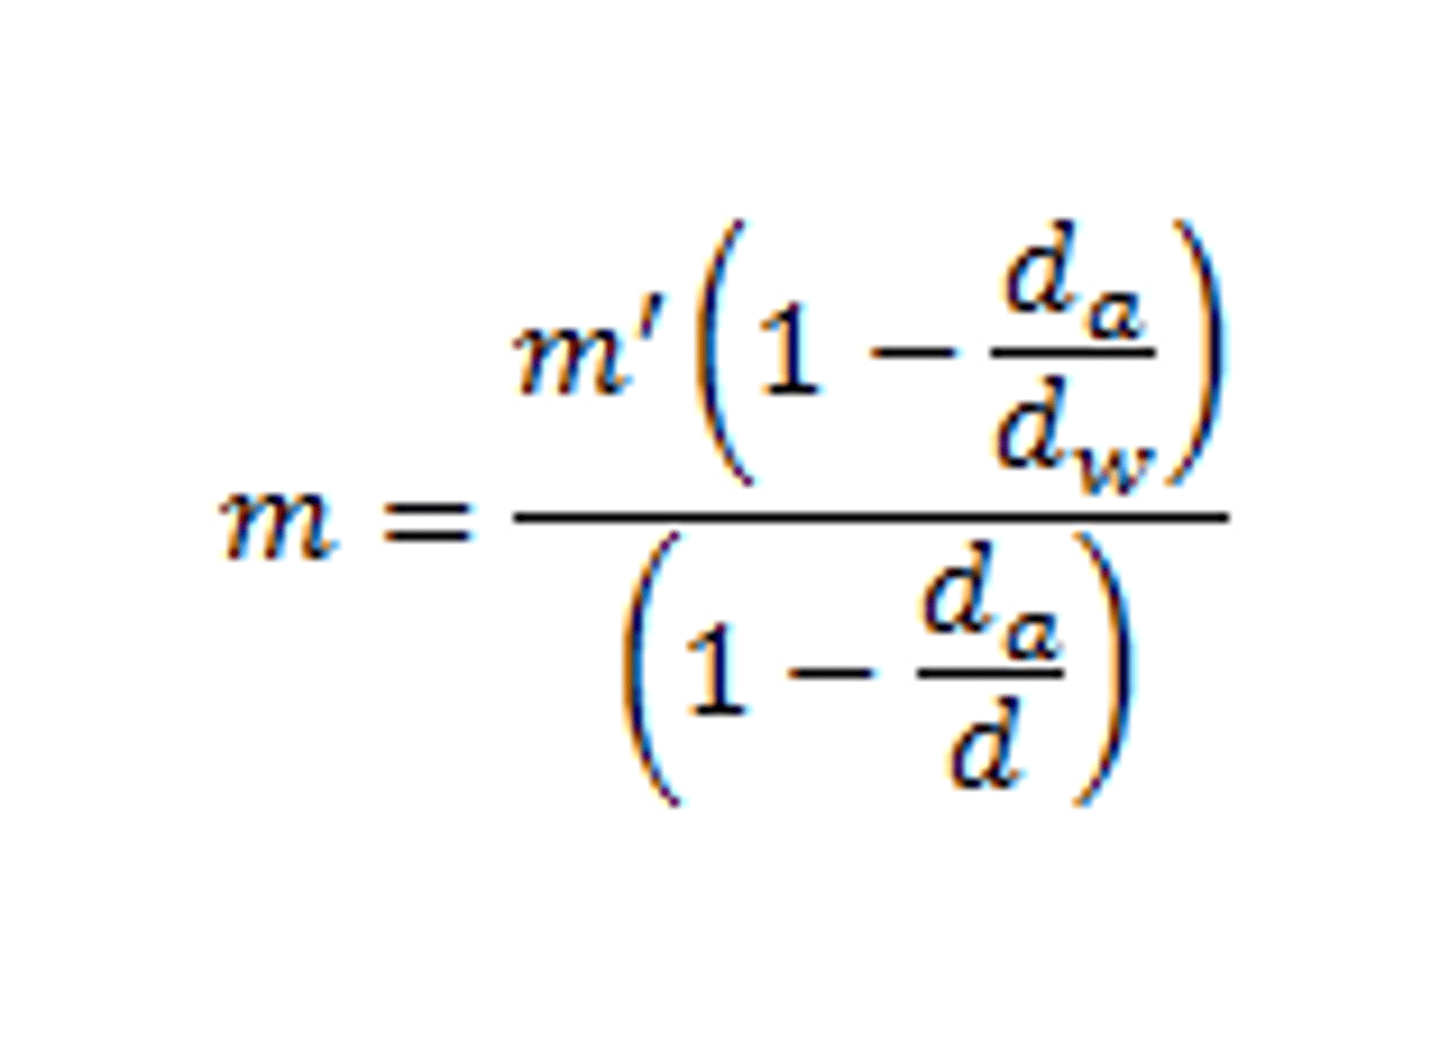
Buoyancy error
errors develop when weighing objects of a significantly different density. Density of liquids is much lower than the density of steel weights
m=true mass
m1=observed mass
da=density of air = 0.0012g/ml @ 1 bar, 25C
dw = density of sstandard steel weight = 8.0g.mL
ds = density of sample
Volumetric Flask
type of flask that has been calibrated to contain a precise volume at a certain temperature
How to use a volumetric flask
- add components of solution, fill 1/3, and swirl
- fill close to final volume and mix again
= carefully adjust to final volume use a medicine dropper so meniscus is even with calibration line
-cap firmly, invert, and swirl flask several times
Pipet
delivers fixed volumes of liquid
- labeled TD (to deliver)
- more accurate and precise than a buret
What are the three types of pipets?
1. volumetric
2. Mohr pipet
3. Micropipet
Buret
delivers variable volumes
less accurate than pipet
What is parallax error?
reading the meniscus right
Sig figs
minimum number of digits in a value/measurement necessary to reflect its precision. higher sig figs = higher precision and less uncertainty
Experimental error
every measurement we make has some level of uncertainty to it
Systematic error
determinate, reproducible. due to poor technique, faulty calibration, poor experimental design. Controls accuracy of measurement
Random error
indeterminate, non-reproducible
errors are distributed about a mean value
easily treated with statistical methods
Controls the precision of a measurement
Certified reference materials (CRMs)
used to assess the accuracy of analyticaal procedure, calibrate instruments, and check product quality
Uncertainty vs. error
error is the difference between a measurement and the true value
uncertainty is the range where the true value could be within
What are the 3 types of uncertainty?
1. Absolute uncertainty (delta y): the margin of uncertainty associated with a measurement
2. Relative uncertainty (delta y/y): compares the absolute uncertainty with the measurement itself
3. % relative uncertainty : delta y/y expressed as a percentage
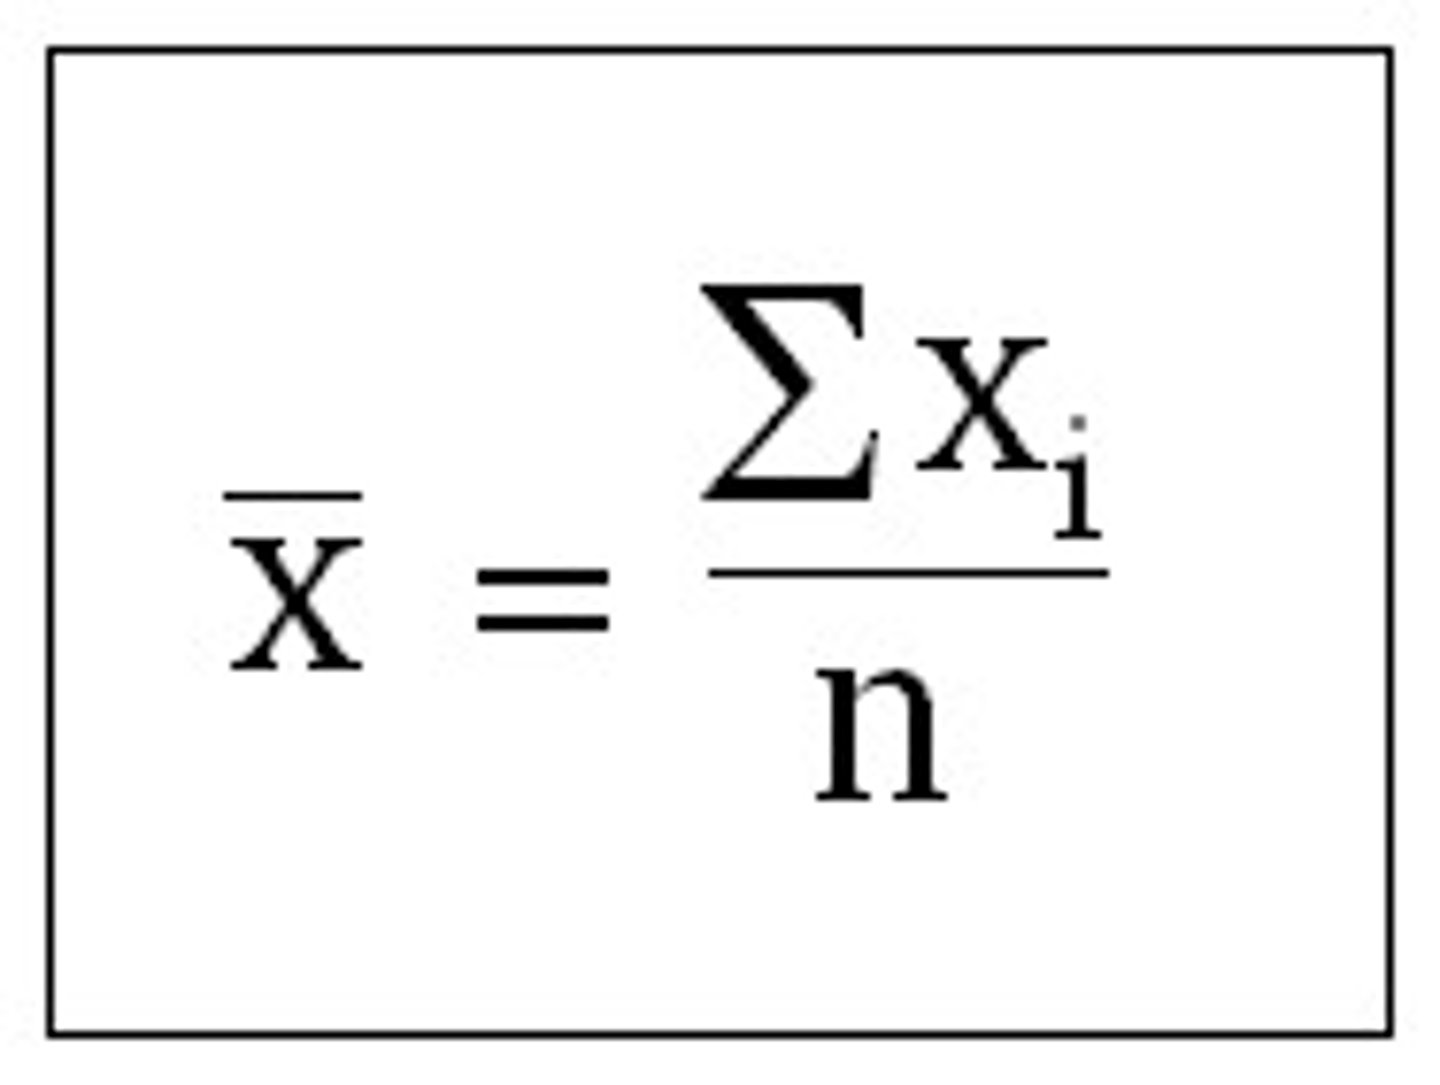
Mean
average value
reporting the mean is most useful when the variation between replicate measurements are small and randomly distributed
Standard deviation
used to describe the scatter in data set.
Useful when scatter is random
estimates absolute error
smaller SD --> higher precision
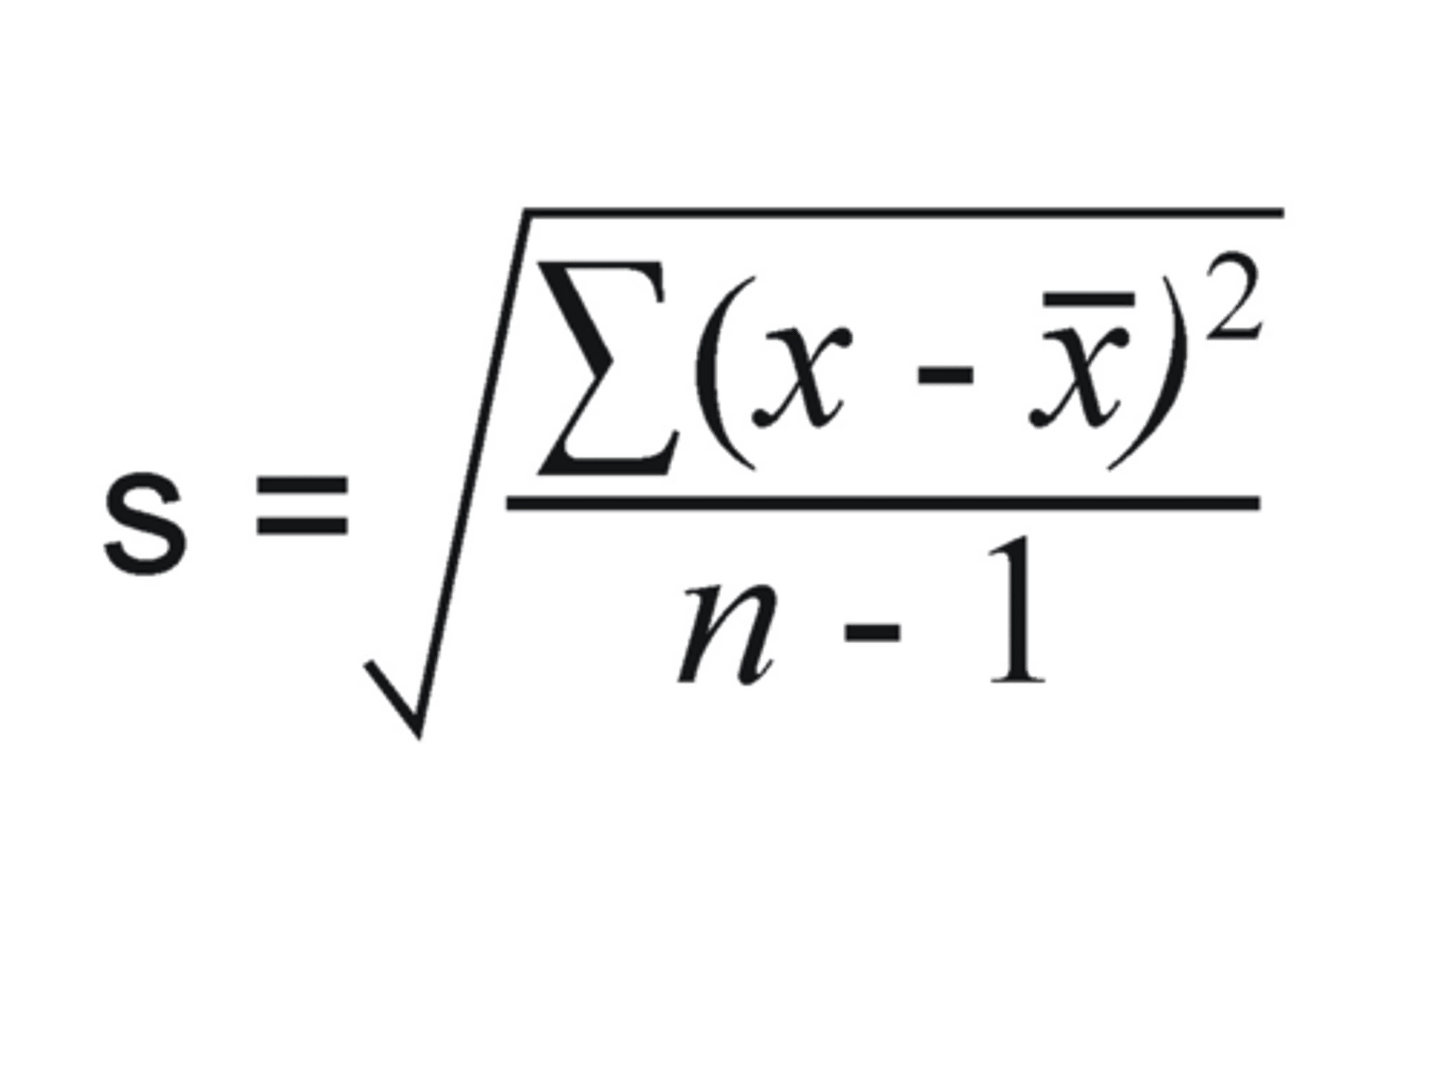
Degrees of freedom (DF)
indicates the number of measurement values that went into calculating the estimated error
DF= n-1
Relative standard deviation
used to show whether the SD is small or large compared to the mean
often expressed as %, ppm, etc
x +/- RSD
RSD= SD/mean
Median
middle value in a data set that has been arranged in order of size. Most useful when there is an outlier.
Median is less affected by outliers than mean.
also useful for small data sets with large scatter
Range
difference between the highest and lowest values in a dataset
Mean vs median
Mean-
statistically the most valid measure
data uniformly distributed around the mean
Median-
useful for small data sets with considerable scatter
less affected by outliers
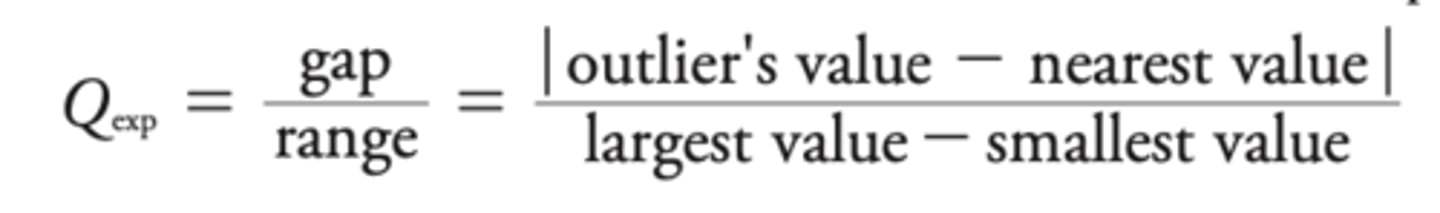
Q Test
Qobs is compared to Qtab
Qobs>Qtab can reject the data point
Qobs
Grubbs Test
similar to Q test but uses the mean and standard deviation in its calculation
Gobs>Gtab can reject data point
- must report the mean +/- SD
Gobs
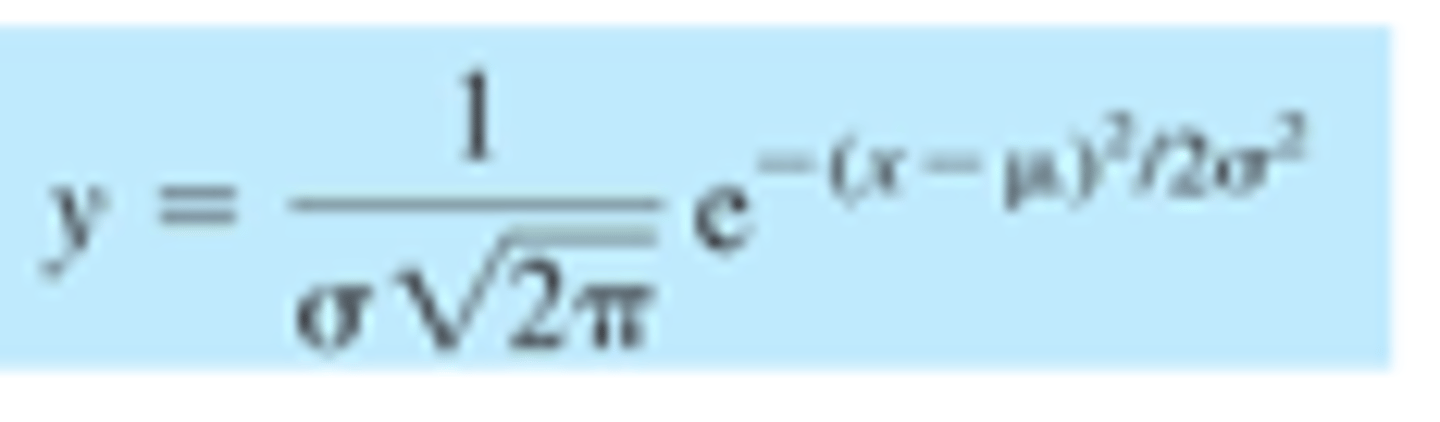
Gaussian Curve
represents the normal distribution of independent, random variables around a mean
random errors behave under Gaussian/normal statistics
Hypothesis tests
Null hypothesis: there is no effect in the population
Alternative hypothesis: an effect in the population; what we are testing.
A test is calculated from the sample mean or proportion
two-tailed test
non-directional
tests for effects on the sample mean in either direction. Does not tell you which direction, only that the sample mean does not equal target value
one-tailed test
directional
tests effects on the sample mean in one direction from the target value
used when you have a preconceived reason to believe that a method gives systematically low values or high values
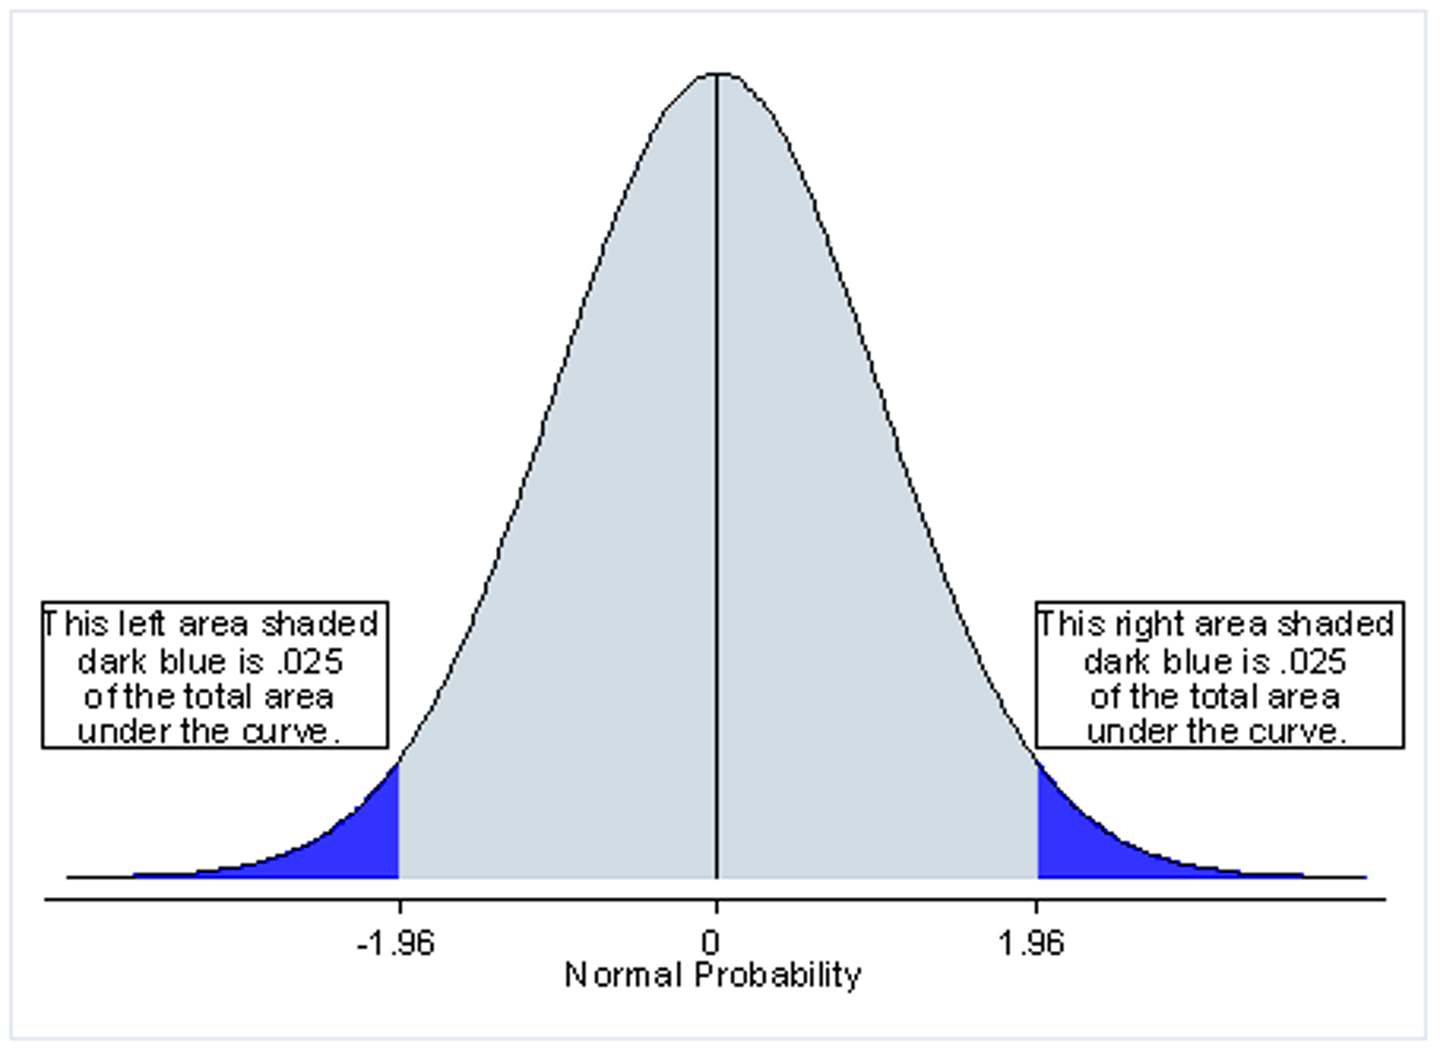
Confidence intervals
the range around the observed mean in which you expect the true mean to be within, at a certain probability
t-Tests and different types
used to compare to sets of measurements by their mean
1. comparison of measured mean to a known standard value - one-sample
2. camparing two measured means - two sample
3. comparing the means of two methods - paired t-test
One sample t-test
used to check if chosen method is acceptable for intended analysis
tcalc < ttab = values are not significantly different
tcalc>ttab = values are different within the confidence limit selected
tcalc = |mean-known value|/s times square root of n
Two sample t-test
determines whether two sets of replicate measures give the same or different results within a certain confidence level.
DF= (n1+n2-2)
tcalc
F-test
used to compare two or more sets of measurements by their variance = SD
larger SD is always the numerator so F greater than or equal to 1
Calibration curve
shows relationship between the instrument and the analyte
- constructed by measuring the resonse of standards(has a known analyte)
-used to interpolate unknown (analyte) in a sample
In linear range, reponse is proportional to analyte
dynamic range
concentration range over which there is measurable response, even if response is not linear
Constructing a calibration curve
1. Prep blank (without analyte)
2. Prep standards
3. measure the blank and standards
4. Plot calibration curve
What are the best practices when making a calibration curve?
- use at least 6 concentrations and 2 replicates
- visually inspect for outliers before drawing a best fit line
Advantages and disadvantages of using graphical method to find a best fit line
advantage: by visually inspecting data, it becomes obvious if the data falls on a straight line
disadvantage: line is drawn by "eye", a subjective process leading to imprecision in interpretation of data
Advantages and disadvantages of using method of least squares to find best fit line
Advantage: the method is objective and without systematic bias hence more used than graphical method
Disadvantage: the method is accurate only if the data truly fall on a straight line.
-best to cross-check the least squares method results with the graphical approach.
What are some assumptions on the Method of Least Squares?
a. linear relationship
b. Error in y is substantially greater than in x
c. uncertainties in y value are similar
d. any error in y is due to measurement (random error)
Method of Least Squares
goal is to minimize the vertical deviation between the data points and the best fit line