Linear and Multiple Regression
1/43
There's no tags or description
Looks like no tags are added yet.
Name | Mastery | Learn | Test | Matching | Spaced | Call with Kai |
|---|
No analytics yet
Send a link to your students to track their progress
44 Terms
What is the definition of a linear regression?
predicting a score on one variable using another variable
Y’
is the predicted score
value of x
the values of one or more variable that predicts the Y’
Model of a Linear Regresson
Y’ = intercept + Value of X + error
the most basic model would
have no predictor variables
predictors are variables that are used to
improve the accuracy of the predicted value
information in the regression output tell us
how well your whole model can predict scores on the outcome
whether, and how much, each of your predictors improves the accuracy of predicting the outcome
Regression assumptions
Each measurement in the sample is independent
The variables are normally distributed (larger samples are good)
The predictors are linearly related to the outcome (linearity)
The variances of the residuals (fancy name for model “error”) are random (homoscedasticity of residuals)
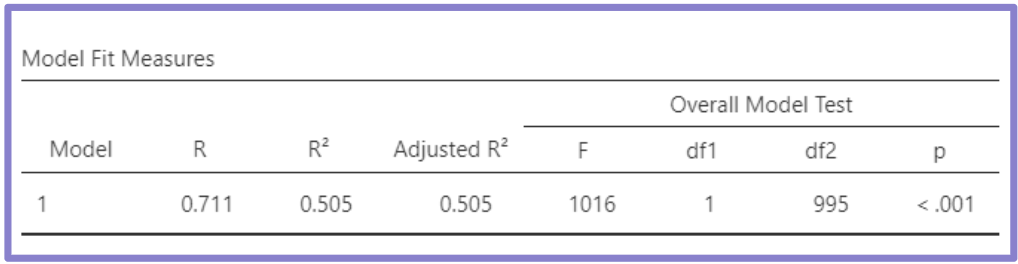
what does this box tell us?
how good your model is at predicting the outcome
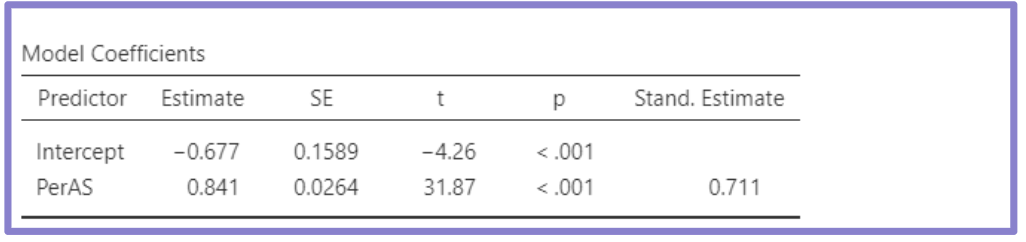
what does this box tell us?
how much each predictor contributes to your prediction
R
is like a correlation but for everything in the regression model
R²
is the amount of variance in the outcome that is explained by the regression model. It is on a 0-1 scale, 0=0%, 1=100%
Adjusted R²
is a correction of R² when adding more than one predictor
What is and how do you calculate error?
Is the amount of variance not explained by our model. Calculated by 1-R²
Variance Explained
After modelling the covariance of the predictor(s)and the outcome, how much variance in the outcome is known.
Model Error
After modelling the covariance of the predictor(s) and the outcome, how much variance in the outcome is left over
Dependent Variable
the outcome in experimental models
Independent variables
measured predictors in experimental models
Covariates
predictors that are controls in experimental models
Intercept (Box 2)
Where the regression slope crosses the y-axis in the equation. The value of the outcome when all predictors have a value of zero (“held constant”).
[Unstandardized] Estimate (Box 2, second line)
“B”. The amount of change in the outcome associated with a one-unit change in the predictor variable. For every one-unit increase in a person rating another person as being as being attractive (on the 1 – 10 scale), our model predicts that their romantic interest should increase by .84 units.
t an p (box 2, second line)
test whether the estimate for this predictor is significantly different from zero.
Standardized Estimate
β, The amount of standard deviation unit change in the outcome associated with one standard deviation unit change in the predictor variable. This is an effect size for the predictor because it is on a standardized scale (just like a correlation).
In APA format
report, line under intercept. B, SE, β, t, p.
APA results, what number goes in intercept in equation
intercept estimate
In APA results, what number goes in Values of X in equation
X*estimate of line below intercept
p
below .05 is statistically significant
β
when close to zero very little practical effect. .1 - small effect, .3 - moderate effect, .5 large effect. β is like cohens effect size
how do you know if The predictors are linearly related to the outcome (linearity)
put things on scatterplot and make sure we have a good linear relationship
how do you know if The variances of the residuals (fancy name for model “error”) are random (homoscedasticity of residuals)
the wrongness of our model is not biased in particular direction
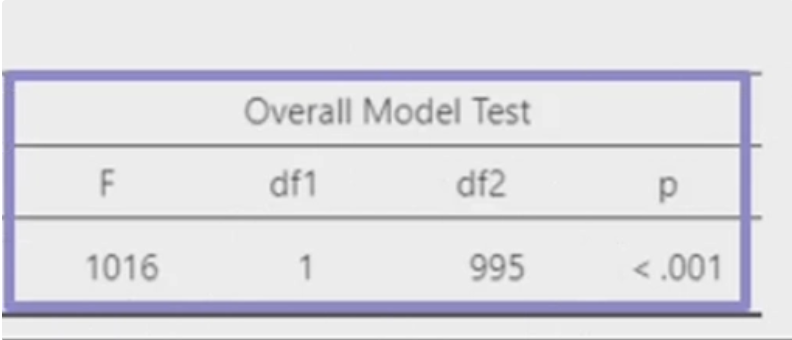
what does this box refer to?
refer to variance explained. does your model explain significant variance in your outcome compared to chance? is the amount of variance explained (r^2) statistically different from explaining zero variance
multiple regression
predicting a score on one variable using more than one variable
how to know if a linear or multiple regression found evidence for a relationship
DON’T look at intercept p-value
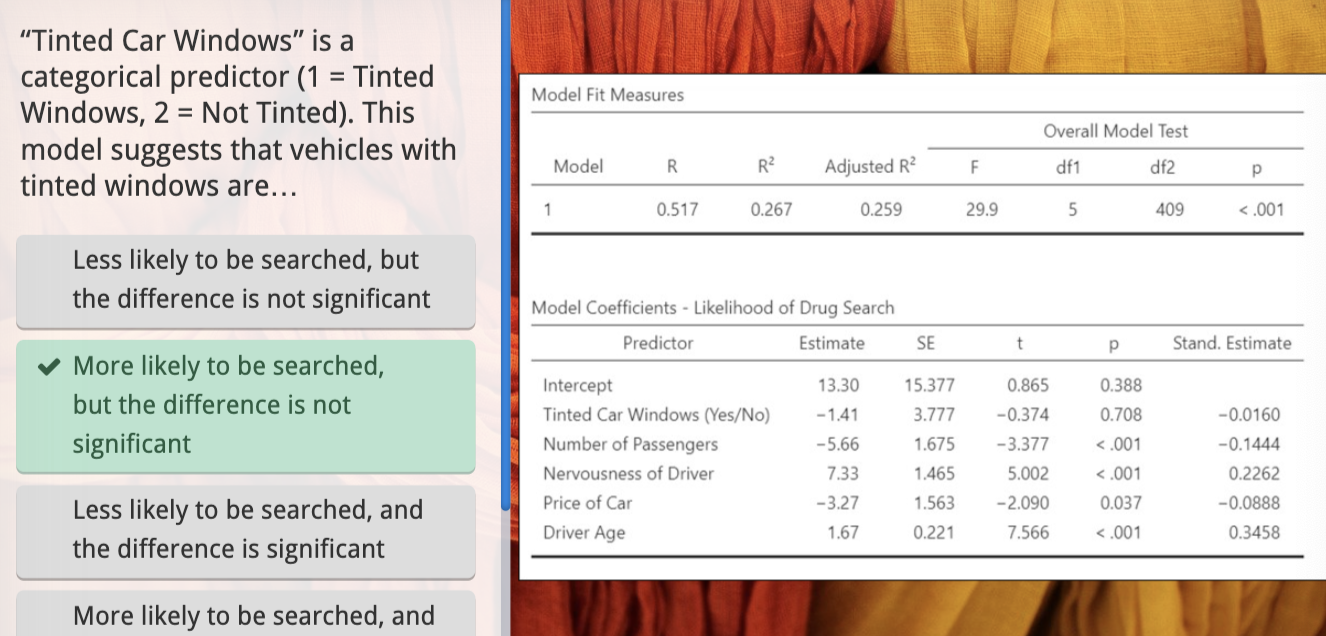
how would you answer this?
multiply the number by the estimate. which ever is lower is more likely, higher is less likely
in a linear regression with just agreeableness it can not be sig, but a multiple regression with agreeableness and another can be sig because
the association now controls for the other variable
regression to the mean
is not predictive
in multiple regression, predictors have to
explain unique variance in the outcome. (Predictors are significant only when they explain variance that is not explained by other predictors)
what kind of variables go into regression models?
categorical variables with only two groups
when comparing different predictors in multiple regression where do we look?
standardized estimate because all numbers are on the same scale.
when judging effect sizes what can you ignore?
whether it is negative or positive
regression to the mean
If you measure a thing more than once, it is more probable that the next measurement will be closer to the true mean than it is to be further away from the true mean.
regression to the mean is a ____ phenomenon which means
it is not causal and is separate to actual changes over time. this expectation is over repeated measures but has no predictive use for an individual measurement.
there is greater regression to the mean when
measurements are extreme and/or when the variables are less correlated