AQA A level Bio 4.6 Biodiversity within a Community
1/9
Earn XP
Description and Tags
Name | Mastery | Learn | Test | Matching | Spaced | Call with Kai |
|---|
No analytics yet
Send a link to your students to track their progress
10 Terms
A meadow is an area of grassland with a wide range of plant and animal species. A student investigated whether cutting some of the plants in a meadow had any effect on the biodiversity of insects in that meadow.
The student created two sample areas, called plots, in the meadow. Each plot measured 10 m × 5 m The student:
• did not cut plants in plot 1
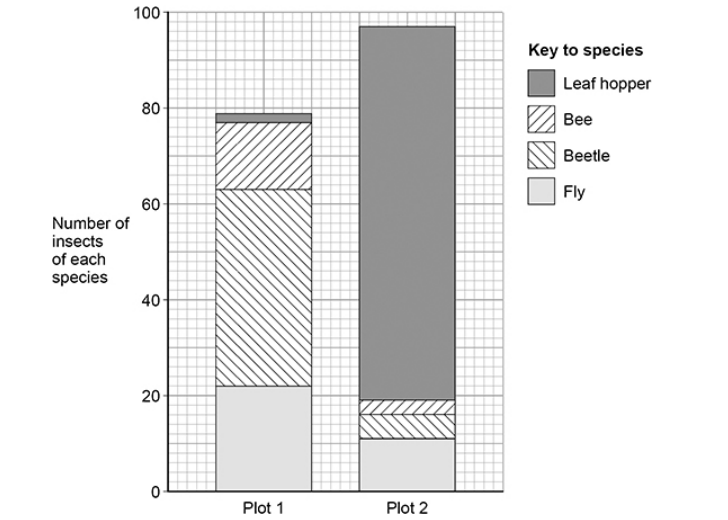
• cut the plants in plot 2 with a lawn mower once a week. After 10 weeks, the student captured all of the organisms of four insect species found in each of these plots. The figure below shows the student’s results.
The student concluded that cutting plants with a lawn mower increased the species richness of insects in that meadow. Use information in the diagram above to explain why the student’s conclusion is incorrect. (1)
Same number of (different) species (in both plots) (1)
Explain why it is more useful to calculate an index of diversity than to record species richness.(2)
(Index of diversity also) measures abundance / number / population (size) of each species (1)
(So useful because) may be few of other species (1)
Suggest how the scientist measured the rate of water flow in the river. (1)
Movement of (floating) object over known distance and over given time (1)
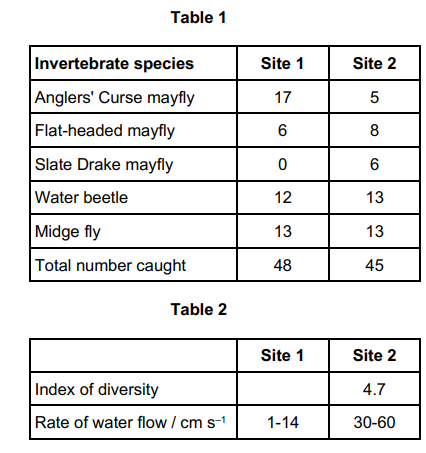
A scientist identified and counted the invertebrate species present in samples taken at two sites in a river. The scientist also measured the rate of water flow at each site.
His results are shown in Table 1 and Table 2.
Use information in Table 1 and Table 2 to suggest and explain a reason for the difference in the numbers of Slate Drake mayfly at these sites in this river. (2)
Less food/prey at site 1 (1)
(So more) mayfly starve (1)
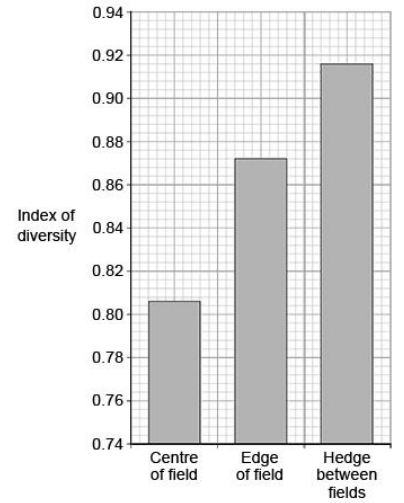
A group of students investigated biodiversity of different areas of farmland.
They collected data in each of these habitats:
• the centre of a field
• the edge of a field
• a hedge between fields.
Their results are shown in the graph.
What data would the students need to collect to calculate their index of diversity in each habitat? Do not include apparatus used for species sampling in your answer. (1)
(Number of species and) number of individuals in each species (in each habitat) (1)

A group of students investigated biodiversity of different areas of farmland.
They collected data in each of these habitats:
• the centre of a field
• the edge of a field
• a hedge between fields.
Their results are shown in the graph.
Modern farming techniques have led to larger fields and the removal of hedges between fields.
Use the graph above to suggest why biodiversity decreases when farmers use larger fields. (1)
(Larger fields have relatively) More centre OR less edge OR fewer species (1)
Farmers are now being encouraged to replant hedges on their land.
Suggest and explain one advantage and one disadvantage to a farmer of replanting hedges on her farmland. (2)
Advantage - Greater (bio)diversity so increase in predators of pests (1)
Disadvantage - Increase pest population so less yield/less income/(more) need for pesticides/(more) damage to crops (1)
What is meant by ‘species richness’? (1)
(A measure of) the number of (different) species in a community (1)

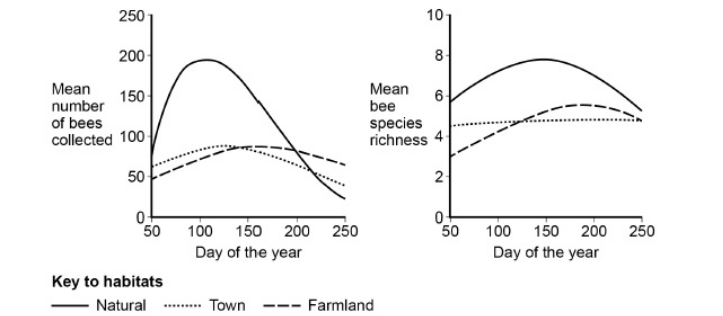
Bees are flying insects that feed on nectar made in flowers. There are many different species of bee. Scientists investigated how biodiversity of bees varied in three different habitats during a year. They collected bees from eight sites of each habitat four times per year for three years. The scientists’ results are shown below in the graphs in the form they presented them.
The scientists collected bees using a method that was ethical and allowed them to identify accurately the species to which each belonged.
In each case, suggest one consideration the scientists had taken into account to make sure their method 1. was ethical. 2. allowed them to identify accurately the species to which each belonged (2)
Must allow the bee to be released unchanged (1)
Must allow close examination (1)
Bees are flying insects that feed on nectar made in flowers. There are many different species of bee. Scientists investigated how biodiversity of bees varied in three different habitats during a year. They collected bees from eight sites of each habitat four times per year for three years. The scientists’ results are shown below in the graphs in the form they presented them.
Suggest and explain two ways in which the scientists could have improved the method used for data collection in this investigation. (2)
Collect at more times of the year so more points on graph/better line (of best fit) on graph (1)
Counted number of individuals in each species so that they could calculate index of diversity (1)