Part 2: Consumer behaviour
1/16
Earn XP
Description and Tags
Robs slides: Ordinal approach, Indifference Curves, Budget line
Name | Mastery | Learn | Test | Matching | Spaced | Call with Kai |
|---|
No analytics yet
Send a link to your students to track their progress
17 Terms
What is the ordinal approach
Ranking bundles from first choice to last choice.
Something being second and another thing being fourth doesn’t mean I like the second option twice as much as the fourth one
Key assumptions about preferences
Complete
Transitive
Non-satiety
Complete = can assign a utility value to any and all bundles of goods
Transitive = Orderings are consistent (f Apples ≻ Bananas and Bananas ≻ Pears, then we must have that Apples ≻ Pears)
Non-Satiety= More- Is-better
What is an indifference curve
A curve showing all combinations (two products) for which a consumers utility is indifferent
Indifference map vs Indifference curve
Different IC’S showing different levels of utility and are related by the same two goods
PPF vs IC in terms of opportunity costs
(PPF for the country, IC for an individual)
PPF (maximum possible production combinations of two goods an economy can produce, given available resources and technology)
Objective:how many units of good Y must be sacrificed to produce one more unit of good X.
IC:
Subjective: Consumer is willing to give up one good for another, while maintaining the same satisfaction level.
Increasing utility as you move ____ from the ____
What does the more-is-better approach tell you
Away &origin
The more you consume the happier you get
What are the 3 Main Properties of IC’S
D
Co
Cu
1. are downward-sloping
2. are convex with respect to the origin
3. curves do not cross
Why are ICs ____:
Downward sloping
Convex to the origin ( curve getting flatter horizontally)
Not cross
(Good A= Y axis, Good B=X axis
Represents trade-offs, more of good A, willing to have less of Good B to maintain the same utility; therefore, goods are inversely related
Value of Good A is low because we have a lot of it, meaning I’m willing to give up a lot for one more unit of Good B at a faster rate( MRS), but as my supply of Good A becomes less, my willingness to give them up for Good B slows down
Each curve shows the same level of utility; if they cross different points on the curve will also show “the same level of utility” even though the consumption at the points differ and the utility. Violating the More-is-better rule( slide 16)
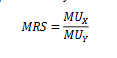
What is MRS:
-In full
-Explain
-Formula (negative slope/positive?)
-When will ICs be steep/shallow (Good A,Y-axis, Good B,X-axis)
Marginal rate of substitution (between two goods)
Rate at which consumer is willing to substitute between two goods
Negative (utility is constant)
Steep: Like Good B a lot, willing to give up gang of good A
Shallow: Like Good A a lot, not willing to give up a lot of B
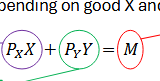
The budget line formula and what assumption do we make
We assume that consumers
spend all their money, hence
the equality in the constraint.
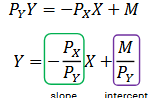
The other Budget line formula that shows the slope
Bundles____ the budget line show:
Above
On
Below
Unaffordable
Affordable and use all consumers income
Affordable but do not use all consumers income
What is MRT:
-In full
-Explain
-Formula
-What does a MRT of 2 tell you for example
Marginal rate of Transformation
How much the consumer MUST sacrifice one good to buy the other (Opportunity cost )
Formula: Slope of budget line -Px/Py
Good B costs more than Good A, I MUST give up 2 units of Good A JUST so i can afford 1 of good B
Main difference between MRS and MRT
MRS- Willing to give up for Utility
MRT-Must give up because of Price( budget)
What causes a SHIFT in Budget Constraint :
Right
Left
And what stays constant
A change in INCOME
INCREASE
DECREASE
Price of goods stay constant
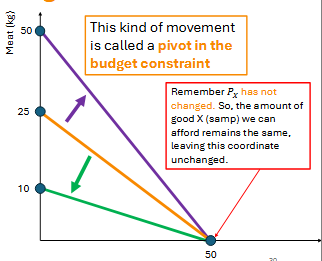
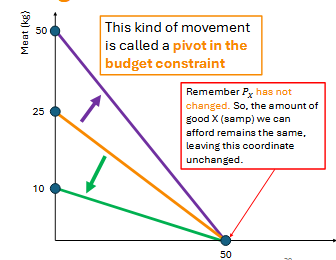
What causes a PIVOT in Budget Constraint :
Right
Left
And what stays constant
Change in PRICE OF GOODS
INCOME stays constant
What causes a PIVOT in Budget Constraint :
Right
Left
And what stays constant
Change in PRICE OF GOODS
INCOME stays constan