Exam 3 Physiology of Exercise 2 / II
1/96
Earn XP
Description and Tags
Professor Bland, Harding University
Name | Mastery | Learn | Test | Matching | Spaced | Call with Kai |
|---|
No analytics yet
Send a link to your students to track their progress
97 Terms
• Exercising into old age an unusual pattern • Natural tendency to be sedentary • Motivating factors? • Primary aging versus comorbidities of age • Cross-sectional versus longitudinal studies • Medical care, diet, lifestyle factors • Selective mortality • Applicability of findings to larger aged population?
Exercise extends lifespan
longevity (X) < functionality (Y)
g
g
Reasons why we age
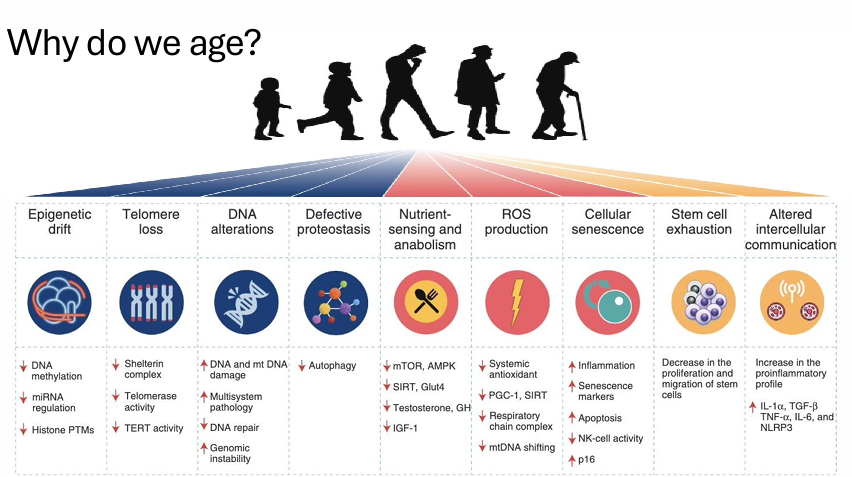
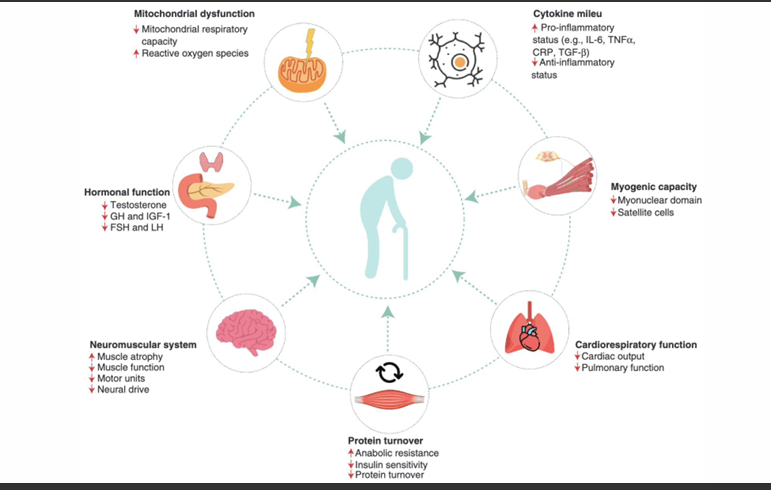
Aging of specific systems *Key Image*
Reactive Oxygen Species: Some is good, more is bad = high oxidative stress = high inflammation = poor recovery and reduced strength
ROS
Reduced exercise in age and protein turnover + immune function
Breen et all 2013: 2 weeks of 1400 steps/day:
insulin sensitivity decreased 43%
leg FFM decreased 4%
TNF-alpha increased by 12%
CRP increased 25%
Neuromuscular Jxn and Age
Decrease surface area (decrease folds)
Decrease Ach reeotors
Decrease Ach pre-synaptic vesicles
Incerased distance of synaptic cleft
Peri-synaptic Schwann Cells migrate into synaptic cleft, disrupting signaling
Mitochondrial dysfunction
Aerobic Fitness
VO2max
declines faster in sedentary (10%/decade) vs active (5-6%/decade) vs elite athletes (3.6% decline over 25 years), 15%/decade for previously active adults. eclines faster after 75 yrs. Mechanisms?:
HR decreases
heart contractility decreases (stiffness)
SV decreases
Peripheral blood flow
10-15% reduction in older individuals (even with exercise)
Lactate threshold
Absolute LT declines, but at a slower rate than relative LT = LT not a good predictor of performance in older adults.
Muscle Fitness
High variability
Mass declines 1-2%/yr, then accelerates after 60
Strength declines 1.5%/yr between 50-60 then 3%/yr >60
Greater type II fiber loss with aging
higher neural threshold needed for firing
Bone
Aging = decline in BMD and structural integrity
Exercise is protective
high impact mechanical loading (more so than medium or low)
Remember muscle-bone cross-talk (myokines and osteokines promote bone remodeling)
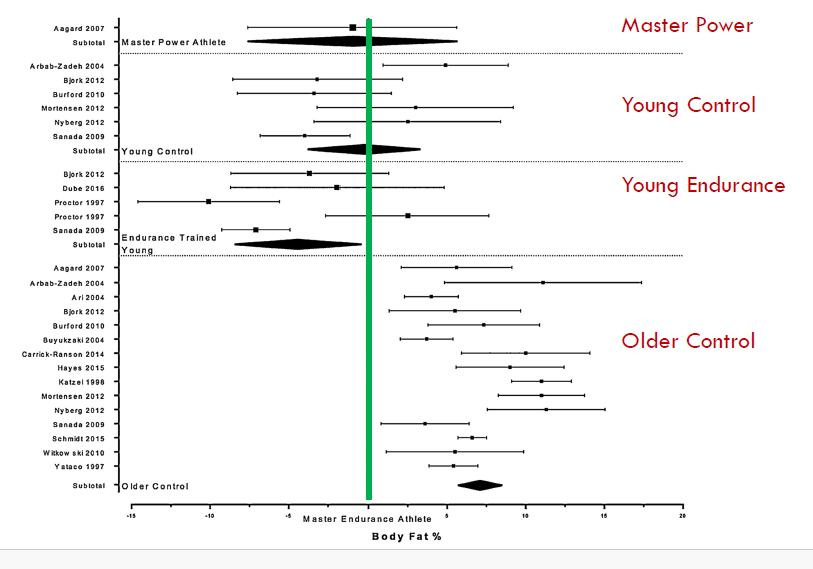
Body Composition
Masters Endurance: 19.7±3.8%
Masters Power: 16.4±4.4%
Older control: 24.5±4.6%
Young Endurance: 15.4±5.2%
Young Strength/Power: 14.1±3.5%
Young Control: 17.4±3.0%
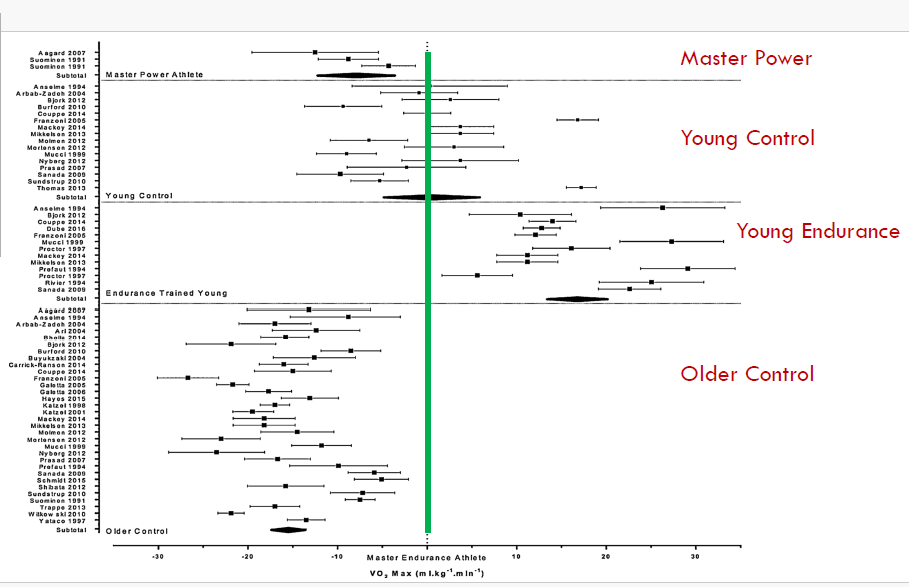
VO2 max
Masters Endurance: 42.0±6.6 mL•kg-1•min-1
Masters Power: 26.5±2.3 mL•kg-1•min-1
Older control: 27.1±4.3 mL•kg-1•min-1
Young Endurance: 60.0±5.4 mL•kg-1•min-1
Young Control: 43.1±6.8 mL•kg-1•min-1
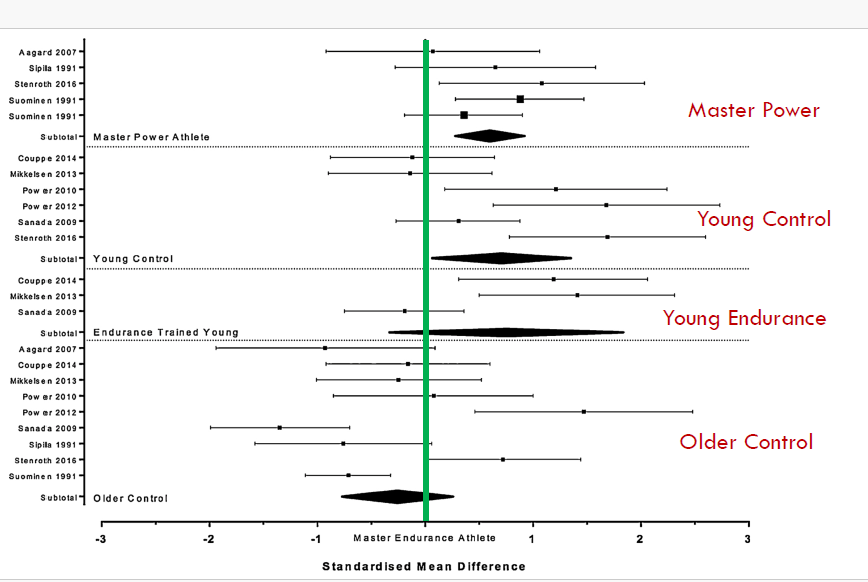
Strength
Difficult to compare MVC with various techniques, thus use “standardized mean difference”
CSA: Not different among MP, ME, OlderC.
Peripheral vs Central Fatigue
Peripheral:
⁃ Internal environment?: Accumulation of protons? Ammonia? Heat?
⁃ Within the muscle?: Pi? SR changes? Inhibition of Ca2+ release? Glycogen/glucose? Decreased conduction velocity?
Central:
⁃ AP blocked? Motor drive? Type III and IV nerve stimulation (stimulate emergency cease response) ?
⁃ Tryptophan/Serotonin/BCAAs? Cytokines? Temperature?
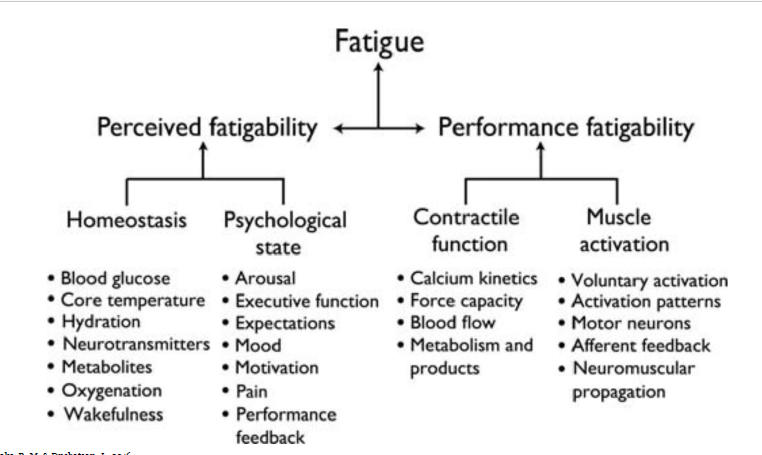
Components of fatigue
“it would be good to remember just one thing in each category”
Functions of Lactate (no need to memorize)
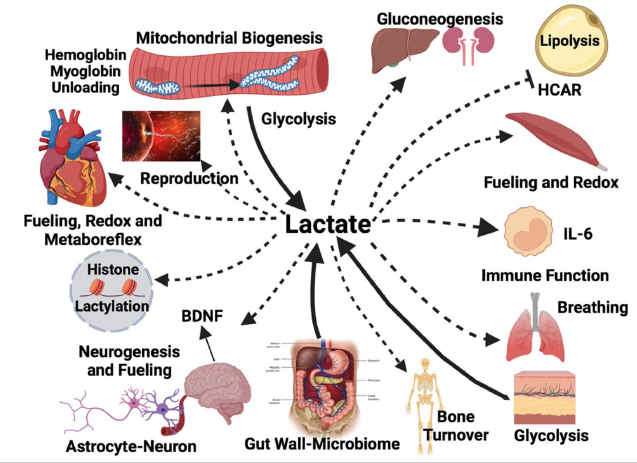
T/F: Lactate causes DOMS
False
T/F: Lactate is responsible for moving H+ to mitochondria to power glycolysis
True, H+ as NADH2
Lactate is what type of functional molecule?
myokine and exerkine
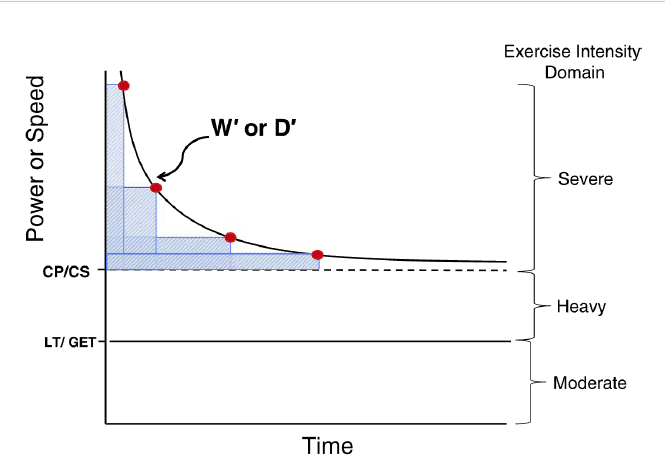
Critical Power = Fatigue Threshold =
The greatest metabolic rate that is powered by the body’s maximum possible oxidative energy provision
max threshold before switching to anaerobic respiration
steady state not possible above CP
Muscle Glycogen
Rapid fuel source – connected with muscle fatigue
Depletion = ↓ATP regeneration and ↓EC coupling
Even after ATP levels are normal – low glycogen impairs function.
May contribute to ↓SR Ca2+ release
*Low fuel status = fatigue?
Glycogen Granule
Metabolically active with regulating proteins and glycolytic enzymes.
Located strategically - subsarcolemmal
Muscle Glycogen Determinants:
○ CHO intake
○ Exercise type
⁃ Eccentric ↓ glycogen synthesis
○ Exercise intensity and duration
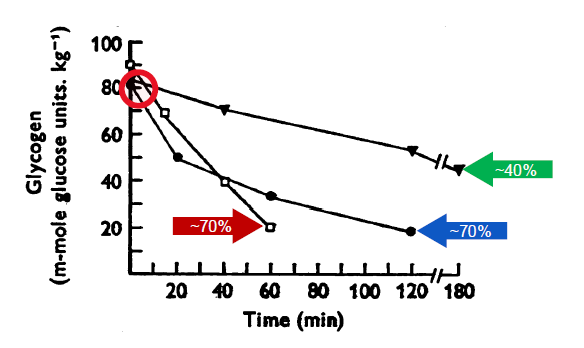
⁃ ~40% loss after 3hrs@~31%VO2max and ~70% loss after 2 and 1hrs @~64 and ~84%VO2max (Gollnick, Piehl, and Saltin, 1974)
⁃ ~39% loss after 6 sets of 12RM leg extension (Robergs, et al. 1991)
⁃ May differ between men and women (Wismann and Willoughby, 2006
Na+/K+ Pumps
Muscle activation results in cellular loss of K+ and increase in Na+
Results in interstitial increase in [K+] and change in Na+ gradient
Impairs muscle force development
Therefore – need to maintain Na+/K+ pumps
Possible role of ROS in Na+/K+ pump function
Thus – possible role of anti-oxidants in fatigue
Fatigue
Trait vs State
o Trait (due to exss load3 during past week)
o State (current exercise state)
Training Impulse (TRIMPS)
Carbohydrates
Muscle Glycogen
Rapid fuel source - connected with muscle fatigue
depletion = decreased atp regeneratioin adn decreased ec coupling
even after atp levels are normal, low glycogen impairs fxn
low fuel status = fatigue?
may contribute to decreased SR Ca2+ release
Glycogen Granule
metabolically active w regulating proteins and glycolytic enzymes
located strategically
Muscle Glycogen
CHO intake
Exercise type
eccentric decreases glycogen synthesis
Exercise intensity and duration
~40% loss after 3hrs @ ~31% VO2max and ~7-% loss after 2+1 hrs @ 68% VO2max
Na+ / K+ pumps
Muscle activation results in cellular loss of K+ and increase in Na+
results in interstitial increase in K+ and change in Na+ gradient: impairs muscle force development
Therefore, need to maintain Na+/K+ pumps
possible role of ROS in pump fxn
Thus, possible role of anti-oxidants in fatigue
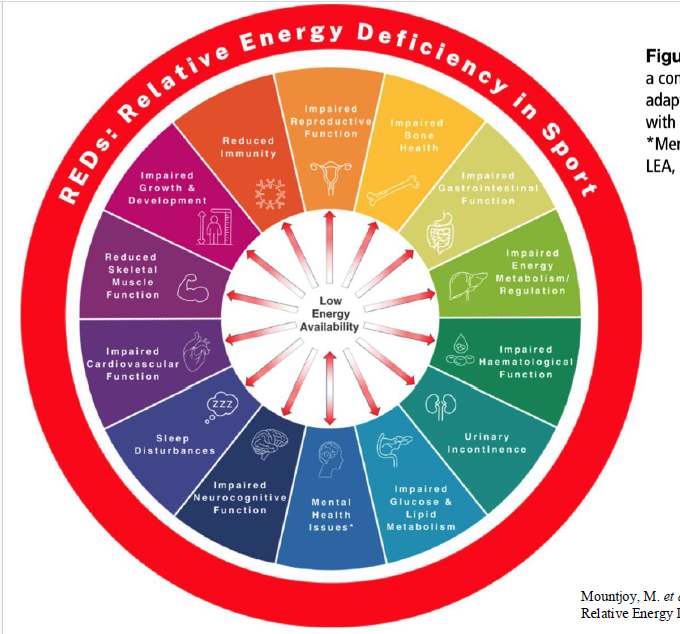
Relative Energy Deficiency in Sports (REDS)
Energy Availability (EA) = Energy available for biological function after energy expenditure by fat-free mass
(Energy Intake – Exercise Energy Expenditure) ÷ Fat Free Mass.
Energy availablilty (EA) of 45 kcals/kg FFM/day = “mantinance”.
power: weight ratio
extreme volumes of exercise
REDS effects
REDs: Low Carbohydrate Availability (LCA)
Impact of not only Low Energy Availability (LEA), but also LCA:
Acute LCA (<6 days) = negative effect on bone, immune system, iron biomarkers
Sometimes even without LEA!
3.5 weeks of LCA elevated IL-6 and impaired bone remodeling.
LCA accelerates REDs outcome
Hydration
Thirst mechanism
Insensitive to hydration status during exercise
Time delay between absorption of water (~20 minutes) to blood and quenching of thirst (seconds)
Performance declines @ ~2-3% loss of body mass
Hydration and Exercise
Impairs aerobic performance.
– temperature → sweat loss → performance
– plasma volume → cardiovascular function
– plasma volume → thermoregulatory function
Effect of dehydration on anaerobic and strength performance is unclear.
Overhydration
Exercise-associated hyponatremia
Low plasma sodium concentration (<135 mmol/L)
Excessive intake of fluids
Water alone vs sports-drinks
Slower absorption
Sodium absorbed into intestinal lumen
Prevalence
Increases with distance running
Highest in swimming
Slower runners