10) data analysis: graphs descptive statistics
1/32
There's no tags or description
Looks like no tags are added yet.
Name | Mastery | Learn | Test | Matching | Spaced | Call with Kai |
|---|
No analytics yet
Send a link to your students to track their progress
33 Terms
What is ‘measure of central tendency’?
The measure of central tendency informs us about the middle value for a set of data
What are the different ways an average can be calculated?
Mean
Median
Mode
what is a pro of the mean?
It makes use of the values of all the data
What are the cons of the mean?
The mean can be misrepresentative of the data as a whole if there are extreme values
It cannot be used with nominal data
What is nominal data?
Nominal data is data that is categorised into named groups or labels, where the categories cannot be ordered or ranked. eg eye colour
what is the median?
The median is the middle value in an ordered list
What are the pros of the median?
not effected by extreme scores
Not as ‘sensitive’ as the mean because not all values are reflected in the median
What is the mode?
The mode is the value that is most common
What is the mode useful for?
The mode is useful when the data is in categories, eg nomina data
What is a con of the mode?
Not a useful way of describing data when there are several modes
What can be used to measure dispersion?
The range
Why can finding the range of a data set be useful?
It can be useful because it provides you with direct information: how varied or consistent the results are.
What are disadvantages of the range?
It only uses the highest and lowest values, ignoring the rest of the data.
It can be strongly affected by extreme values (outliers).
It does not give detailed information about the overall spread of the data.
What is standard deviation?
Standard deviation is a measure of how much the values in a data set deviate (spread) from the mean.
What are the advantages of using standard deviation?
More precise measure of dispersion because all values are considered
What are the disadvantages of standard deviation?
difficult to calculate
Sensitive to outliers
what does the height of the bar in bar charts represent?
The frequency
What are bar charts most suitable for?
Data that is continuous such as nominal data (data set out in distinct categories)
What does the space between bars in bar chart represent?
The lack of continuity
What must the area within a bar in a histogram be proportional too?
The area of each bar must be proportional to the frequency of that category or class.
What must the horizontal axis be in a histogram?
The horizontal axis must represent the continuous, quantitative variable being measured, divided into equal or specified class intervals.
Why do the bars in histogram touch each other?
To show continuity
What does the y axis represent in a line graph?
Frequency
What must the values along the c axis be in a line graph?
Continuous
When is a scatter graph used?
When doing a correlational analysis
What is a normal distribution?
A normal distribution is a bell-shaped, symmetrical distribution where most values are clustered around the mean, and frequencies decrease evenly toward the extremes.
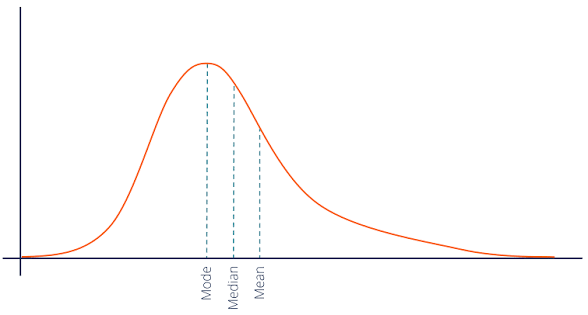
What is a positive skew?
A positive skew is where most of the distribution is concentrated towards the left of the graph
How are the mode, mean and median arranged in a positive skew?
Mode → median → mean
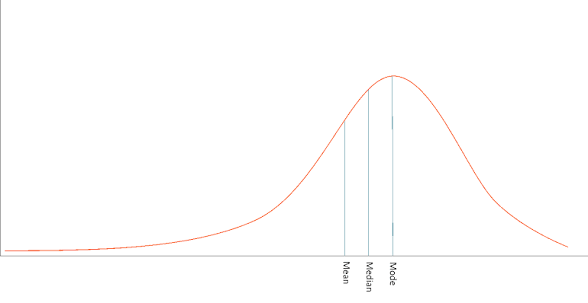
What is a negative skew?
A negative skew is where most of the distribution is concentrated towards the right of the graph
How are mode, mean and median arranged in a negative skew?
Mean → median → mode
Example of positive skew
Example of negative skew