Cell Bio Exam 4 Final
1/122
There's no tags or description
Looks like no tags are added yet.
Name | Mastery | Learn | Test | Matching | Spaced | Call with Kai |
|---|
No analytics yet
Send a link to your students to track their progress
123 Terms
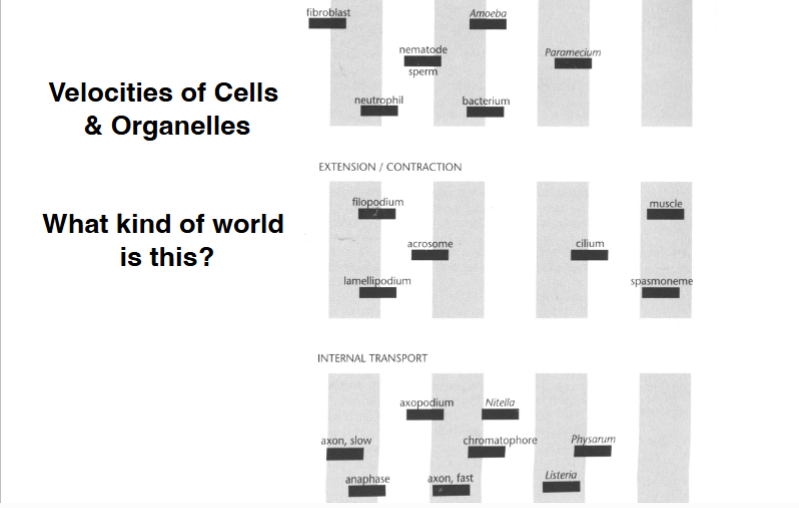
Comparative Speeds of Cell Motility
Different mechanisms of cell movement operate at vastly different speeds. These numbers are not required to be memorized, but they illustrate the range:
• Crawling fibroblast: ~0.01 µm/second
• Growing lamellipodium: slightly faster
• Crawling amoeba: ~10 µm/second (3 orders of magnitude faster than a fibroblast)
• Listeria-driven movement: 100–1,000 µm/second
• Muscle contraction: >10,000 µm/second
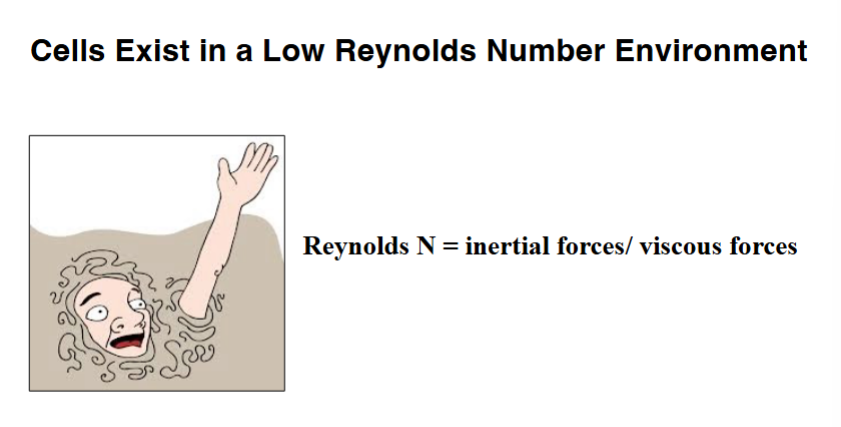
The Physical World of a Cell: Low Reynolds Number
To understand how cilia and flagella work, it is necessary to appreciate the physical environment that cells inhabit.
Newton's first law of motion (the law of inertia) states that an object in motion remains in motion unless acted upon by an external force. For macroscopic objects in low-friction environments, inertia is dominant. Cells, however, behave very differently: when a cell's energy supply is cut off, it stops moving almost immediately, with essentially no coasting. This tells us that inertial forces are negligible in the cell's world.
Cells live in fluid environments that exert viscous drag on any moving object. The Reynolds number is a dimensionless ratio that compares inertial forces to viscous forces in a given environment. Cells exist in a very low Reynolds number environment — viscous forces dominate. The equivalent experience for a human would be trying to swim through a pool filled with molasses. Every stroke requires effort, and the moment you stop, you stop. Cilia and flagella have evolved specifically to generate propulsive force in this kind of high-viscosity, low-inertia environment.
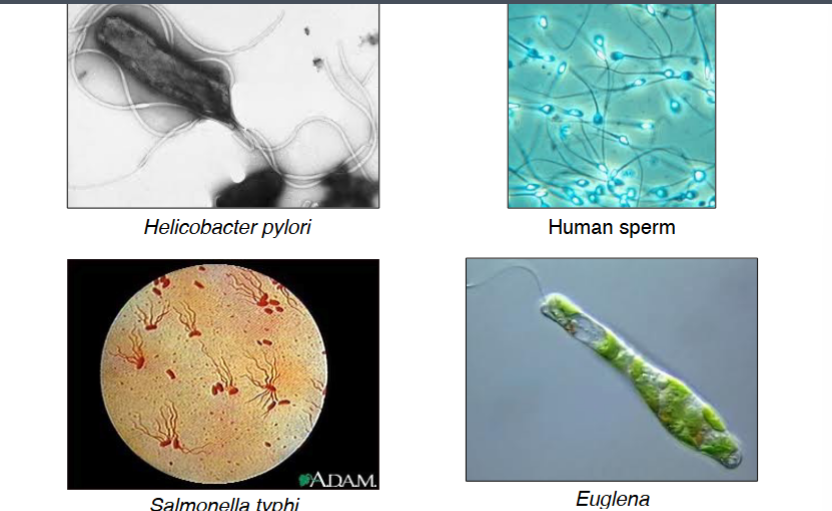
Flagella: Same Name, Different Structures
Cells that swim rather than crawl — such as protists like Euglena, sperm cells, and bacteria such as Helicobacter pylori and Salmonella — use flagella for propulsion. Despite sharing the same name, eukaryotic flagella and bacterial flagella are structurally and mechanistically completely different. Both propel a cell through a viscous environment, but the underlying molecular machinery has nothing in common. This distinction will be a major focus of the next lecture.
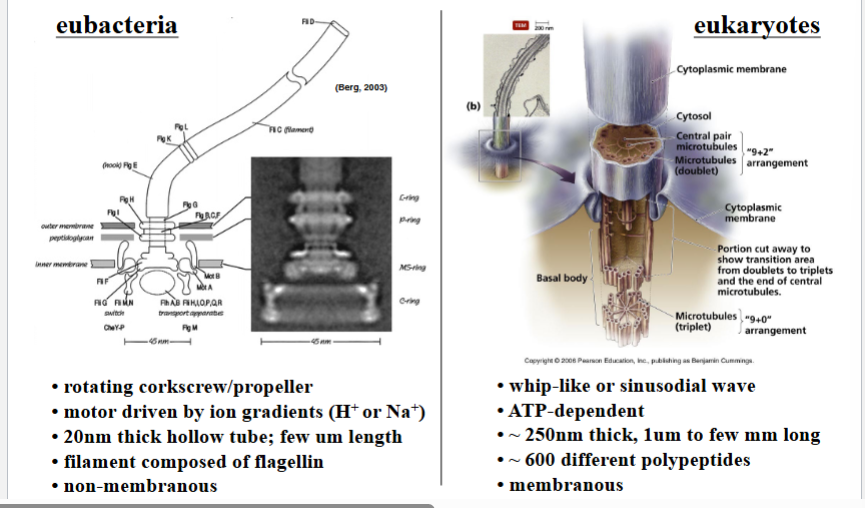
Prokaryotic vs. Eukaryotic Flagella
Both prokaryotes and eukaryotes possess flagella, and in both cases the flagellum functions to move the cell through its environment. Despite sharing the same name and the same general purpose, these structures are fundamentally different at the molecular and structural level — a classic example of convergent evolution where the same function is achieved through entirely different molecular machinery.
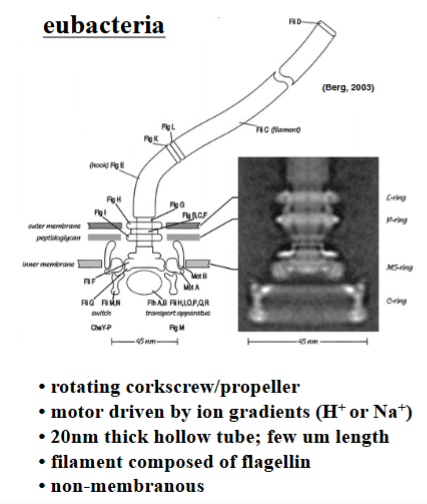
Eubacterial Flagella
Composed entirely of a single protein called flagellin.
• Structured as a hollow tube, approximately 20 nanometers in diameter, extending one or more micrometers from the cell surface.
• The flagellum is not surrounded by the cell membrane — the membrane stops at the cell surface, and the flagellum protrudes as a naked protein polymer.
• Movement is driven by a large multi-protein motor complex embedded in the bacterial membrane. This motor rotates the flagellum like an airplane propeller or corkscrew.
• The rotation speed is extraordinary: 10^4 to 10^5 revolutions per minute (up to 100,000 RPM).
• Energy does not come from ATP. Instead, the motor is powered by the downhill movement of ions — primarily protons (H+) or sodium ions (Na+) — across the bacterial membrane. The free energy released from this ion gradient drives the rotational motion.
• The flagellum grows by adding flagellin subunits synthesized inside the cell, which travel through the hollow interior of the tube and are incorporated at the distal tip.
Archaeal Flagella
Archaea have also been observed with flagella, but far less is known about these structures.
• Archaeal cells move much more slowly than eubacteria — roughly two orders of magnitude slower, at approximately 1–2 micrometers per second compared to ~100 micrometers per second in eubacteria.
• The protein composition and precise structural details of archaeal flagella remain active areas of investigation.
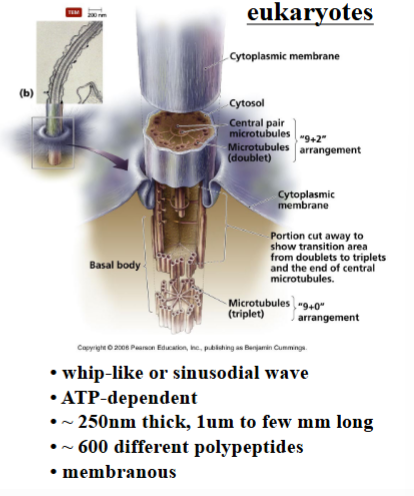
Eukaryotic Flagella: Structure and Composition
The eukaryotic flagellum is an entirely different structure from its prokaryotic counterpart. It is larger, more complex, and powered by a completely different mechanism.
Basic Structural Features
• Approximately 250 nanometers thick — significantly wider than the bacterial flagellum.
• Can range from about 1 micrometer to tens of micrometers in length. In some Drosophila (fruit fly) species, the sperm flagellum is millimeters long — longer than the entire organism.
• Composed of over 600 different polypeptides, making it a highly complex macromolecular structure.
• Unlike the bacterial version, the eukaryotic flagellum is a membrane-bounded organelle. The plasma membrane of the cell extends along the full length of the flagellum. This is visible in electron micrographs as two wavy black lines flanking the organelle.
• The only place where there is no membrane at the base of the flagellum: the cytoplasm of the cell body is continuous with the interior of the flagellum, allowing components synthesized in the cell to enter the flagellum.
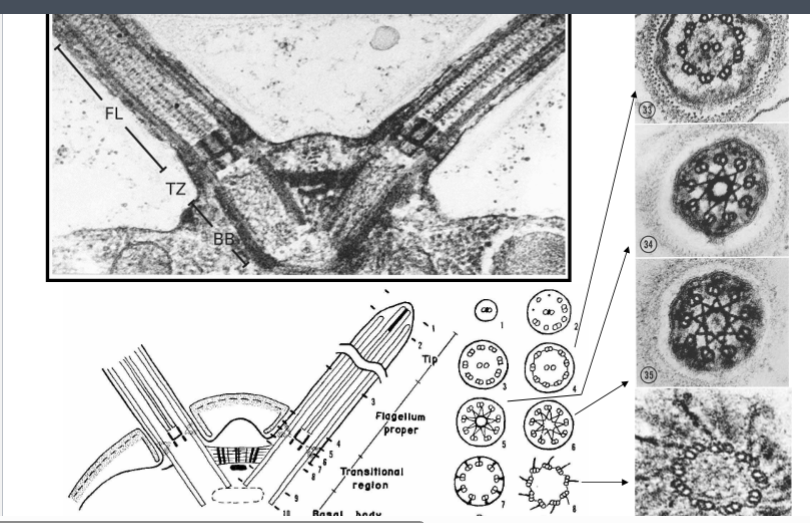
The Basal Body
• The microtubules of the flagellum originate from a structure called the basal body, located at the base of the flagellum inside the cell.
• The basal body is structurally identical to a centriole — it is built from triplet microtubules arranged in a cartwheel pattern.
• The distinction between a centriole and a basal body is contextual: when a centriole nucleates microtubules that extend into a flagellum or cilium, it is referred to as a basal body.
Movement
Movement
• Eukaryotic flagella do not spin. Instead, they move in one of two ways: a whip-like, back-and-forth motion, or a sinusoidal (wave-like) undulation along the length of the structure.
• The type of motion depends on the cell type and the environment the cell is in.
• All eukaryotic flagellar motion is ATP-dependent and driven by molecular motor proteins.
Energy Considerations
• The motor protein responsible for movement — dynein — requires ATP to function.
• In sperm cells, a large mitochondrion known as the mid piece sits at the base of the flagellum and provides a concentrated local source of ATP.
• A major open question in the field is how ATP reaches the tip of very long flagella. Diffusion alone is insufficient: calculations show that sustaining sliding at the rate required across a 10-micrometer flagellum would require ATP concentrations far beyond what is physiologically realistic.
• Evidence suggests that energy-shuttling mechanisms exist — biochemical relays that rapidly transport energy or regenerate ATP locally far from the mitochondria.
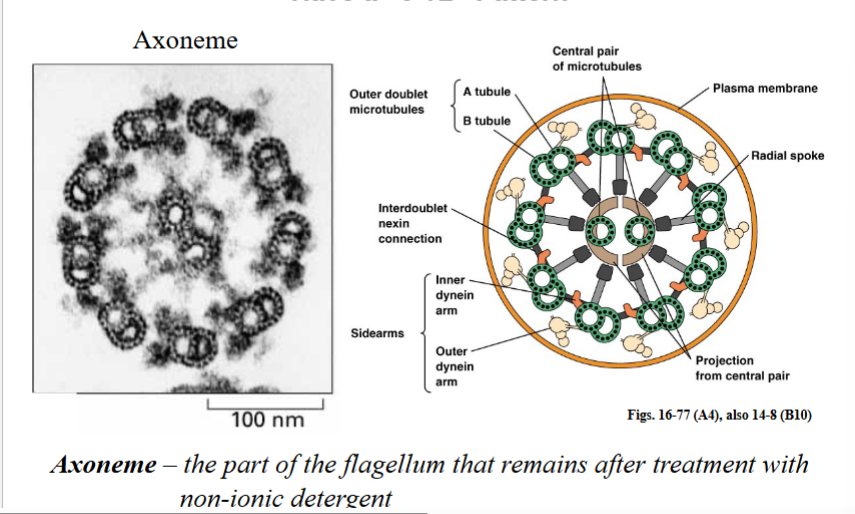
The 9+2 Axonemal Structure
A defining feature of eukaryotic motile cilia and flagella is the highly conserved arrangement of microtubules within the organelle. This arrangement is called the 9+2 structure and has been found in nearly every motile eukaryotic cilium or flagellum examined, from algae to humans, reflecting its ancient evolutionary origin.
Components of the 9+2 Axoneme
• Nine outer doublet microtubules arranged in a ring. Each doublet consists of an A-tubule and a B-tubule fused together.
• Two singlet microtubules in the center (the central pair).
• The entire assembly, minus the membrane, is called the axoneme. An axoneme is technically defined as the flagellum or cilium after the plasma membrane has been removed with a non-ionic detergent — what remains is the protein scaffold.
Dynein Arms and Radial Spokes
Dynein Arms
• Outer dynein arms extend from the A-tubule of each outer doublet toward the B-tubule of the adjacent doublet. These are the primary power generators responsible for driving microtubule sliding and thus the overall motion of the flagellum.
• Inner dynein arms face inward toward the center of the axoneme. Their primary role is not power generation but regulation — they control the waveform and bending pattern of the flagellum.
Radial Spokes
• Radial spokes are protein structures that project inward from the outer doublets toward the central pair microtubules.
• Their function has been studied for decades but is not fully understood. The prevailing idea is that they coordinate the activation of dynein arms across the different doublets.
• If all nine outer doublets tried to slide simultaneously and without coordination, the forces would cancel each other out and the flagellum would not bend. The radial spokes are thought to regulate the timing and direction of sliding.
• The central pair microtubules themselves may rotate or twist (like an agitator in a washing machine), and this motion could help coordinate radial spoke activation, which in turn coordinates the outer dynein arms.
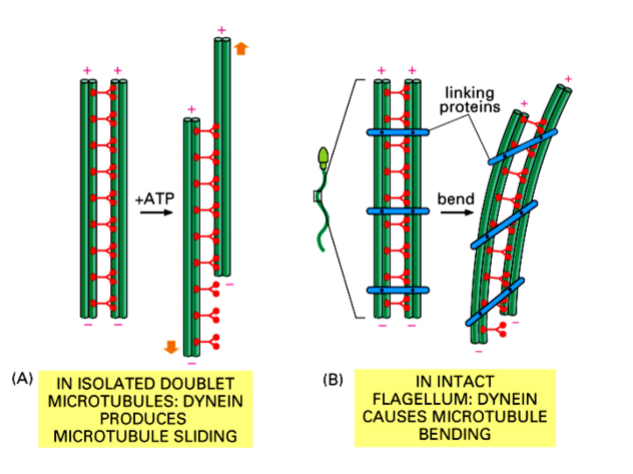
How Sliding Produces Bending
• Dynein motor proteins, when powered by ATP, walk toward the minus end of adjacent microtubules. This action would cause free microtubules to slide past one another.
• However, in an intact flagellum, protein cross-links (called linking proteins or nexin links) tether the outer doublets together and prevent free sliding.
• The result is that the restrained microtubules cannot slide freely, so instead the force produced by dynein causes the entire axoneme to bend.
• Bending to the left involves one set of doublet pairs sliding; bending to the right involves the opposite set. Coordinated, alternating bending generates the whip-like or wave-like movement of the flagellum.
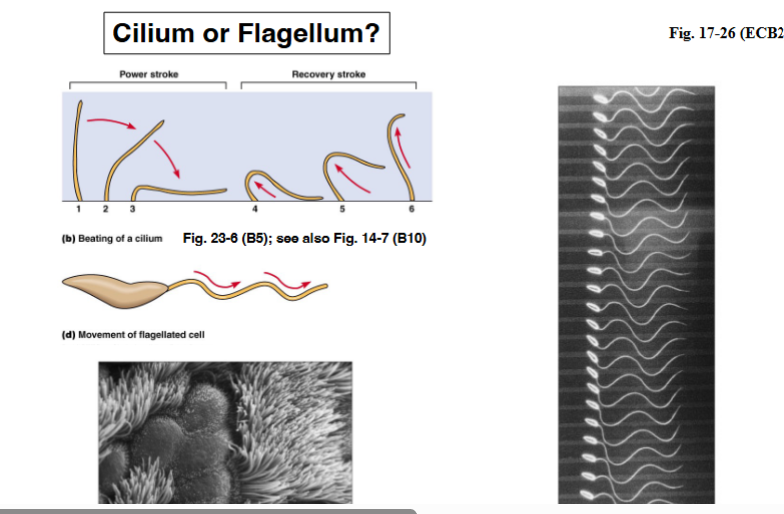
Cilia vs. Flagella — Are They Really Different?
The distinction between cilia and flagella is largely historical and somewhat arbitrary. Even experts who have spent careers studying these structures acknowledge that they are essentially the same organelle. During the COVID-19 pandemic, cell biologists in online discussions grappled with how to formally define the difference — and found it was not easy to do so clearly.
Practical Distinctions
• Number per cell: Flagella are typically present in very small numbers — one to perhaps ten per cell. Cilia can number in the tens, hundreds, or even thousands per cell. This difference in number is often the most practical distinguishing feature.
• Length: Cilia tend to be shorter, typically 1–3 micrometers. Flagella are generally longer structures.
• Motion pattern: Cilia typically move with a power stroke — they bend rigidly and sweep, then undergo a recovery stroke to return. Cells with two cilia effectively do the breaststroke. Flagella more commonly move in a sinusoidal wave that propagates down the length of the structure.
• These are generalizations, and exceptions exist. The boundaries are blurry.
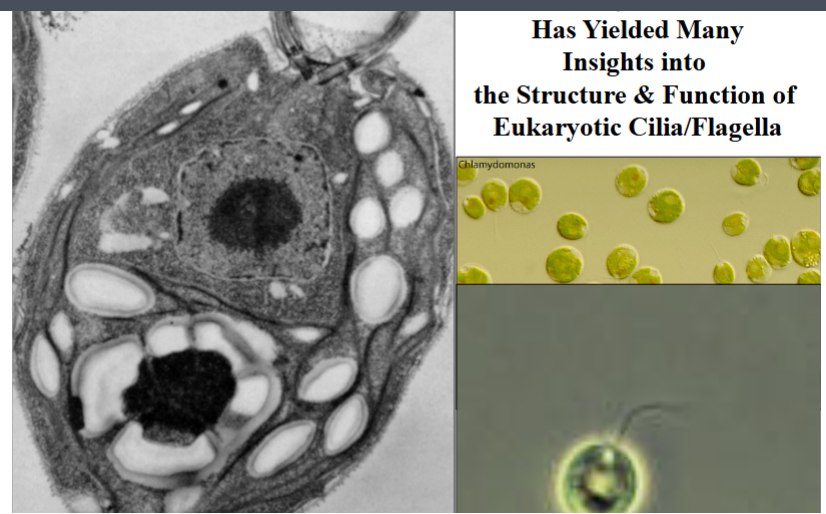
Chlamydomonas as a Model Organism
Most of what is known about the molecular architecture and function of eukaryotic cilia and flagella has come not from studying human cells but from a single-celled green alga called Chlamydomonas. It remains the workhorse organism for this field of cell biology.
Why Chlamydomonas?
• It is approximately 10 micrometers in length and possesses two flagella, each about 10 micrometers long — conveniently sized for biochemical and microscopic analysis.
• Extremely easy and inexpensive to grow in large quantities. Because it is photosynthetic, it requires only light and basic media — flipping on a light switch is essentially all that is needed.
• Highly amenable to genetic manipulation, molecular biology, and biochemistry.
• The flagella can be cleanly removed from the cell body and isolated in large quantities. Specific components, like dynein complexes, can then be purified and studied in detail.
• In contrast, human sperm cells — the most obvious alternative source of flagella — are extremely difficult to fractionate. The cells are tough and yield poor experimental results.
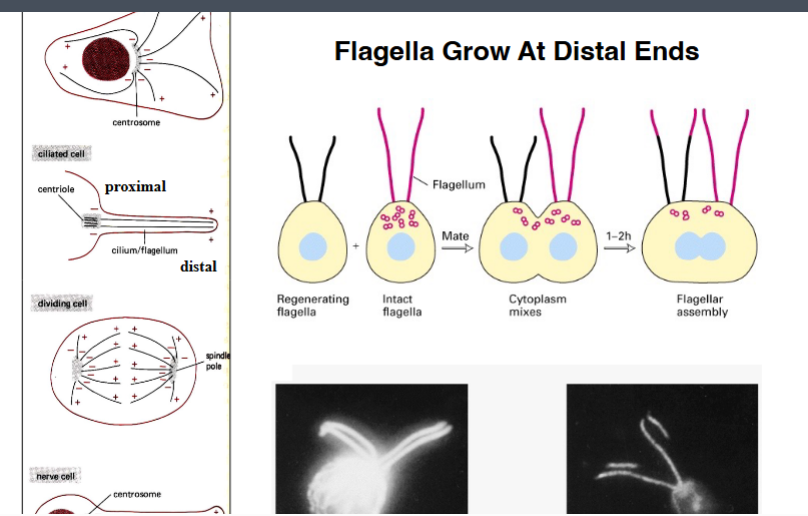
Flagella Grow at Their Tips (Distal Ends)
A fundamental question in organelle biology is: how does a cell build an organelle? For flagella, the key question was whether new material was added at the base (near the cell body) or at the tip (the distal end, farthest from the cell).
Orientation of Microtubules
• In a cilium or flagellum, the plus ends of all microtubules point toward the distal tip (away from the cell body), just as in a neuron axon.
• The minus ends anchor at the basal body near the cell body.
The Mating Experiment
The definitive experiment was performed using Chlamydomonas mating biology and epitope-tagged tubulin. Two populations of cells were used: one with unlabeled tubulin, and one with tubulin that had been tagged with a short epitope sequence (a few specific amino acids that can be recognized by an antibody). This was one of the earliest uses of epitope tagging, a technique now standard in cell biology.
• Chlamydomonas can be induced to mate. When two cells of opposite mating types fuse, their cytoplasms mix, creating a temporary cell with two nuclei and four flagella.
• The experiment: a cell with regenerating (growing) flagella was mated with a cell containing labeled tubulin. As the flagella grew, they could only incorporate labeled tubulin into their structure.
• Result: labeled tubulin appeared exclusively at the tips of the growing flagella — not at the base.
• Conclusion: flagella grow at their distal ends, by addition of new subunits at the plus end of the microtubules.
This raised an immediate follow-up problem: if new material is always added at the tip, how does tubulin synthesized in the cytoplasm get all the way to the end of a 10+ micrometer flagellum fast enough for the organelle to assemble? Diffusion was shown to be far too slow to account for the rate of assembly. This was the puzzle that led directly to the discovery of intraflagellar transport.
Intraflagellar Transport (IFT)
The discovery of intraflagellar transport (IFT) was made while observing Chlamydomonas flagella under high-resolution light microscopy. Rather than seeing just stationary structures, small bulges were observed moving continuously inside the flagellum — toward the tip at roughly 2 micrometers per second, and returning toward the base even faster at approximately 3.5 micrometers per second.
What Are IFT Particles?
• IFT particles are large protein complexes that move inside the flagellum between the outer doublet microtubules and the plasma membrane.
• They function like freight trains: each IFT particle is a complex of many proteins loaded with cargo — including tubulin and other structural components needed to build or maintain the flagellum.
• One of the IFT particle proteins has been shown to bind tubulin directly, fitting together structurally as if the tubulin were designed to be transported by it.
The Motor Proteins Driving IFT
• Anterograde transport (base to tip): driven by kinesin, which is a plus-end-directed motor and walks toward the distal end of the microtubule where the plus end is located.
• Retrograde transport (tip to base): driven by a form of cytoplasmic dynein — distinct from the axonemal dyneins that cause microtubule sliding. This is the same class of dynein found in the cell body moving organelles along cytoplasmic microtubules.
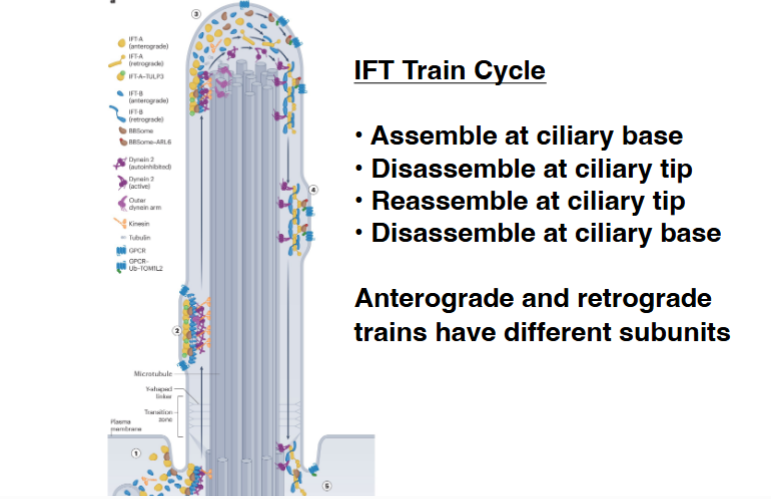
The IFT Train Cycle
• IFT trains assemble at the base of the flagellum (near the basal body).
• They move through the transition zone (the gated boundary region between the cell body and the flagellum) and travel anterograde to the tip.
• At the tip, the trains disassemble, release their cargo, and then reassemble into retrograde trains.
• Retrograde trains travel back to the base, disassemble, and the cycle repeats continuously.
• Anterograde and retrograde trains are composed of different protein subunits — the IFT-A and IFT-B complexes, which have distinct compositions and regulatory states in each direction.
Cilia Are Found on Almost Every Cell in the Human Body
IFT and cilia are not curiosities of pond algae — they are fundamental to human biology. With the exception of cells of hematopoietic lineage (blood cells), nearly every cell in the human body has at least one cilium associated with it. This was not appreciated until recently.
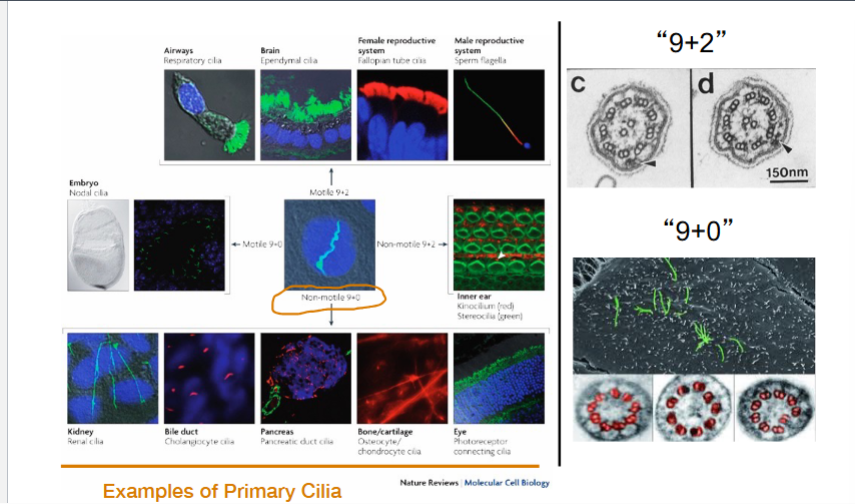
Types of Cilia in the Human Body
Motile 9+2 cilia: The classic axonemal structure. Found in respiratory epithelial cells (where they beat to move mucus and clear debris from the lungs), in the fallopian tubes (where they help move eggs), in ependymal cells lining brain ventricles (where they help circulate cerebrospinal fluid), and in sperm flagella.
Non-motile (primary) 9+0 cilia: Lack the central pair microtubules and dynein arms and do not move. Found in kidney tubular cells, pancreatic duct cells, bone cells (osteocytes), cartilage (chondrocytes), and photoreceptors in the eye. Despite being immotile, they play critical roles in cell signaling.
Motile 9+0 cilia: Lack the central pair but can move. Found at the embryonic node during development, where they generate leftward fluid flow critical for establishing the left-right body axis.
IFT in Mammalian Cells: Clinical Relevance
• The same IFT proteins discovered in Chlamydomonas are present in ciliated mammalian cells, confirming that IFT is a universal mechanism, not just an algal phenomenon.
• When IFT is disrupted in kidney epithelial cells, primary cilia are lost. This leads to polycystic kidney disease (PKD), a serious condition in which fluid-filled cysts accumulate in the kidney.
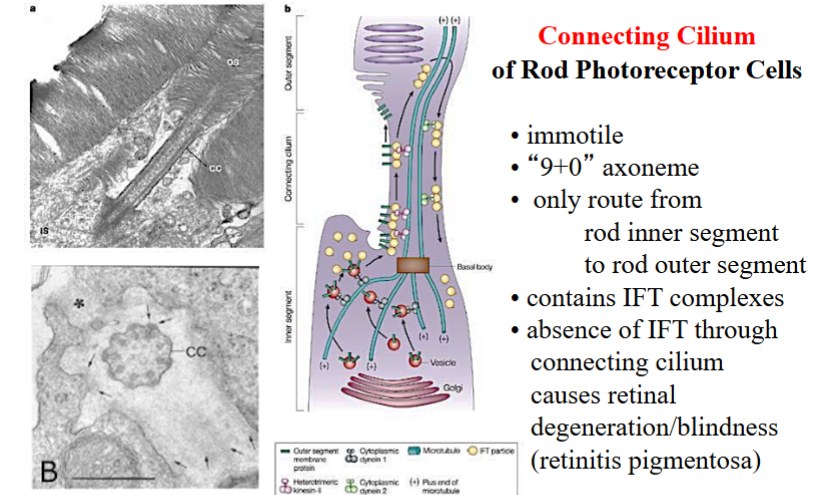
• The connecting cilium of rod photoreceptors in the eye is a 9+0 immotile cilium that serves as the only route for proteins to travel between the inner and outer segments of the photoreceptor. If IFT is absent through this cilium, retinal degeneration occurs, leading to blindness (retinitis pigmentosa).
Cilia as Environmental Sensors
Beyond their roles in movement, many cilia function as sensory antennae — they detect chemical and mechanical signals from the environment and relay that information into the cell.
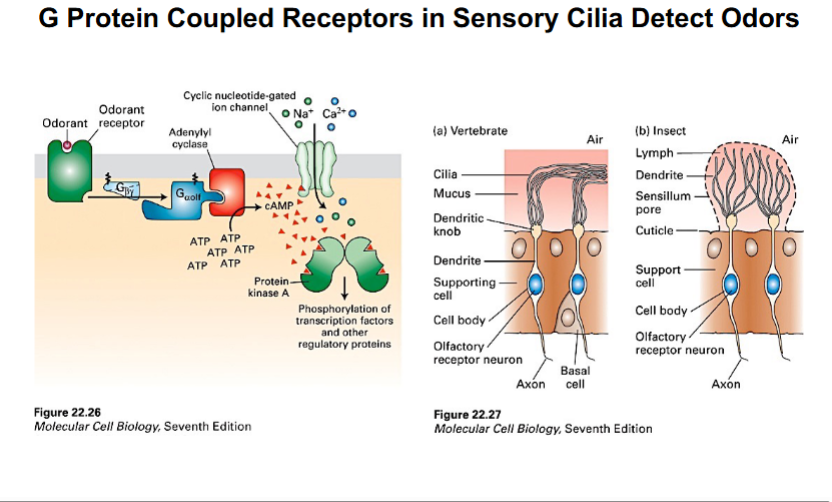
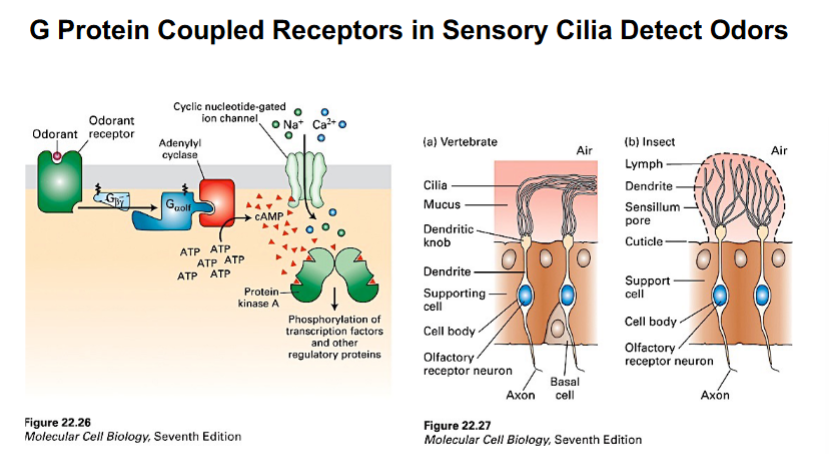
Olfactory Cilia
• Olfactory sensory neurons in the nose extend long cilia into the mucus layer of the nasal epithelium.
• The cilia are packed with G protein-coupled odorant receptors. When an odorant molecule binds to a receptor, it activates a G-protein (G-olf), which triggers adenylyl cyclase to produce cAMP.
• cAMP opens cyclic nucleotide-gated ion channels, allowing Na+ and Ca2+ to flow into the cell, depolarizing the neuron and initiating an action potential that is interpreted as smell.
Photoreceptor Connecting Cilia
• In rod photoreceptor cells of the retina, a specialized connecting cilium links the inner segment (where proteins are synthesized) to the outer segment (where phototransduction occurs).
• This cilium is the sole conduit for all materials moving between these two compartments. IFT is essential for delivering rhodopsin and other membrane proteins to the outer segment.
• Loss of IFT function in this cilium causes retinitis pigmentosa, a progressive blinding disease.
The Transition Zone
Between the cell body and the flagellum proper lies a short region called the transition zone. This region has received increasing attention in recent years and is now understood to be biologically important beyond simply connecting the two compartments.
• Electron micrographs of the transition zone reveal elaborate star-shaped or stellate protein patterns — structures unlike those found in the flagellum above or the basal body below.
• The transition zone appears to function as a selective gate, analogous to the nuclear pore complex. Not all proteins synthesized in the cytoplasm are allowed into the flagellum — only specific ones enter, while others are excluded.
• Research is ongoing to identify which proteins at the transition zone control this selectivity and how they recognize which cargoes to admit.
Cilia and Flagella — Structure and Motility
Overview of Cilia and Flagella
Cilia and flagella are essentially the same structure but can differ in their pattern of movement. Both serve the primary role of moving cells through a medium or moving substances over cell surfaces. These structures have been observed under microscopes for centuries and are among the earliest recorded microscopic observations.
9+2 Motile Cilia and Flagella
The most well-known type of cilia and flagella are the 9+2 structures, named for their internal microtubule arrangement: nine outer doublet microtubules surrounding two central single microtubules. These structures are motile and are found throughout the body in a variety of roles.
• Airway cilia in the lungs move mucus and debris upward and out of the respiratory tract — these are not moving cells, but moving material.
• Sperm cells rely on flagella to propel the head (which contains DNA) toward the egg in the female reproductive tract.
• Cilia lining the fallopian tubes move the egg along toward the uterus.
• Ependymal cilia located at the back of the brain circulate cerebrospinal fluid.
All of these are motile 9+2 structures. Movement in these cilia is powered by dynein motor proteins, specifically the outer arm dynein, which drives the coordinated sliding of microtubules past one another. When microtubule sliding is restrained by linking proteins, the sliding is converted into bending, which generates the characteristic whip-like or oscillating motion of the cilium.
Non-Motile 9+2 Cilia
Not all 9+2 cilia are capable of movement. A prominent example is found in the inner ear. Hair cells in the inner ear have stereocilia (which are actually actin-based structures) that are responsible for sound perception through bending. Adjacent to the stereocilia is a single structure called the kinocilium. The kinocilium has a 9+2 arrangement but is completely non-motile, serving other regulatory functions in the cell rather than generating movement.
Nodal Cilia — Motile 9+0 Cilia
Nodal cilia found in early embryos present an exception to the idea that motility requires the 9+2 arrangement. These cilia lack the central pair microtubules entirely, giving them a 9+0 configuration, yet they are still capable of movement using an actin-based motility mechanism.
The functional significance of nodal cilia is in embryonic development. Cells in the developing embryo secrete signaling molecules called morphogens, which regulate the developmental patterning of the embryo. Nodal cilia sweep these morphogens across the cell surface in a directional manner. If the nodal cilia are impaired or mispositioned, the morphogens are distributed in an incorrect pattern, which can disrupt normal body axis formation and produce developmental defects.
Primary Cilia — Cellular Antennae
Discovery and Initial Dismissal of Primary Cilia
Primary cilia are single, non-motile cilia present on nearly every cell in the human body, with the exception of blood cells and cells derived from blood lineages. They have been known since the 1890s, but for approximately 100 years after their discovery, they were widely regarded as vestigial structures with no meaningful function. Researchers catalogued their presence extensively but could not assign them a purpose.
Several observations led scientists to dismiss primary cilia as non-functional leftovers of evolution. They lack the central pair of microtubules (9+0 arrangement), they do not move, and they have no dynein motor proteins on the outer doublet microtubules to power movement. They were commonly referred to as the appendix of the cell — present but seemingly purposeless. The prevailing theory was that evolution was in the process of eliminating them.
Intraflagellar Transport (IFT) — A Critical Process
To understand the eventual realization of primary cilia function, it is important to first understand intraflagellar transport (IFT). IFT refers to the movement of large protein complexes, called IFT particles or trains, along the length of a cilium or flagellum. These complexes travel along the outer doublet microtubules, just beneath the ciliary membrane.
• Anterograde transport (toward the tip of the cilium) is driven by kinesin motor proteins.
• Retrograde transport (back toward the base) is driven by cytoplasmic dynein after the train disassembles at the tip, then reassembles for the return journey.
• The IFT train cycle: IFT particles assemble at the ciliary base, travel to the tip (anterograde), disassemble at the tip, reassemble at the tip for retrograde travel, then disassemble again at the base.
• Anterograde and retrograde trains are composed of different protein subunits.
IFT is essential for both the formation and maintenance of cilia. If IFT is disrupted before a cilium forms, the cilium will not assemble at all. If IFT is interrupted in an already-formed cilium, the cilium will gradually degenerate because it can no longer receive the building blocks — including tubulin subunits — needed for maintenance.
The Polycystic Kidney Disease Connection
The Polycystic Kidney Disease Connection
The rethinking of primary cilia function came from a landmark study conducted at the University of Massachusetts Medical Center. Researchers were investigating polycystic kidney disease (PKD), a relatively common human disease with a spectrum of severity — some individuals are mildly affected while others experience severe kidney dysfunction and failure. In polycystic kidney disease, the kidneys become enlarged and filled with fluid-retaining cysts, leading to kidney failure.
Using a mouse model of polycystic kidney disease, researchers examined which gene mutation was responsible for the cystic phenotype. What they found was that the defective gene encoded one of the polypeptides in the IFT particle complexes. The mutation disrupted the IFT process in the cells lining the kidney tubules (kidney epithelial cells), which in turn caused the primary cilia on those cells to be short and stubby rather than their normal elongated form.
This was a pivotal discovery because it linked: (1) a defect in a specific cell organelle (primary cilium), to (2) a specific molecular process (IFT), to (3) a common human disease (polycystic kidney disease). It also directly connected research originally done in simple pond organisms like the green alga Chlamydomonas — where IFT was first discovered — to a clinically relevant human condition.
How Do Primary Cilia Function as Environmental Sensors?
Once primary cilia were linked to disease, the field was forced to reconsider their role. The new conceptual framework that emerged is that primary cilia function as antennae on the cell surface.
Cells face a physical challenge in detecting molecules in their surrounding environment. The cell surface is surrounded by what is called an unstirred layer — a relatively static shell of fluid that limits the exchange of molecules between the extracellular environment and the cell membrane. By projecting a cilium outward, a cell essentially extends a sensor through the unstirred layer into the well-mixed extracellular fluid, where signaling molecules are more accessible.
In addition to chemical sensing, primary cilia can respond to mechanical stimuli. In kidney tubule cells, fluid flowing through the tubule causes the primary cilium to bend slightly. This bending creates tension on the ciliary membrane, which in turn causes stretch-sensitive calcium channels to open. Calcium floods into the cytoplasm and triggers a cascade of cellular activity. When this mechanosensory signaling is impaired — as when cilia are absent or too short — cells grow and divide abnormally, contributing to the cyst formation seen in polycystic kidney disease.
Olfactory Sensory Neurons
Olfactory Sensory Neurons
One of the best-characterized examples of primary cilia functioning as environmental sensors is in olfactory sensory neurons, the cells responsible for the sense of smell. Each olfactory neuron has a dendritic knob from which multiple sensory cilia project into the mucus layer of the nasal epithelium, directly exposing them to odorant molecules in inhaled air.
The ciliary membrane of olfactory cilia is packed with G protein-coupled receptors (GPCRs) specific for different odorant molecules. When an odorant binds its receptor, the following signaling cascade occurs:
• The receptor activates a trimeric G protein (specifically G-olf).
• The alpha subunit of G-olf activates adenylyl cyclase (specifically adenylyl cyclase III, or ACIII).
• Adenylyl cyclase converts ATP to cyclic AMP (cAMP), raising the intracellular cAMP concentration.
• Elevated cAMP opens cyclic nucleotide-gated (CNG) ion channels, allowing sodium and calcium ions to enter the cell.
• This ion influx depolarizes the neuron, generating an electrical signal that is transmitted via the axon to the olfactory bulb in the brain.
The result is the perception of an odor. The entire process depends on the cilia functioning as sensors protruding into the environment. Without cilia, the olfactory neuron cannot detect odorants effectively.
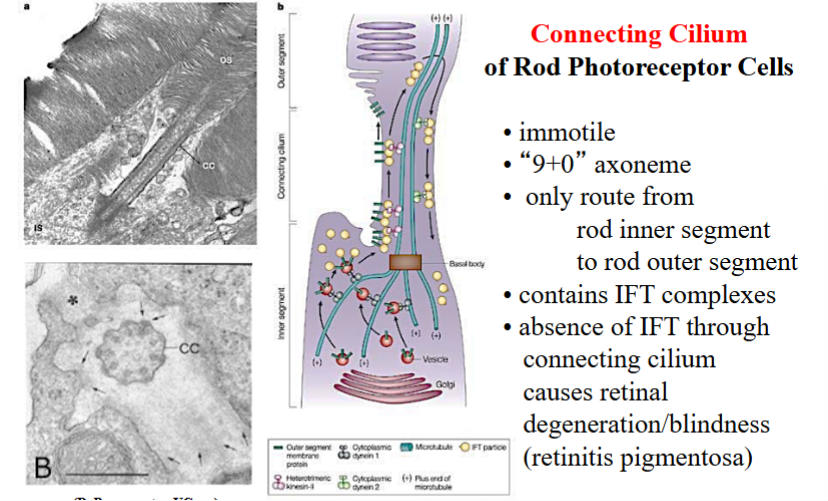
Photoreceptor Cells and the Connecting Cilium
Photoreceptor Cells and the Connecting Cilium
Another important example of primary cilia functioning in a non-motile, non-sensory (but still essential) capacity is in the rod photoreceptor cells of the retina. These cells have a distinct architecture: a lower inner segment, where the nucleus is located and most protein synthesis occurs, and an upper outer segment, where the photosensitive membrane discs are stacked. The outer segment is the light-sensing part of the cell.
The inner and outer segments are connected by a very narrow structure called the connecting cilium. Using the analogy of the Americas, the inner segment is South America, the outer segment is North America, and the connecting cilium is Central America — the only route between the two. All proteins needed to build and maintain the outer segment are synthesized in the inner segment and must travel through the connecting cilium to reach their destination.
The connecting cilium has a 9+0 axoneme (non-motile primary cilium) and is absolutely loaded with IFT complexes actively shuttling proteins from the inner to the outer segment. If IFT through the connecting cilium is disrupted, proteins cannot be delivered to the outer segment, which begins to degenerate. This degeneration causes the eye disease retinitis pigmentosa, a leading cause of blindness.
Ciliopathies — Diseases of Cilia
The category of diseases caused by defects in cilia is called ciliopathies. Currently, about 35 well-defined ciliopathies are recognized. When rarer genetic conditions are included, an estimated 100 human diseases are linked to defects in cilia, with many of them tracing back to mutations in IFT-related genes. This broad disease relevance underscores that cilia — and primary cilia in particular — are far from vestigial structures. They are essential to normal development, organ function, and sensory perception.
The Cell Cycle — Foundations
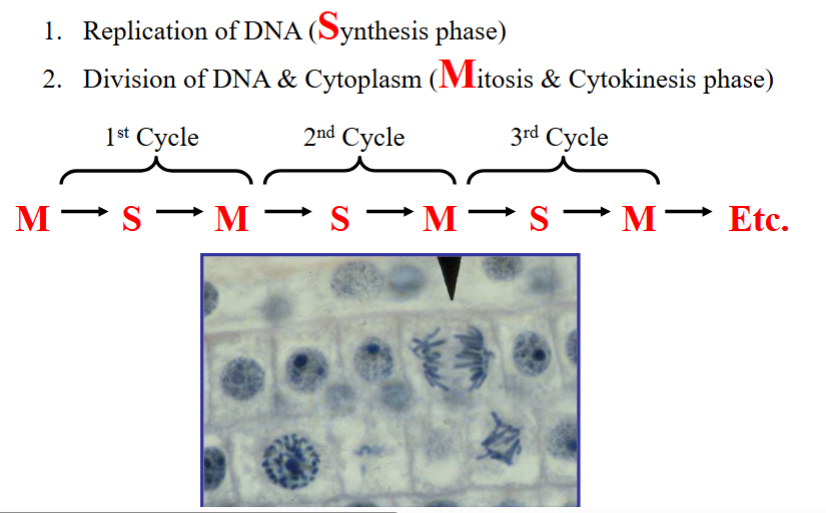
What Must a Cell Accomplish to Divide?
Successful cell division requires two fundamental events.
First, the replicated DNA must be divided between the two daughter cells with high fidelity — this is mitosis and cytokinesis, collectively called M phase.
Second, before DNA can be divided it must first be replicated — this occurs during S phase (synthesis phase). These two phases form the core of the cell cycle:
• S phase: DNA replication — the cell duplicates its genetic material.
• M phase: Mitosis and cytokinesis — chromosomes are separated and the cytoplasm is divided.
Cells in M phase look morphologically distinct from non-dividing cells, with condensed chromosomes visible under the microscope. This makes M phase relatively easy to identify.
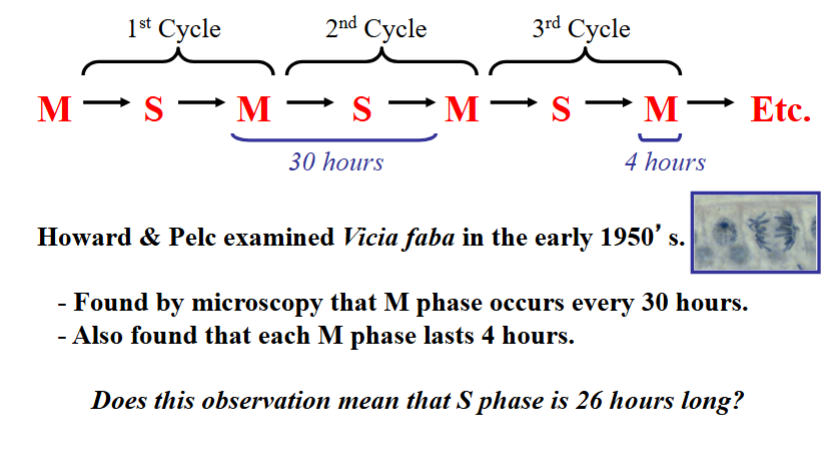
Howard and Pelc — Defining the Cell Cycle Phases
Howard and Pelc — Defining the Cell Cycle Phases
In the early 1950s, researchers Howard and Pelc set out to define the timing of cell cycle phases in dividing cells. They worked with plant cells — specifically bean plants (Vicia faba) — because plant cell divisions are easily visualized. They made two initial observations:
• A new mitosis initiated approximately every 30 hours in their cells (i.e., a 30-hour cell cycle).
• Mitosis and cytokinesis together (M phase) took approximately 4 hours.
This left 26 hours unaccounted for. To determine how long DNA synthesis (S phase) takes, they used a technique called microscopic autoradiography, in which cells are exposed to a radioactive label (originally phosphorus-32, chosen because DNA is phosphate-rich; later experiments used tritium for better resolution) that incorporates into newly synthesized DNA. The radioactive emissions expose a photographic emulsion, revealing which cells are actively replicating DNA.
Their key finding: at any given moment, only 20% of cells in the tissue showed radioactive labeling. Howard and Pelc reasoned that the proportion of cells in active DNA synthesis at any given time is equal to the proportion of the total cell cycle spent in S phase. With a 30-hour cell cycle and 20% of cells in S phase, S phase duration is calculated as:
30 hours × 0.20 = 6 hours for S phase
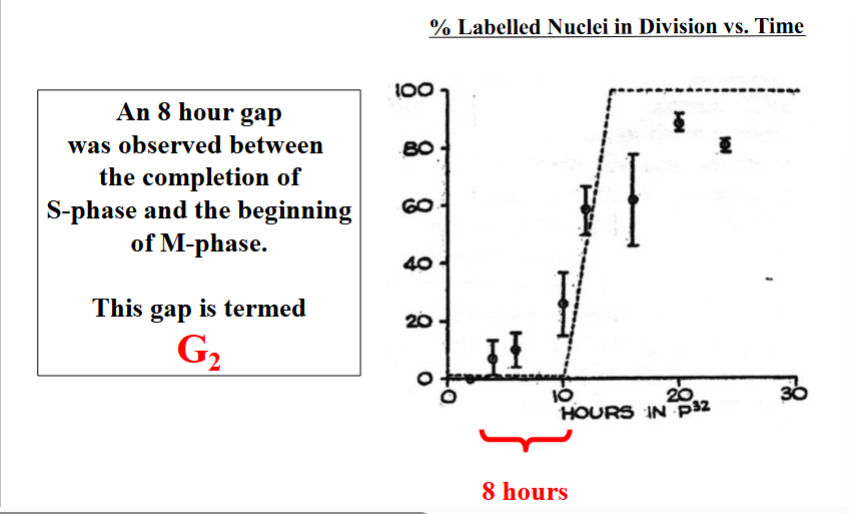
Identifying G1 and G2 — The Gap Phases
Identifying G1 and G2 — The Gap Phases
With M phase at 4 hours and S phase at 6 hours, 20 hours remained unaccounted for in the 30-hour cycle. Howard and Pelc next performed experiments to determine whether these remaining hours were clustered before S phase, after S phase, or split between the two positions.
By tracking when radioactively labeled nuclei (cells that had just completed S phase) first appeared in mitosis, they found approximately an 8-hour gap between the end of S phase and the beginning of M phase. This gap was named G2 (the second gap phase). The remaining time — approximately 12 hours — was placed before S phase and named G1 (the first gap phase). Notably, G2 was identified first, which is why the first gap ended up with the designation G1 despite being described after G2.
The complete cell cycle phases in order are:
• G1 (Gap 1): Period after M phase and before S phase — typically the longest phase; the cell grows and prepares for DNA replication.
• S phase (Synthesis): DNA replication.
• G2 (Gap 2): Period after S phase and before M phase — approximately 8 hours in Howard and Pelc's cells; the cell prepares for division.
• M phase (Mitosis + Cytokinesis): Physical division of the cell — typically the shortest phase.
Collectively, G1, S, and G2 are called interphase. A cell in interphase is not visibly dividing, though it may be actively replicating DNA (if in S phase) or growing (if in G1 or G2). The relative lengths of these phases vary considerably among different cell types — there is no universal timing.
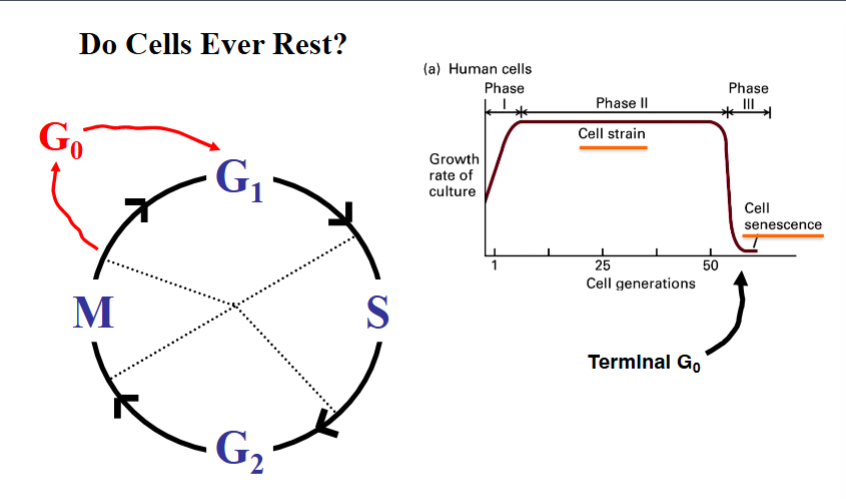
G0 — The Resting State
G0 — The Resting State
Not all cells are constantly cycling. A researcher in the early 1970s named Pardee observed that cells recovering from disruptions to the cell cycle tended to restart from the same point, suggesting that non-dividing cells occupy a defined resting state. He proposed the concept of G0 (G sub zero), a state in which cells exit the active cell cycle and enter a quiescent, non-dividing condition.
G0 is a sidetrack off the main cycle. After completing M phase, a cell can either re-enter G1 and continue cycling, or it can enter G0. The distinction between quiescence and senescence is important:
• Quiescence (reversible G0): A temporary resting state. The cell is not dividing but retains the ability to re-enter the cell cycle if given the appropriate signals. Most non-dividing cells in a healthy organism are in this state.
• Senescence (irreversible G0): A permanent resting state. Cells that have accumulated extensive molecular damage over time enter a terminal G0 state and will never divide again. They will eventually die.
Evidence for cellular senescence comes from experiments with human cells in culture. When a sample of human liver cells (hepatocytes), for example, is placed in culture, the cells divide rapidly at first. After approximately 40 or so rounds of division, the rate of new cell cycles begins to drop sharply. These cells are considered senescent — permanently arrested. This aging phenomenon in cell culture reflects the accumulation of molecular damage and the irreversible nature of terminal G0.
Many cell types are most commonly encountered in G0. Neurons are the most notable example — they are essentially non-dividing for the entire life of the organism. However, even non-neural cells with significant damage can enter a permanent G0 state.
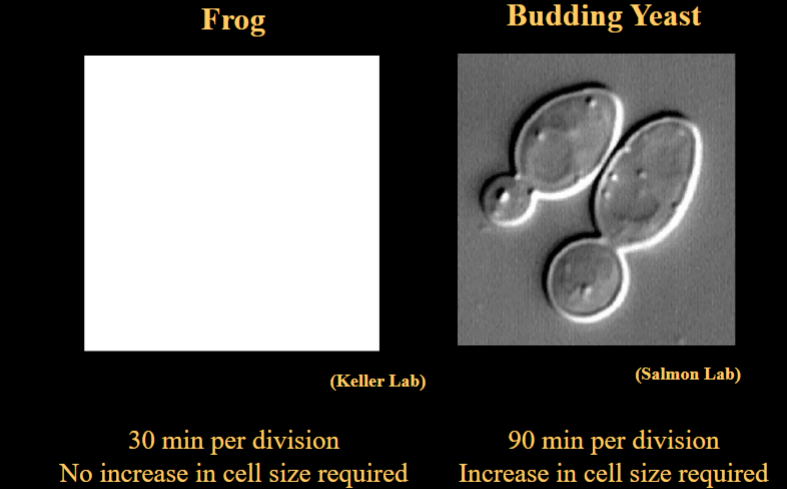
Does a Cell Need to Grow Before Dividing?
Does a Cell Need to Grow Before Dividing?
The relationship between cell growth and cell division is one of the less resolved questions in cell biology. Two primary models have been proposed:
• The Sizer Model: A cell must reach a certain minimum size before it can divide. Evidence for this comes from budding yeast, where the bud that will become the daughter cell must grow large enough to accommodate the replicated DNA that is being segregated into it.
• The Adder Model: A cell does not need to reach an absolute size, but rather must add a fixed amount of growth (increase its size by a certain percentage) before division is triggered.
Both models have experimental support in different cell types, and neither fully describes all situations. The question of how a cell senses its own size or growth status and communicates this to the cell cycle machinery is an area of ongoing research. Despite the intense focus on the molecular machinery of the cell cycle (the proteins and genes regulating progression through G1, S, G2, and M), the question of how growth is coupled to division has been relatively neglected for decades. Only recently has significant attention turned back to understanding this fundamental relationship.
Importantly, growth is not always required for division. In early frog embryos, for example, cells divide rapidly and continuously without growing. Each division produces cells that are smaller than the parent. This shows that cell growth and cell division are separable processes, not always linked.
Overview of the Cell Cycle
Overview of the Cell Cycle
The cell cycle describes the progression of a cell through distinct phases that ultimately result in cell division. The concept of the cell cycle emerged from work by Howard and Pelc nearly 75 years ago using bean plants (Vicia faba). Their framework for understanding the cell cycle remains accurate and unchanged to this day. The cell cycle is organized into four main phases: G1 (Gap 1), S (DNA Synthesis), G2 (Gap 2), and M (Mitosis/Cytokinesis).
Determining the Length of Each Phase (Howard & Pelc, 1952)
Howard and Pelc used radioactive phosphorus (32P) labeling and microscopic autoradiography to determine the duration of each cell cycle phase in Vicia faba cells, which had a 30-hour cell cycle and a 4-hour M phase.
• When 32P-labeled nucleotides were provided to cells, 2 hours of labeling were required to obtain a detectable signal, and 20% of cells incorporated the label.
• The proportion of cells synthesizing DNA equals the proportion of the cell cycle spent in S phase. Since 20% of cells were labeled: 30 hours x 20% = 6 hours for S phase.
• This left 30 - 6 - 4 = 20 unaccounted hours, which led to the discovery of gap phases.
• By tracking labeled nuclei, an 8-hour gap was observed between the end of S phase and the beginning of M phase. This was named G2 (Gap 2).
• The remaining 12 hours between M phase completion and S phase onset was named G1 (Gap 1).
Interphase and G0
Interphase refers collectively to G1, S, and G2 — all the phases of the cell cycle before M phase. Cells can also exit the active cell cycle and enter a resting state called G0 (quiescence). G0 can be temporary (reversible) or terminal. Terminal G0, known as senescence, represents a permanent exit from the cell cycle that occurs after many cell generations. Human somatic cells in culture typically undergo approximately 50 generations before entering terminal G0.
Is Cell Growth Required for Cell Division?
Not always. Frog embryonic cells divide every 30 minutes with no increase in cell size — they are simply partitioning existing cytoplasm. Budding yeast, by contrast, require an increase in cell size before dividing, taking approximately 90 minutes per division. This demonstrates that the relationship between growth and division varies by organism and context.
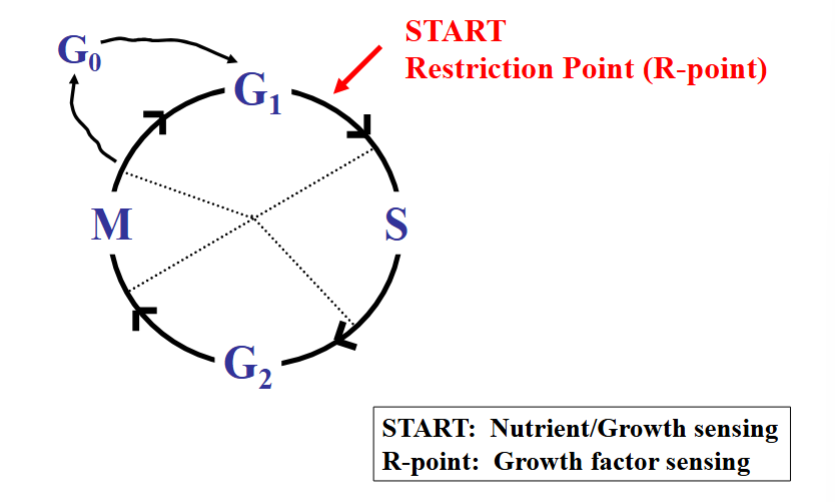
Where Does the Cell Cycle Begin? The Restriction Point and START
Where Does the Cell Cycle Begin? The Restriction Point and START
A key question about the cell cycle is whether there is a defined starting point. Research revealed that there is indeed a critical decision point, located in late G1, but it is named differently depending on the organism.
• START (yeast): The starting point in yeast is simply called START. At this point, yeast cells sense whether sufficient nutrients are available and whether adequate growth has occurred. Entering the cell cycle without enough resources to support DNA replication and mitosis would be detrimental, so this sensing checkpoint is essential.
• Restriction Point / R-point (mammalian cells): In mammalian cells, the equivalent checkpoint is the restriction point (R-point). Rather than sensing nutrients, mammalian cells sense growth factors — small signaling molecules that promote cell growth and entry into the cell cycle.
Defining the R-Point with Serum Starvation Experiments
Experiments with mammalian cells in tissue culture defined the R-point precisely. Serum — the liquid component of blood after clot removal — is loaded with growth factors and is required for cell growth in culture.
• When cells were starved of serum, they failed to enter the cell cycle and arrested in G1, before the R-point.
• Critically, the timing of starvation relative to cell cycle position mattered. Because the culture was asynchronous (different cells were at different points in the cycle), the effect of serum deprivation varied.
• Cells in G1 before the R-point arrested in G1 when serum was withdrawn.
• Cells that had already passed the R-point (in S, G2, or M phase) were unaffected — they continued through the cell cycle normally and completed division regardless of serum deprivation.
• Conclusion: Once a cell passes the restriction point, it is committed to completing the cell cycle. No external growth signal is needed after this point.
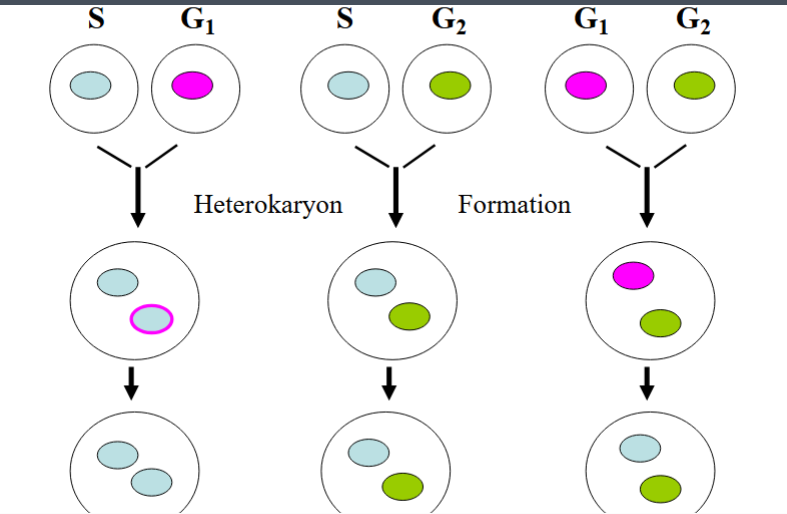
Rules of the Cell Cycle: The Rao & Johnson Heterokaryon Experiments (1970)
Rules of the Cell Cycle: The Rao & Johnson Heterokaryon Experiments (1970)
Rao and Johnson used mammalian cell fusion to establish the fundamental rules governing how cells progress through the cell cycle. By fusing cells from different phases using viral membrane-fusion techniques, they created heterokaryons — single cells containing two nuclei derived from cells in different cell cycle phases. These experiments were observational and established the 'rules of the road' but did not yet reveal the molecular mechanisms.
Experiment 1: G1 + G2 Fusion
When a G1-phase nucleus was combined with a G2-phase nucleus in a heterokaryon, the G1 nucleus proceeded through S phase (DNA replication) on its own schedule and then entered G2. The G2 nucleus simply waited. The two nuclei then entered M phase together.
• Key conclusion: Cell cycle phases cannot be skipped. The G1 nucleus did not jump to G2 even though it was in the presence of a G2 nucleus — it had to proceed through S phase first.
Experiment 2: S + G2 Fusion
When an S-phase nucleus was combined with a G2-phase nucleus, the G2 nucleus waited without re-entering S phase. It did not replicate its DNA again. The S-phase nucleus remained in S phase and did not prematurely advance to G2. Once DNA replication was complete in the S-phase nucleus, both nuclei proceeded together into M phase.
• Key conclusion 1: DNA is licensed to replicate only once per cell cycle. Once replication is complete, there is a block that prevents a return to S phase.
• Key conclusion 2: The cell monitors whether all DNA has been replicated before advancing to M phase. The G2 nucleus 'waited' because it was receiving a signal that replication in the shared cell was not yet complete — a form of cellular self-monitoring or checkpointing.
Experiment 3: S + G1 Fusion
When an S-phase nucleus was combined with a G1-phase nucleus, the G1 nucleus entered S phase faster than expected — more quickly than it would on its own schedule. This accelerated entry suggested that a diffusible molecule present in the S-phase cell was acting on the G1 nucleus to pull it forward into S phase. This molecule was hypothesized to be an S-phase promoting factor (SPF).
• Key conclusion: A diffusible activating signal exists at or past the R-point that promotes entry into S phase.
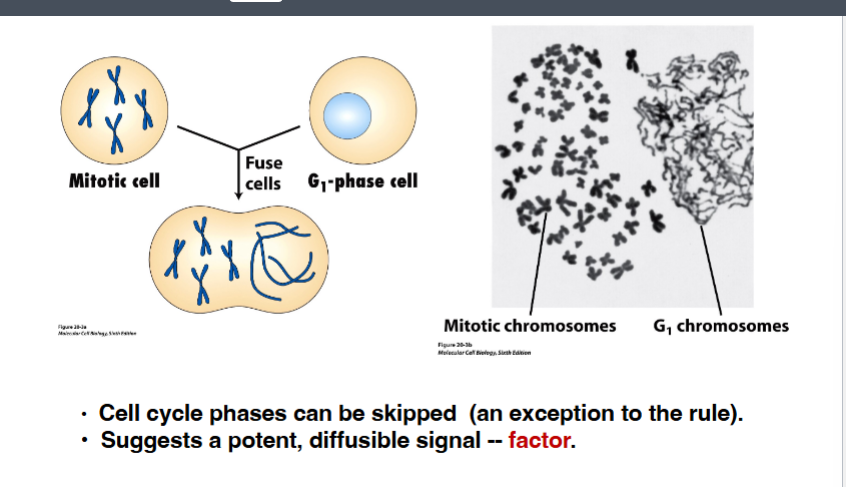
Exception to the Rule: M + G1 Fusion
When an M-phase cell was fused with a G1-phase cell, something unexpected happened — the G1 nucleus immediately condensed its DNA and entered M phase without ever replicating. This was a stunning exception to the rule that phases cannot be skipped. The G1 nucleus was thrust directly into mitosis by a powerful diffusible signal present in the M-phase cytoplasm.
• Key conclusion: While phases cannot normally be skipped, there exists an extremely potent, diffusible cytoplasmic factor in M-phase cells capable of forcing any nucleus into mitosis regardless of its current phase. This factor would later be identified as MPF.
Identifying Cell Cycle Genes: Hartwell's Yeast Mutants
Identifying Cell Cycle Genes: Hartwell's Yeast Mutants
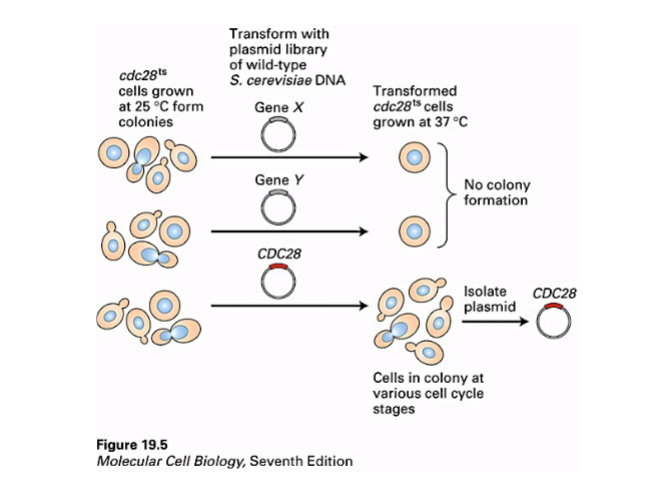
While Rao and Johnson's experiments established the rules of the cell cycle, they did not reveal the molecular mechanisms. Lee Hartwell took a genetic approach using budding yeast (Saccharomyces cerevisiae) in the 1960s-80s to identify genes required for cell cycle progression.
Temperature-Sensitive CDC Mutants
Hartwell identified temperature-sensitive mutants of yeast that grew normally at permissive (lower) temperatures but failed to divide at restrictive (elevated, 37°C) temperatures. These were called CDC (Cell Division Cycle) mutants. Each mutant strain had a mutation in a different gene. He numbered his strains sequentially — the 28th mutant became cdc28.
The cdc28 Mutant Defines START
When cdc28 temperature-sensitive mutant cells (an asynchronous culture — cells in various cycle phases) were spread on a plate and shifted to 37°C:
• Cells that were in S, G2, or M phase at the time of temperature shift continued dividing and formed colonies.
• Cells that were in early G1 at the time of temperature shift did not divide and did not form colonies.
• This showed that the CDC28 gene product is specifically required for passage through START in G1. The mutation does not affect cells that have already passed this checkpoint.
Cloning CDC28 by Complementation
To identify the CDC28 gene, Hartwell transformed cdc28 mutant cells with a plasmid library — circular DNA molecules each containing a random fragment of the wild-type yeast genome. Each mutant cell could only take up one plasmid.
• Most plasmids had no effect — transformed cells still failed to form colonies at 37°C.
• Rarely, one plasmid allowed the mutant cells to form colonies at 37°C — this plasmid contained the wild-type CDC28 gene, which complemented (compensated for) the mutation.
• Once identified, the DNA sequence of CDC28 was determined, and the amino acid sequence revealed it was a kinase — an enzyme that phosphorylates target proteins. This kinase became known as the CDC28 kinase.
Paul Nurse and Fission Yeast: CDC2 and the Wee Mutants
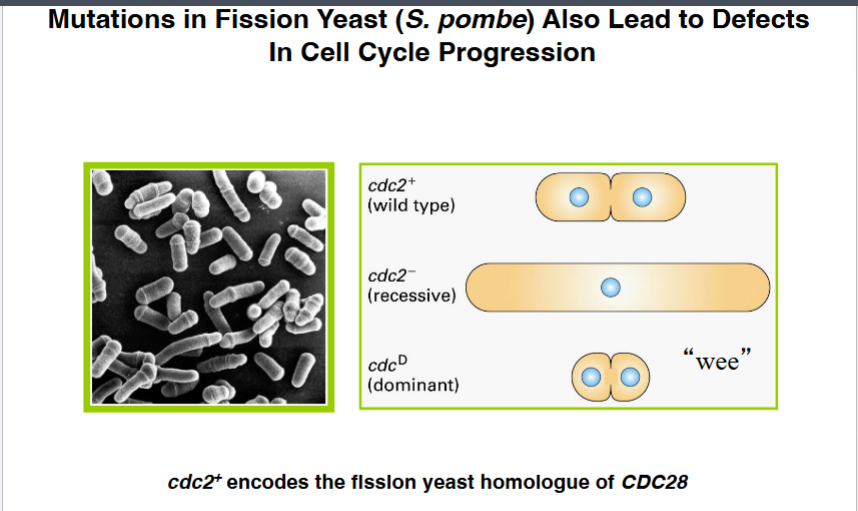
Paul Nurse and Fission Yeast: CDC2 and the Wee Mutants
Paul Nurse worked in parallel with Hartwell, using a different yeast species — fission yeast (Schizosaccharomyces pombe). Fission yeast divides by splitting down the center rather than budding. Nurse also looked for temperature-sensitive and dominant mutations affecting cell division.
• cdc2- (recessive): When temperature was raised, cells could not divide and became abnormally long because they kept growing without dividing.
• cdc2D (dominant, always active): These cells divided prematurely — before completing growth — producing abnormally small daughter cells. Nurse called these the 'wee mutants' (Scottish for small).
When the CDC2 gene from fission yeast was cloned, it turned out to encode the same kinase as CDC28 in budding yeast. The reason they had different numbers was simply that one was the 28th strain in Hartwell's collection and the other was the 2nd in Nurse's collection.
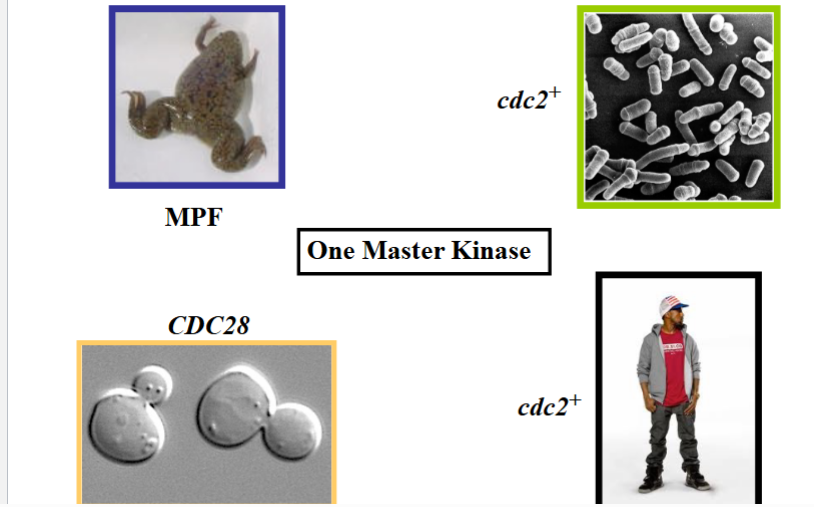
A Conserved Gene Across Vastly Distant Species
A Conserved Gene Across Vastly Distant Species
The revolutionary finding was that humans also have the same gene — also called CDC2 — encoding the same conserved kinase. This was stunning because budding yeast (S. cerevisiae) and fission yeast (S. pombe) are as evolutionarily distant from each other as either is from humans, yet all three use the same master kinase to control their cell cycle. This established that model organisms like yeast could be used to study fundamental human biology, providing a powerful research tool without experimenting directly on human cells.
MPF: M-Phase Promoting Factor and Frog Egg Experiments
MPF: M-Phase Promoting Factor and Frog Egg Experiments
Discovery of a Diffusible Factor in Frogs (Lohka & Matsui, 1970s)
Frog eggs (Xenopus) are large, easy to manipulate, and ideal for injection experiments. Researchers took advantage of this to test whether a cytoplasmic factor could drive cells into M phase.
• Cytoplasm was extracted from an M-phase-arrested egg using a glass needle and injected into a G2-arrested egg.
• The recipient G2 egg immediately entered M phase — demonstrating conclusively that something in the cytoplasm (not the nucleus or DNA) was responsible for triggering mitosis.
Naming MPF: Maturation Promoting Factor = Mitosis Promoting Factor
Two groups studying different processes converged on the same activity:
• Researchers studying meiosis in frog eggs identified a cytoplasmic factor needed for progression from meiosis I to meiosis II. They called it Maturation Promoting Factor.
• Researchers studying mitosis in fertilized frog eggs found a cytoplasmic activity that, when transferred, triggered other cells to enter mitosis. They called it Mitosis Promoting Factor.
• These were unified into one name: MPF — M-Phase Promoting Factor. The activity of MPF rises and falls in a cyclical manner, peaking just before M phase and dropping sharply when M phase is complete.
Protein Synthesis Is Required for MPF Activity
Experiments using the protein synthesis inhibitor cycloheximide demonstrated that a newly synthesized protein is required for MPF activity and entry into M phase:
• Fertilized frog eggs treated with cycloheximide did not undergo their first cell division.
• When cytoplasm from an untreated M-phase cell was injected into a cycloheximide-treated egg, the recipient cell's nucleus entered mitosis — proving the activity was protein-based and present in M-phase cytoplasm.
• This confirmed that a specific protein, whose synthesis is required, drives the cell into M phase.
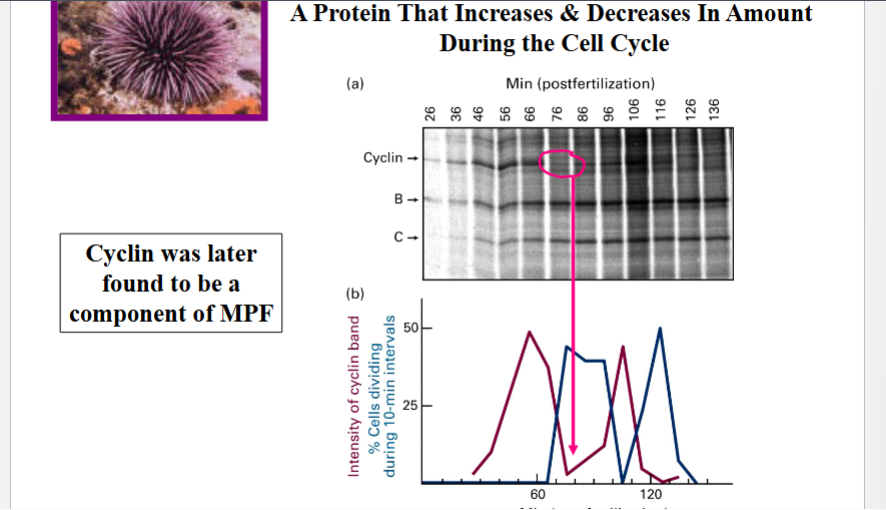
Discovery of Cyclin: The Cycling Protein (Tim Hunt, 1980s)
Discovery of Cyclin: The Cycling Protein (Tim Hunt, 1980s)
Tim Hunt, working at the Marine Biological Laboratory at Woods Hole, Massachusetts, used sea urchins (Strongylocentrotus) as a model system because their eggs are easy to collect and fertilize in large quantities. He fertilized sea urchin eggs and collected samples at multiple time points post-fertilization, then analyzed total protein content by SDS-PAGE (polyacrylamide gel electrophoresis with SDS) and Coomassie staining to visualize all polypeptides separated by molecular weight.
In his gel, one particular polypeptide band stood out: it progressively increased in intensity over time, then suddenly and completely disappeared — unlike all other bands. When this band intensity was plotted over time alongside the percentage of cells dividing, the protein level peaked just before the peak of cell division, then dropped to zero at the time of division.
Because this protein fluctuated in a cyclical manner coinciding with the cell cycle, Hunt named it cyclin. At the time, there was no direct proof connecting cyclin to cell division — but the correlation was striking. Cyclin was later confirmed to be a component of MPF.
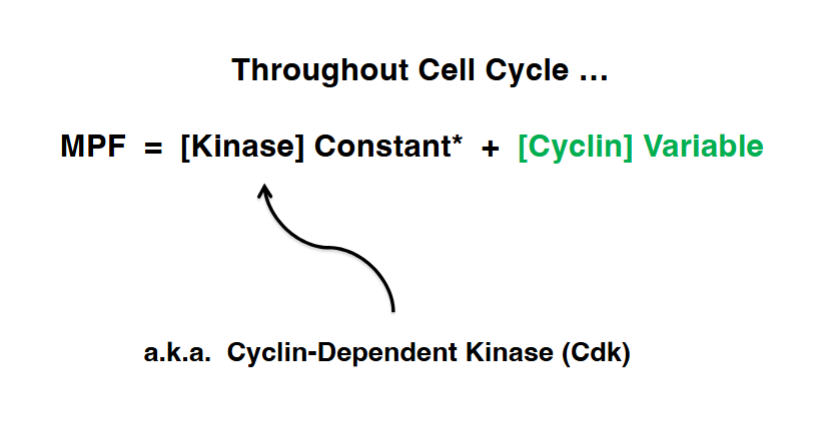
MPF = Cyclin-Dependent Kinase (CDK) + Cyclin
MPF = Cyclin-Dependent Kinase (CDK) + Cyclin
The convergence of all these research lines revealed that MPF is a two-component complex:
• CDK (Cyclin-Dependent Kinase): The kinase component — CDC28 in budding yeast, CDC2 in fission yeast and humans. Its concentration remains relatively constant throughout the cell cycle.
• Cyclin: The regulatory subunit whose concentration rises and falls (cycles) through the cell cycle. Cyclin must bind to the CDK to activate it, and also determines which substrates the CDK phosphorylates.
MPF activity = CDK (constant) + Cyclin (variable). It is the oscillation in cyclin levels — not the kinase itself — that drives the cyclical nature of MPF activity.
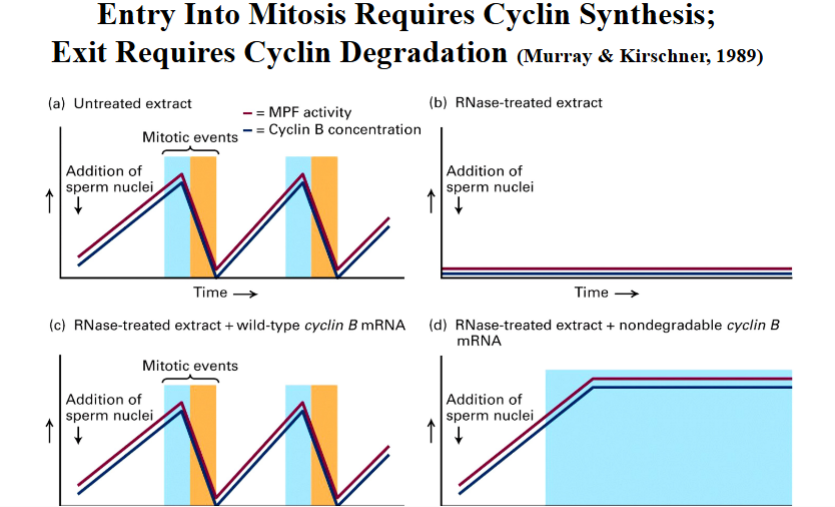
Cyclin Synthesis and Degradation Control M-Phase Entry and Exit
Entry Into Mitosis: Cyclin Synthesis
Cyclin Synthesis and Degradation Control M-Phase Entry and Exit
Entry Into Mitosis: Cyclin Synthesis
Murray and Kirschner (1989) performed key experiments using Xenopus egg extracts to demonstrate that cyclin synthesis is required to enter mitosis and cyclin degradation is required to exit:
• Untreated extracts cyclically entered and exited mitosis, with MPF activity and cyclin B levels rising and falling together.
• RNase-treated extracts (destroying all mRNA, blocking new protein synthesis) failed to cycle — confirming that new protein synthesis is required.
• Adding wild-type cyclin B mRNA back to RNase-treated extracts restored cycling.
• Adding non-degradable cyclin B mRNA (with the destruction box mutated) caused a permanent mitotic arrest — cells entered M phase but could never exit. This proved that cyclin degradation is required to exit mitosis.
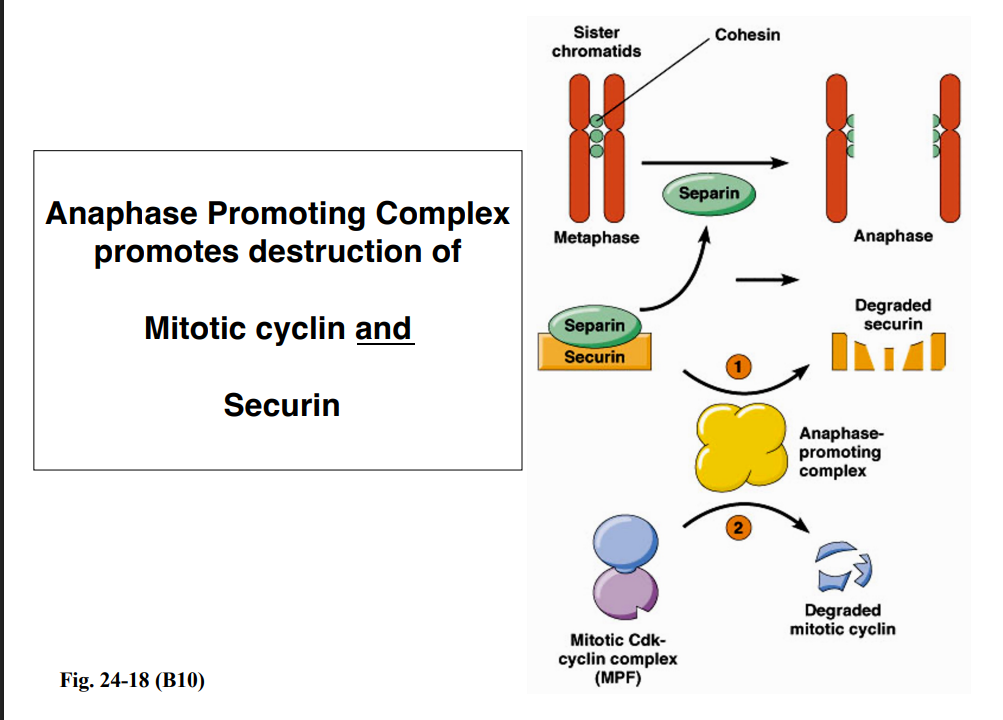
Exit from Mitosis: The Anaphase Promoting Complex (APC)
Exit from Mitosis: The Anaphase Promoting Complex (APC)
Cyclin degradation at the end of M phase is carried out by the Anaphase Promoting Complex (APC), a ubiquitin ligase. The APC polyubiquitinates mitotic cyclin, tagging it for destruction by the proteasome.
The APC also targets a second key protein called securin for degradation. Securin normally inhibits an enzyme called separase (separin). When securin is degraded by the APC:
• Separase becomes active and cleaves cohesin, the protein complex holding sister chromatids together.
• Sister chromatids separate and are pulled to opposite poles — the transition from metaphase to anaphase.
So the APC simultaneously drives anaphase (by destroying securin) and exits from mitosis (by destroying mitotic cyclin and inactivating MPF).
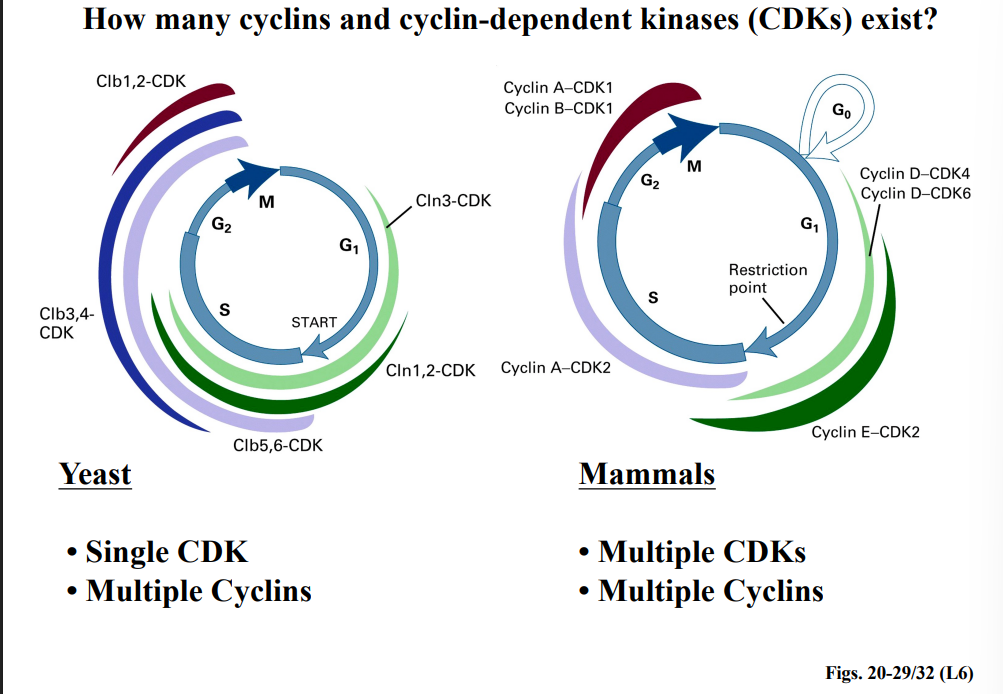
Multiple Cyclins and CDKs Regulate Different Cell Cycle Phases
Yeast vs. Mammals
• Yeast: Have a single CDK but multiple cyclins (e.g., Cln1, Cln2, Cln3, Clb1-6). Different cyclins are expressed at different phases and activate the single CDK to phosphorylate phase-appropriate targets.
• Mammals: Have multiple CDKs (CDK1, CDK2, CDK4, CDK6) and multiple cyclins (A, B, D, E). Different CDK-cyclin pairs operate at different points in the cycle.
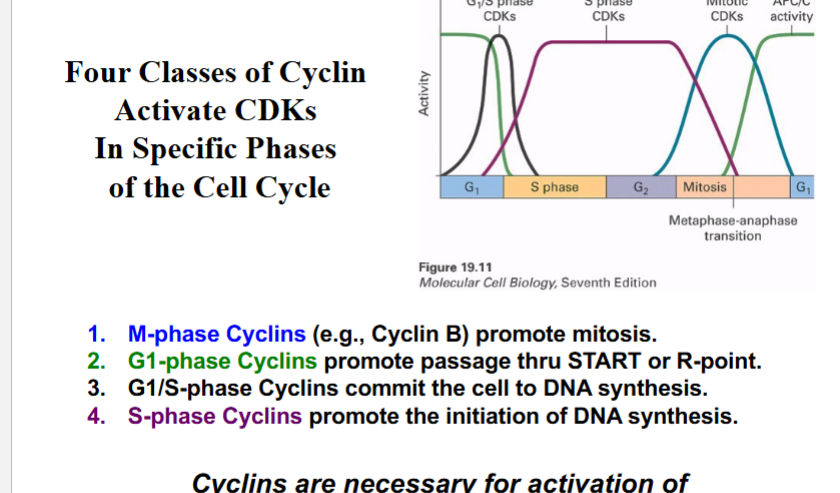
Four Classes of Cyclins
Four Classes of Cyclins
• M-phase Cyclins (e.g., Cyclin B): Partner with CDK1; promote mitosis by stimulating nuclear envelope breakdown, chromosome condensation, mitotic spindle formation, and targeted protein degradation.
• G1-phase Cyclins (e.g., Cyclin D): Partner with CDK4/CDK6; promote passage through START or the R-point. Also inactivate the APC to allow mitotic cyclin to accumulate.
• G1/S-phase Cyclins (e.g., Cyclin E): Partner with CDK2; commit the cell to DNA synthesis.
• S-phase Cyclins (e.g., Cyclin A): Partner with CDK2; promote initiation of DNA synthesis.
Cyclins are required not only for CDK activation but also for substrate specificity — the cyclin subunit determines which target proteins the CDK phosphorylates in a given phase.
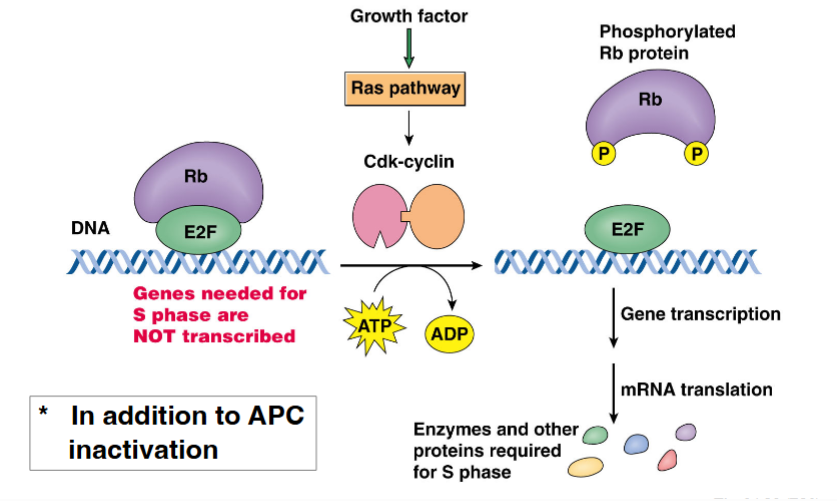
G1-Phase Cyclins, the Rb Protein, and Passage Through the R-Point
G1-Phase Cyclins, the Rb Protein, and Passage Through the R-Point
G1-phase cyclins (Cyclin D) partnered with CDK4/CDK6 play a central role in allowing cells to pass the restriction point. This occurs through regulation of the retinoblastoma protein (Rb):
• In quiescent cells, Rb is unphosphorylated and binds to a transcription factor called E2F, sequestering it and preventing transcription of genes needed for S phase.
• Growth factor signaling (via the Ras pathway) activates Cyclin D-CDK4/6 complexes.
• The Cyclin D-CDK complex phosphorylates Rb, causing it to release E2F.
• Free E2F drives transcription of genes encoding enzymes and proteins required for DNA synthesis (S phase entry).
• This process is the molecular basis of passing the R-point — once Rb is hyperphosphorylated and E2F is permanently active, the cell is committed to entering S phase.
The APC and G1-CDK: A Regulatory Feedback Loop
The APC and G1-CDK: A Regulatory Feedback Loop
There is an elegant regulatory relationship between the APC and G1-Cdk-cyclin complexes:
• At the end of mitosis, the APC is active. It polyubiquitinates mitotic cyclin, which is destroyed by the proteasome. MPF activity drops, and the cell exits mitosis.
• During G1, G1-cyclin-CDK complexes accumulate (driven by growth factor signals), and these complexes phosphorylate and inactivate the APC.
• With APC inactivated, mitotic cyclin is no longer degraded and can accumulate during S and G2.
• Rising mitotic cyclin levels form MPF complexes with CDK, and MPF activity drives the cell into M phase.
• MPF then activates the APC (as part of a positive feedback loop), which destroys mitotic cyclin, causes MPF to collapse, and allows the cell to exit mitosis and re-enter G1.
This feedback loop is what drives the oscillatory, repetitive nature of the cell cycle — rising and falling MPF activity controlled by cyclin synthesis and APC-mediated degradation.
Summary: Converging Lines of Research Define the Master Control Switch
The understanding of cell cycle regulation was built by multiple independent research groups working from the late 1960s through the early 1990s, each using different model systems:
• Rao & Johnson (mammalian heterokaryons): Established the rules — no skipping phases, DNA licensed once, checkpoints exist, diffusible promoting factors exist.
• Hartwell (budding yeast cdc28ts): Identified the CDC28 kinase as the critical molecule at START; made the leap to molecular genetics.
• Nurse (fission yeast cdc2): Identified the conserved CDC2 kinase across species, including the human homolog, revolutionizing how we use model organisms.
• Lohka, Matsui & frog extracts: Demonstrated a diffusible cytoplasmic factor (MPF) drives M phase entry.
• Hunt (sea urchins): Discovered cyclin, the regulatory partner of the master kinase whose oscillating levels drive the cell cycle.
Together, all paths converged on one master kinase complex: MPF = CDK + Cyclin. The cell cycle is driven by the periodic synthesis and destruction of cyclin, which activates and inactivates the CDK, phosphorylating different substrates at each phase to drive the orderly progression from G1 → S → G2 → M and back again.
The Search for a Master Control Switch
The study of the cell cycle has been driven by a series of key experimental observations. Early experiments using cell fusion (heterokaryon experiments) demonstrated that when a G1-phase cell was fused with an M-phase cell, the chromosomes in the G1 nucleus immediately condensed and skipped ahead in the cell cycle. This was a critical observation because it implied the existence of a diffusible cytoplasmic factor originating from the M-phase cell that was potently inducing the onset of M-phase in the other nucleus.
Cytoplasm transfer experiments extended this idea. When cytoplasm from M-phase cells (either from meiosis during frog oogenesis or from mitotic cells) was microinjected into interphase cells, M-phase was strongly induced in those recipient cells. This confirmed that the cytoplasm of M-phase cells contained a powerful, soluble factor driving entry into mitosis.
A crucial piece of evidence came when the same experiment was performed but M-phase cytoplasm was treated with cyclohexamide, a drug that blocks protein synthesis. When protein synthesis was inhibited, the cytoplasm lost its ability to induce M-phase. This strongly suggested that the critical factor driving M-phase was a protein — proteins needed to be continuously synthesized for M-phase onset.
Discovery of Cyclin: Tim Hunt's Sea Urchin Experiments
Discovery of Cyclin: Tim Hunt's Sea Urchin Experiments
Tim Hunt, working at the Marine Biological Laboratory in Woods Hole, Massachusetts, used sea urchin embryos as his model system. Sea urchin eggs are easy to fertilize and allow embryogenesis to be studied in real time. At various time points after fertilization, embryos were collected and analyzed by SDS-PAGE (gel electrophoresis to separate proteins by size).
Hunt noticed one particular polypeptide band that increased in abundance following fertilization and then suddenly disappeared. This periodic appearance and disappearance was striking. He named this protein cyclin, because it cycled — it appeared and then vanished in a repeating pattern tied to cell division.
Cyclin levels peaked just prior to the onset of mitosis, then dropped sharply in the middle of M-phase. When plotted, the dark line representing cyclin concentration correlated closely with the peaks of mitotic activity. Cyclin was later identified as a component of M-Phase Promoting Factor (MPF).
Importantly, Hunt understood the limits of his own data. He explicitly acknowledged in his paper that while the cyclic behavior of cyclin was hard to imagine as unconnected to cell division, there was at that stage no direct evidence of cause and effect. This was a correlation, not proven causation. It would take further experiments to firmly establish that cyclin drives cell cycle progression.
MPF: Composition, Terminology, and the CDK
MPF: Composition, Terminology, and the CDK
M-Phase Promoting Factor (MPF) is a term used specifically in the context of frogs (Xenopus) and mammalian cells, but the molecular machinery it represents is conserved across all eukaryotes. MPF is composed of two components:
• A kinase — whose concentration is relatively constant throughout the cell cycle
• Cyclin — whose concentration is highly variable and oscillates through the cell cycle
The kinase component is known as a Cyclin-Dependent Kinase, abbreviated CDK. This is a critical term to know. The CDK requires cyclin binding to function — without cyclin, the CDK is inactive. Because CDK levels remain relatively stable and cyclin levels fluctuate dramatically, it is the rise and fall of cyclin that drives the oscillating activity of the CDK-cyclin complex (MPF) through the cell cycle.
In yeast, the CDK equivalents are CDC28 (budding yeast) and CDC2 (fission yeast). In frogs and mammals, the CDK in MPF was named the same. This same master kinase — one master kinase — is conserved across very different organisms, reinforcing how fundamental this system is.
Establishing Cause and Effect: Xenopus Frog Egg Extracts
Establishing Cause and Effect: Xenopus Frog Egg Extracts
To move beyond correlation and firmly establish cause and effect for cyclin's role in M-phase entry, researchers turned to Xenopus (frog) egg extracts. Xenopus laevis eggs are extremely large — millimeters in size — making them ideal for biochemical manipulation. Eggs were placed in centrifuge tubes, crushed by centrifugation, and the resulting cytoplasm was collected. This cytoplasmic extract, mixed with nucleoplasm, retains all the molecular machinery necessary to reconstitute mitosis in a test tube.
This system was powerful because researchers could watch chromosomes condense, spindles form, chromosomes align and separate — all the stages of mitosis — happening in a tube under the microscope. Much of this work was done by Murray and Kirschner in the late 1980s and early 1990s.
The Four Key Extract Experiments (Murray & Kirschner, 1989)
The Four Key Extract Experiments (Murray & Kirschner, 1989)
Experiment A — Untreated Extract:
When sperm nuclei were added to an untreated extract, the extract spontaneously entered M-phase and went through repeated cycles of mitosis. Cyclin B levels increased, MPF (kinase) activity increased, early mitotic events occurred (light blue — through metaphase), then late events occurred (orange — anaphase onward), and then cyclin levels fell sharply and the cycle repeated. This established a baseline for normal oscillating mitosis in the system.
Experiment B — RNase-Treated Extract:
The extract was treated with RNase, an enzyme that destroys all mRNA. Without mRNA, there is no protein synthesis. The result: no MPF activity and no cyclin B accumulation. Mitosis did not occur. This confirmed that new protein synthesis is required for M-phase — consistent with the earlier cyclohexamide experiments — and gave researchers a blank slate (no endogenous mRNAs) to work with.
Experiment C — RNase-Treated Extract + Wild-Type Cyclin B mRNA:
Into the blank-slate RNase-treated extract, researchers added back only the mRNA encoding cyclin B. The result was a complete recapitulation of all the mitotic events seen in the untreated extract — cyclin levels rose, MPF activity rose, early and late mitotic events occurred, and cyclin levels fell. Adding back a single mRNA (cyclin B) was sufficient to drive the extract into mitosis. This was a major step: it showed cyclin B is sufficient to trigger M-phase.
Experiment D — RNase-Treated Extract + Non-Degradable Cyclin B mRNA:
In this experiment, a mutant cyclin B mRNA was added — one with a nucleotide sequence change that caused the translated cyclin B protein to lack the ubiquitination signal (destruction box). This cyclin B could not be degraded by proteasomes. The result: the extract entered mitosis (early mitotic events occurred normally), but became permanently arrested in early mitosis — it could not proceed past metaphase into anaphase. This demonstrated that cyclin B degradation is necessary to exit mitosis. Cyclin B must be destroyed for the cell cycle to proceed. Together, experiments C and D showed that cyclin B is both sufficient to enter M-phase and necessary to degrade in order to exit it.
Cyclin Degradation: The Anaphase Promoting Complex (APC)
Cyclin Degradation: The Anaphase Promoting Complex (APC)
Cyclin B is degraded via the ubiquitin-proteasome pathway. Cyclin B is first polyubiquitinated (multiple ubiquitin molecules are attached), and then the polyubiquitinated cyclin is recognized and destroyed by the proteasome. This process of targeted protein degradation was introduced early in the course.
The enzyme responsible for polyubiquitinating cyclin B is a large protein complex called the Anaphase Promoting Complex, or APC. The APC is a ubiquitin ligase — it attaches ubiquitin chains to its target proteins, marking them for destruction. The APC becomes active in the middle of M-phase, leading to rapid cyclin B degradation. When cyclin B is destroyed, CDK can no longer function and the molecular events of mitosis begin to be reversed, allowing the cell to proceed into anaphase and beyond.
What Does Active Mitotic CDK-Cyclin (MPF) Do?
What Does Active Mitotic CDK-Cyclin (MPF) Do?
Before discussing its destruction, it is important to understand what active MPF accomplishes:
• Nuclear envelope breakdown — by phosphorylating the nuclear lamins (intermediate filaments), which causes them to depolymerize and disassemble the nuclear envelope
• Chromosome condensation
• Mitotic spindle formation
• Targeted degradation of specific proteins needed to be removed during mitosis
All of these functions depend on CDK's kinase activity — it phosphorylates target proteins to trigger these events. When cyclin B is degraded by the APC, CDK loses its activity, and these mitotic events are no longer sustained, allowing the cell to exit mitosis.
The APC and Anaphase: Securin, Separase, and Cohesin
The APC and Anaphase: Securin, Separase, and Cohesin
The APC does not only degrade cyclin B — it has a second critical role in triggering the key event of anaphase: sister chromatid separation.
During prophase through metaphase, sister chromatids are physically held together by a protein called cohesin. This cohesion must be broken at the onset of anaphase so that sister chromatids can be pulled to opposite poles. The protease responsible for cleaving cohesin is called separase.
However, separase cannot be allowed to function prematurely. If separase were active during prometaphase or metaphase, it would destroy cohesin too early, causing sister chromatid pairs to fall apart before they are properly aligned on the metaphase plate — producing chaotic, unviable cells. To prevent premature activity, separase is held inactive by binding to a protein called securin. Securin physically sequesters and inhibits separase until the appropriate moment.
At the metaphase-to-anaphase transition, once chromosomes are properly aligned, the APC ubiquitinates securin, targeting it for proteasomal degradation. When securin is destroyed, separase is liberated and can now cleave cohesin. Sister chromatids separate in anaphase A, pulled to opposite poles by the mitotic spindle. This elegant control mechanism ensures that sister chromatid separation happens only at the correct time.
Exiting Mitosis: Inactivating the APC via G1 Cyclin-CDK
Exiting Mitosis: Inactivating the APC via G1 Cyclin-CDK
After anaphase is complete and the cell needs to transition back into G1 (interphase), the APC must be inactivated. Mitosis is normally the shortest phase of the cell cycle; the cell needs to exit it efficiently. The molecular switch to inactivate the APC involves a CDK bound to a G1 cyclin — a different cyclin than the mitotic cyclin B used during M-phase entry. This G1 cyclin-CDK complex phosphorylates and inactivates the APC, shutting it down and allowing interphase to resume and new mitotic cyclin to accumulate for the next cycle.
The Cyclin Zoo: Multiple Cyclins and CDKs
The Cyclin Zoo: Multiple Cyclins and CDKsYeast vs. Mammalian Cells
In yeast (both budding and fission yeast), there is a single CDK that partners with multiple different cyclins at different stages of the cell cycle. The names of individual yeast cyclins (Cln1, Cln2, Cln3, Clb1-6) are not essential to memorize — what matters is the concept: one CDK, many cyclins, each appearing at a specific time.
In mammalian cells, the system is more complex: there are both multiple CDKs and multiple cyclins. The CDKs and cyclins pair up in specific combinations to regulate specific phases. The concept remains the same, but the cast of molecular players is larger.
Four Categories of Cyclins to Know
There are four functionally distinct categories of cyclin, each acting at a specific phase:
• M-phase cyclins (e.g., Cyclin B) — promote entry into and progression through mitosis. Cyclin B is the most famous and important to remember by name.
• G1-phase cyclins — promote passage through the restriction/start point (R-point or START), and also inactivate the APC to allow new mitotic cyclin accumulation.
• G1/S-phase cyclins — commit the cell to DNA synthesis (S-phase entry).
• S-phase cyclins — promote the actual initiation of DNA synthesis.
A key principle is that cyclin binding not only activates the CDK but also confers substrate specificity. Changing the cyclin partner changes which proteins the CDK will phosphorylate. This is how a single CDK can have different effects at different points in the cell cycle.
G1 Cyclins and the Restriction Point: The Rb/E2F Pathway
G1 Cyclins and the Restriction Point: The Rb/E2F Pathway
G1 cyclins are particularly relevant to cancer biology. Their role in promoting passage through the restriction point (R-point in mammals, START in yeast) is mediated through the following pathway:
• A transcription factor called E2F is bound to DNA but is held inactive by its association with the retinoblastoma protein (Rb).
• When growth factors are present, they activate the Ras signaling pathway, which in turn leads to the expression and activation of G1 cyclin-CDK complexes.
• The activated CDK phosphorylates Rb. Phosphorylated Rb releases E2F.
• Free E2F activates transcription of genes encoding enzymes and proteins required for S-phase and DNA synthesis.
This pathway illustrates how G1 cyclins link extracellular signals (growth factors) to cell cycle commitment. The CDK involved is CDK4, which phosphorylates Rb to release E2F. This pathway will be revisited when discussing cancer, as Rb is a classic tumor suppressor and dysfunction in this pathway is common in cancer cells.
Regulation of CDK Activity: Three Mechanisms
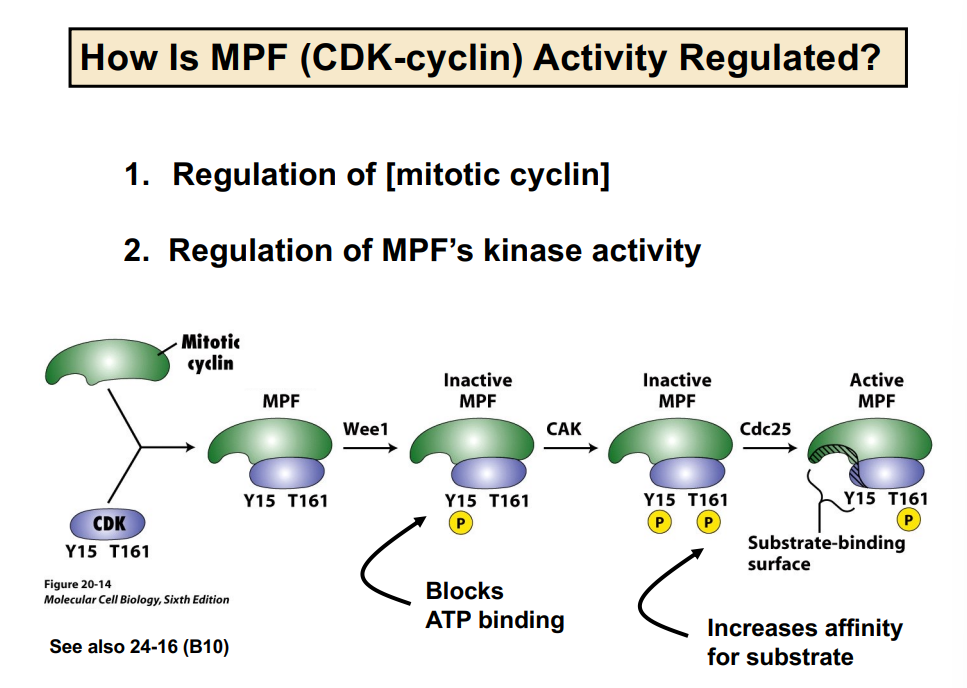
Regulation of CDK Activity: Three Mechanisms
Cell cycle progression is tightly controlled through three main mechanisms of regulating CDK (MPF) activity:
Mechanism 1 — Regulation of Mitotic Cyclin Concentration
As already covered, cyclin B is synthesized during S and G2 phases and is degraded by the APC during M-phase. The rise and fall of cyclin concentration directly controls the rise and fall of CDK activity. Degrading mitotic cyclin prevents entry into mitosis; destroying it is required to exit mitosis.
Mechanism 2 — Regulation of CDK Kinase Activity via Phosphorylation
Even when cyclin is present and bound to CDK, the kinase can still be held inactive by inhibitory phosphorylation. The regulation works as follows:
• Wee1 is a kinase that phosphorylates CDK at tyrosine-15 (Y15). This phosphorylation blocks ATP binding to the CDK, rendering it incapable of phosphorylating substrates — it is an inhibitory phosphorylation. MPF is now inactive.
• CAK (Cyclin-Activating Kinase) phosphorylates CDK at threonine-161 (T161). This phosphorylation increases the affinity of the CDK for its substrates (increases enzyme-substrate binding). Note: amino acid numbers not required for this course.
• Cdc25 is a phosphatase that removes the inhibitory phosphate from Y15, thereby activating MPF. With Wee1's phosphate removed and CAK's activating phosphate present, MPF is fully active and can phosphorylate its substrates.
The key takeaway: Wee1 inhibits CDK (kinase); Cdc25 activates CDK (phosphatase). They oppose each other and together control when the CDK is active.
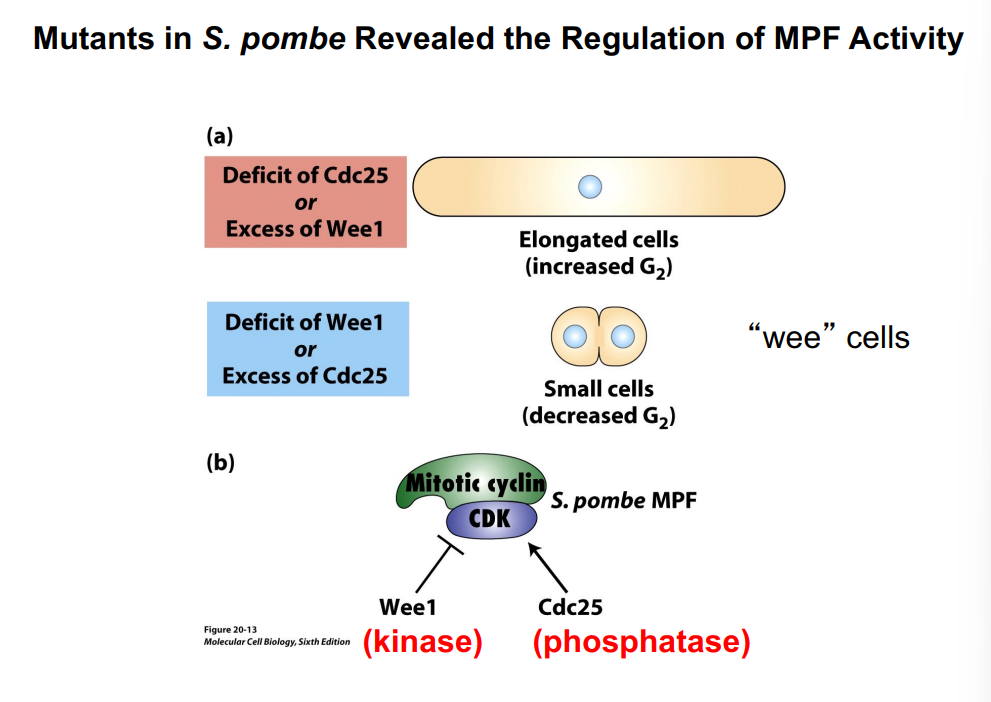
Evidence from S. pombe Mutants
Evidence from S. pombe Mutants
The roles of Wee1 and Cdc25 were established through genetic analysis of fission yeast (Schizosaccharomyces pombe) mutants, beginning in the 1970s. S. pombe is a rod-shaped yeast that grows by elongating and then dividing down the center:
• Excess Wee1 kinase activity → highly phosphorylated (inhibited) CDK → cells cannot enter mitosis → cells keep growing and elongating → abnormally large, elongated cells
• Deficit of Wee1 → CDK not inhibited → cells enter mitosis prematurely → cells divide too early, before reaching normal size → abnormally small "wee" cells
• Deficit of Cdc25 (same as excess Wee1) → CDK remains inhibited → elongated cells
• Excess Cdc25 (same as deficit of Wee1) → CDK prematurely active → premature mitosis → small "wee" cells
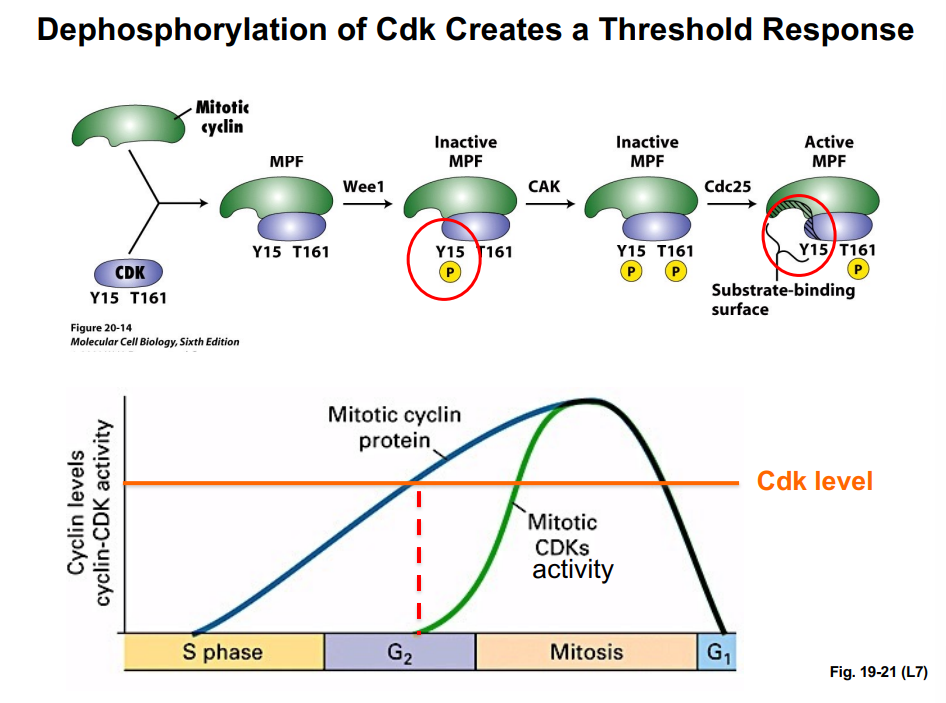
Threshold Response and Positive Feedback Loops
Threshold Response and Positive Feedback Loops
If one plots mitotic cyclin concentration versus CDK activity over time, a critical observation emerges: CDK activity does not rise in direct proportion to cyclin levels. There is a delay — CDK activity lags behind cyclin accumulation. Only after cyclin levels cross a threshold concentration does CDK activity suddenly jump up. This is a threshold response.
Once CDK becomes active, two positive feedback loops accelerate activation:
• Active CDK phosphorylates Cdc25, increasing Cdc25 phosphatase activity, which removes more inhibitory phosphates from CDK — generating more active CDK. More active CDK activates more Cdc25, which activates more CDK (positive feedback).
• Active CDK also phosphorylates and inactivates Wee1 kinase. Inactivating an inhibitor (Wee1) produces the same net effect as activating an activator — it further increases CDK activity. Inhibiting an inhibitor = positive effect.
These positive feedback loops are why the cell cycle has a clean, switch-like entry into mitosis. Without them, if cyclin levels fluctuated slightly, the cell might partially enter mitosis, then stall. Instead, once the cyclin threshold is reached, the feedback loops create a rapid, all-or-nothing flip into M-phase — like flipping a light switch, not slowly dimming a light.
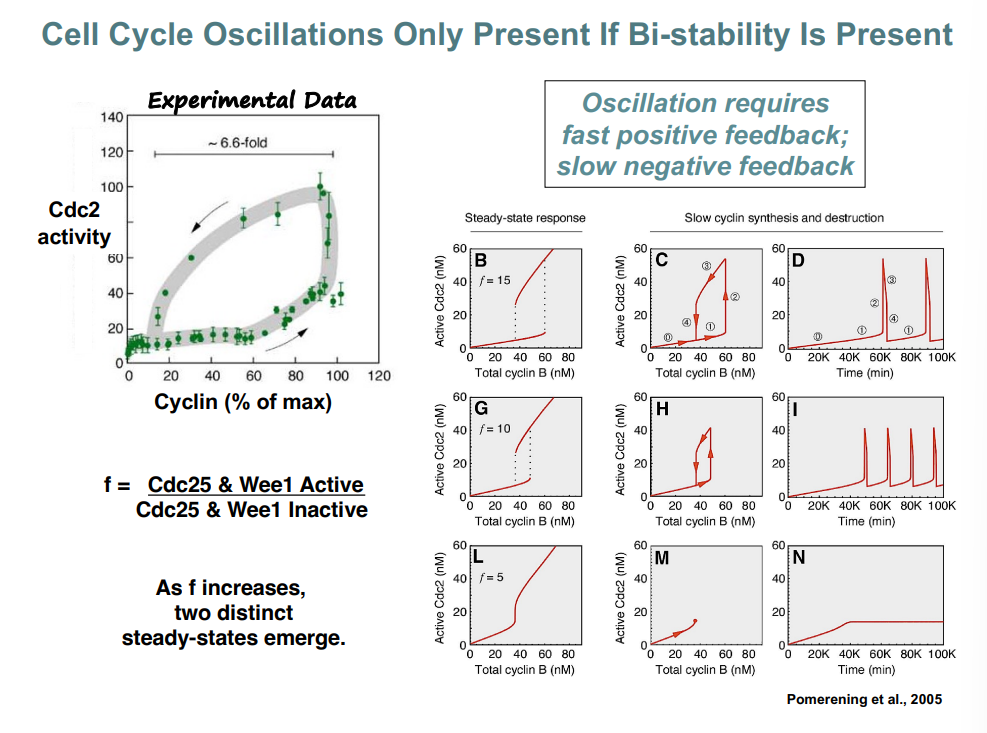
Bistability, Hysteresis, and Cell Cycle Oscillations (Pomerening et al., 2005)
Bistability, Hysteresis, and Cell Cycle Oscillations (Pomerening et al., 2005)
A highly regarded 2005 study by Pomerening et al. used computer modeling combined with experimental data to characterize the behavior of the CDK-cyclin system. Graphs were generated plotting active Cdc2 (CDK) activity on the y-axis against total cyclin B concentration on the x-axis.
Key findings from the graphs:
• When regulatory proteins (Cdc25 and Wee1) are present and active (represented by the variable F, the ratio of active to inactive Cdc25 and Wee1), the system does not show a linear response. Instead, there is a break point — at a certain cyclin B threshold, CDK activity jumps discontinuously from a low stable state to a high stable state.
• There are two distinct stable states — an "off" state (low CDK activity) and an "on" state (high CDK activity). The transition between these two states is the switch.
• The transition to the on state occurs at a different (higher) cyclin B concentration than the transition back to the off state. This separation between the "turn on" and "turn off" thresholds is called hysteresis — switch-like behavior between two stable states. The term comes from engineering.
• As F increases (more active regulatory proteins), the gap between the two thresholds (the hysteresis window) widens. This buffering means small random fluctuations in cyclin B concentration will not accidentally flip the cell into or out of mitosis — the system is more noise-resistant.
When CDK activity is plotted over time (not just versus cyclin concentration), peaks of CDK activity appear — corresponding to each round of mitosis. The shape of the oscillation (its period and frequency) is influenced by the regulatory proteins. By tuning the amount of active Cdc25 and Wee1, the cell can control how often it divides — the frequency of the cell cycle.
An important note: for oscillations to occur, both fast positive feedback (from Cdc25/Wee1 regulation — rapid activation) and slow negative feedback (from the APC — delayed destruction of cyclin) must be present. The APC's role in providing negative feedback (degrading cyclin B, thus turning off the system after mitosis) is the topic to be continued in subsequent lectures.
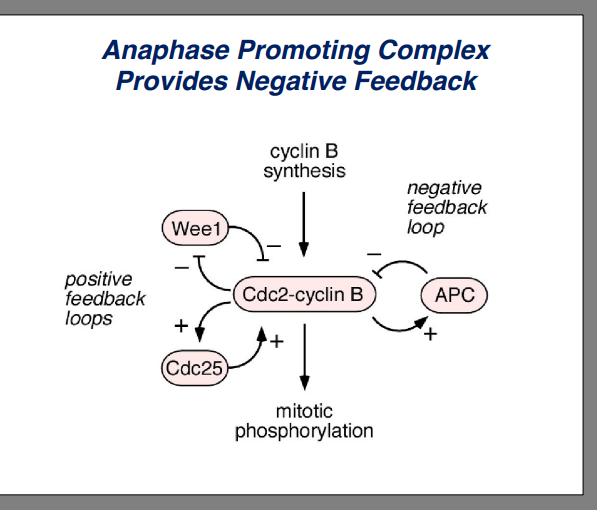
MPF (CDK-Cyclin) Activity and Regulation
MPF (CDK-Cyclin) Activity and RegulationOverview of MPF Regulation
Maturation Promoting Factor (MPF) is a complex of a cyclin-dependent kinase (CDK) and a mitotic cyclin (Cyclin B). The activity of this complex is regulated in multiple ways, and understanding this regulation is central to understanding how cells control entry into mitosis.
Mechanism 1: Regulation of Mitotic Cyclin Concentration
• CDK levels remain relatively constant throughout the cell cycle, but CDK activity depends on the binding of a cyclin partner.
• Mitotic cyclin (Cyclin B) accumulates progressively through interphase and is then rapidly degraded at the end of mitosis, driving the oscillation in CDK activity.
• Even when cyclin binds CDK, the complex is not immediately active — additional regulation is required.
Mechanism 2: Regulation of CDK Kinase Activity via Phosphorylation
After CDK binds mitotic cyclin to form MPF, the complex undergoes a series of phosphorylation events that determine whether it is active or inactive:
• Wee1 kinase phosphorylates CDK at tyrosine-15 (Y15), which blocks ATP binding and renders MPF inactive. This is an inhibitory phosphorylation event.
• CAK (CDK-activating kinase) phosphorylates CDK at threonine-161 (T161), increasing the affinity of CDK for its substrates. However, the complex remains inactive because Y15 is still phosphorylated.
• Cdc25 phosphatase removes the inhibitory phosphate from Y15, allowing MPF to become fully active. Cdc25 is therefore a critical activator of MPF and entry into mitosis.
• The result is a threshold response: CDK activity does not gradually increase with rising cyclin levels — instead, it remains off until a sufficient threshold of cyclin is reached, at which point activity switches on abruptly.
Evidence from S. pombe Mutants
Experiments in the fission yeast Schizosaccharomyces pombe helped reveal the roles of Wee1 and Cdc25:
• A deficit of Cdc25 or an excess of Wee1 results in elongated cells, because the cells spend an extended time in G2 before enough MPF activity accumulates to trigger mitosis.
• Conversely, a deficit of Wee1 or excess of Cdc25 produces abnormally small cells ("wee" cells) because MPF becomes active prematurely — cells enter mitosis before they have grown to normal size.
• These findings confirmed that Wee1 (a kinase) inhibits MPF, while Cdc25 (a phosphatase) activates it. Wherever a kinase acts in cell biology, an opposing phosphatase is expected to balance it.
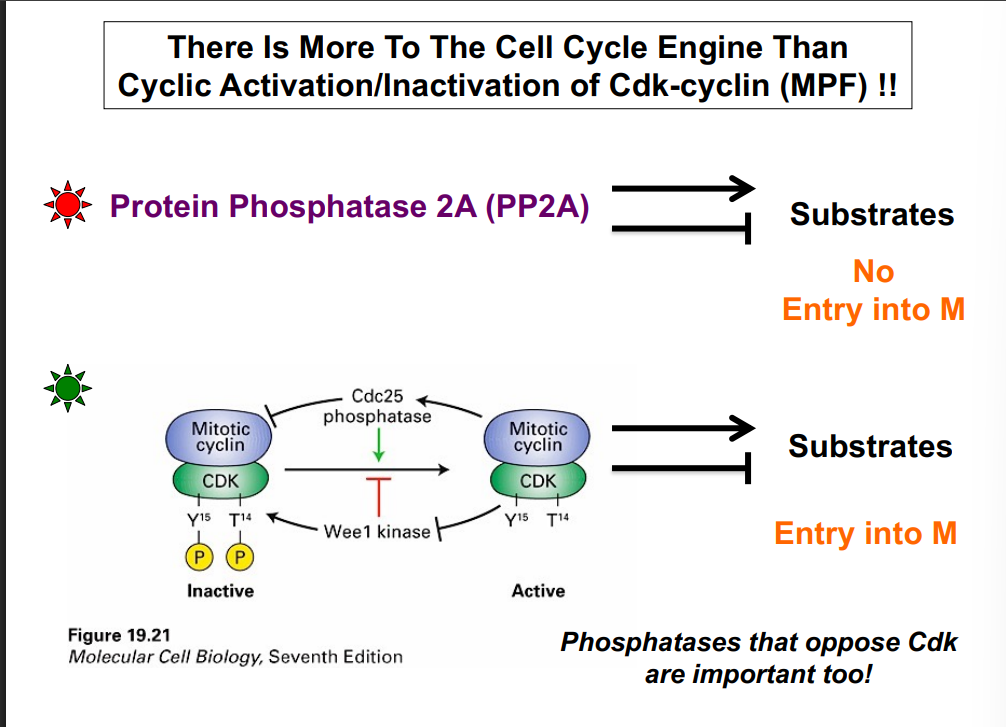
Positive Feedback Loop and Bistability
Positive Feedback Loop and BistabilityMPF Activation Creates a Positive Feedback Loop
• Once a small amount of MPF becomes active, it phosphorylates and activates more Cdc25, which in turn removes the inhibitory phosphate from more MPF molecules — creating a rapid amplification of activity.
• Simultaneously, active MPF phosphorylates and inhibits Wee1, preventing Wee1 from putting the brake back on.
• This double positive feedback (activating the activator and inhibiting the inhibitor) means that once a threshold of cyclin B is crossed, CDK activity rises very steeply and rapidly — an all-or-nothing switch.
Bistability: Two Stable States
Computer modeling by Pomerening et al. (2005) explored how the regulatory proteins Cdc25 and Wee1 affect the system's behavior:
• Without Cdc25 and Wee1 activity (low f factor): CDK activity increases gradually and linearly with rising cyclin B concentration. This does not match biological reality, where CDK activity appears as a sharp burst.
• With regulatory proteins active (high f factor): The system becomes bistable — it has two distinct stable states: a fully OFF state (low CDC2 activity) and a fully ON state (high CDC2 activity). The transition between these states is abrupt.
• Having Cdc25 and Wee1 active also buffers the system against molecular noise. Without the regulatory proteins, small fluctuations in cyclin B concentration (e.g., between 35–40 nM) could unpredictably flip CDK activity on or off. With the proteins active, CDK activity remains stable across a much wider range of cyclin B concentrations before switching states.
Experimental Confirmation of Bistability
Cellular data confirmed the computer model predictions:
• Measurements taken every 2 minutes in live cells tracked CDC2 activity against cyclin B concentration (expressed as a percentage of maximum expression).
• The data formed a loop: CDC2 activity was low while cyclin built up, then abruptly jumped to high activity, and then gradually decreased back to a low state — exactly matching the bistable model.
• When CDC2 activity was plotted over time (rather than against cyclin concentration), sharp spikes in activity were visible each cell cycle — confirming that CDK activity oscillates in a rhythmic pattern, making CDK a biological oscillator.
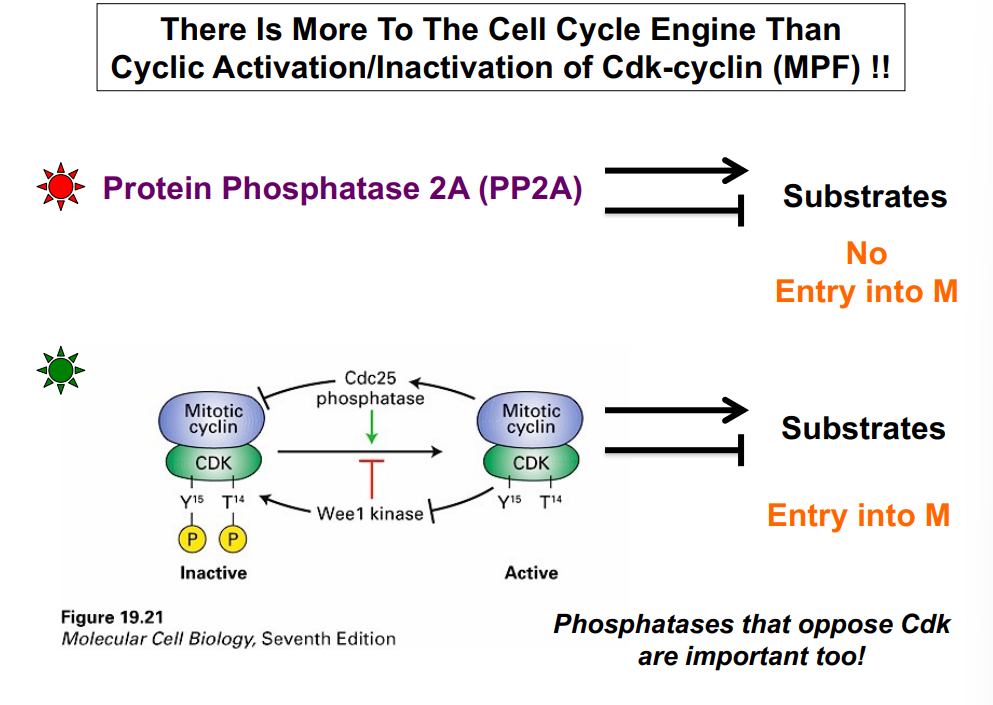
Cell Cycle Oscillation: Positive and Negative Feedback
Cell Cycle Oscillation: Positive and Negative FeedbackRequirements for Oscillation
A biological oscillator requires two key components that are temporally separated:
• Fast positive feedback: Provided by Cdc25 (activating MPF) and the inhibition of Wee1 (removing the brake on MPF). This rapidly amplifies CDK activity once the threshold is crossed.
• Slow negative feedback: Provided by the Anaphase Promoting Complex (APC/C), which acts after the positive feedback. The APC/C is an E3 ubiquitin ligase that ubiquitinates mitotic cyclin (Cyclin B), targeting it for proteasomal degradation. Loss of cyclin B causes loss of CDK activity, completing the oscillation.
• The timing of these events — positive feedback first, then negative feedback — is what generates the oscillatory behavior. This principle applies universally across biological oscillators.
• The presence and activity level of these regulatory proteins can also adjust the frequency at which mitosis is initiated — more regulation leads to better-spaced, temporally defined peaks of CDK activity.
Role of Phosphatases: PP2A
The cell cycle engine involves more than just CDK-cyclin oscillation. Phosphatases that oppose CDKs are also critical:
• Protein Phosphatase 2A (PP2A) works in opposition to CDK in many cells. It dephosphorylates CDK substrates, preventing or reversing phosphorylation events needed for mitotic entry.
• In many cells, PP2A prevents entry into M phase. It can also assist with exit from M phase in some cell types.
• The general principle is that wherever kinases act, phosphatases will be nearby to counterbalance them. The cell continuously balances phosphorylation and dephosphorylation events on the same amino acid residues.
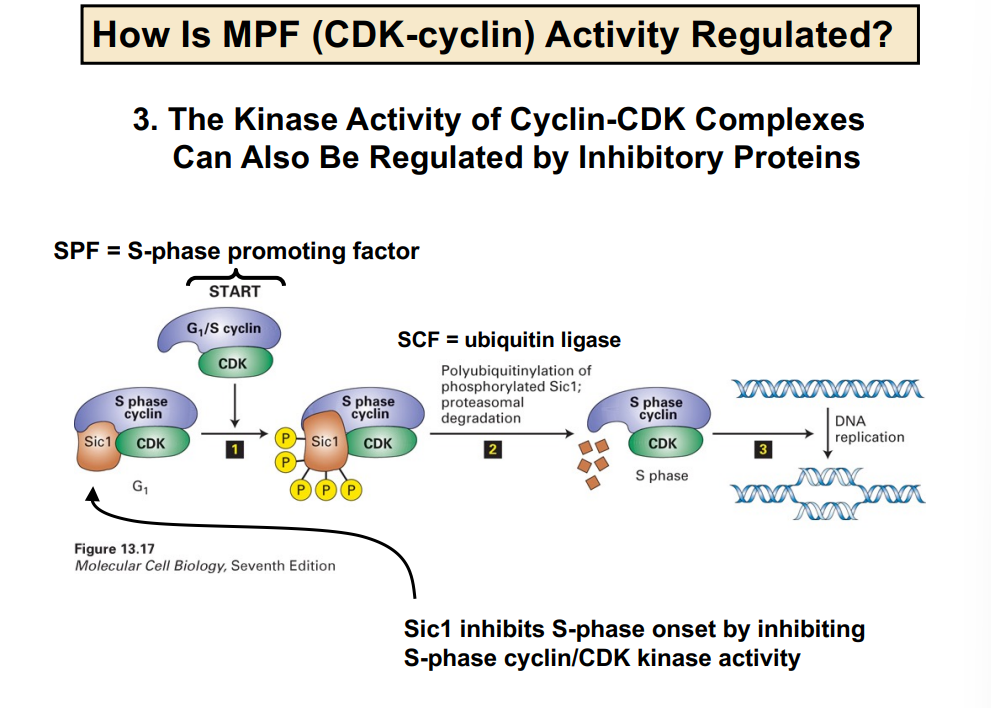
Mechanism 3: Regulation by Inhibitory Proteins
Mechanism 3: Regulation by Inhibitory ProteinsS Phase Promoting Factor (SPF) and the Rao & Johnson Experiment
A classic heterokaryon (cell fusion) experiment by Rao and Johnson revealed the existence of a diffusible S phase promoting factor:
• When an S phase cell was fused with a G1 cell, the G1 nucleus entered S phase faster than expected — it was accelerated into S phase by something present in the S phase cytoplasm.
• This was demonstrated by comparing the mitotic index (percentage of cells visibly in M phase) over time for different heterokaryon combinations: S/S homokaryons, G1/G1 homokaryons, and G1/S heterokaryons.
• The G1/S heterokaryon did not behave like the slower G1/G1 combination. Instead, it entered mitosis at a time intermediate between the two homokaryons, demonstrating that the S phase cytoplasm was pulling the G1 nucleus forward in the cell cycle.
• This led to the hypothesis of a diffusible S phase promoting factor (SPF) present at or past the restriction point (R-point). The molecular identity of SPF was not determined by these experiments alone — it was a conceptual hypothesis confirmed later when cell cycle molecules were identified.
Molecular Identity of SPF: G1/S Cyclin-CDK and Sic1
SPF was later identified as a G1/S cyclin-CDK complex. This complex drives entry into S phase through protein degradation:
• Sic1 is an inhibitory protein that binds to the S phase cyclin-CDK complex and prevents it from initiating DNA replication. As long as Sic1 is bound and active, S phase cannot begin.
• The G1/S cyclin-CDK complex (SPF) phosphorylates Sic1. Once Sic1 is phosphorylated, it is recognized by the SCF ubiquitin ligase complex, ubiquitinated, and degraded by the proteasome.
• SCF functions analogously to the Anaphase Promoting Complex, but it operates at the G1/S transition rather than during anaphase. In both cases, ubiquitin-mediated protein degradation is essential.
• Once Sic1 is degraded, the S phase cyclin-CDK complex is free and active, and DNA replication can commence.
• This reveals the third mechanism of CDK regulation: expression and regulated degradation of inhibitory proteins. Summary of the three mechanisms: (1) controlling cyclin concentration, (2) controlling CDK phosphorylation state, and (3) expressing and degrading inhibitory proteins.
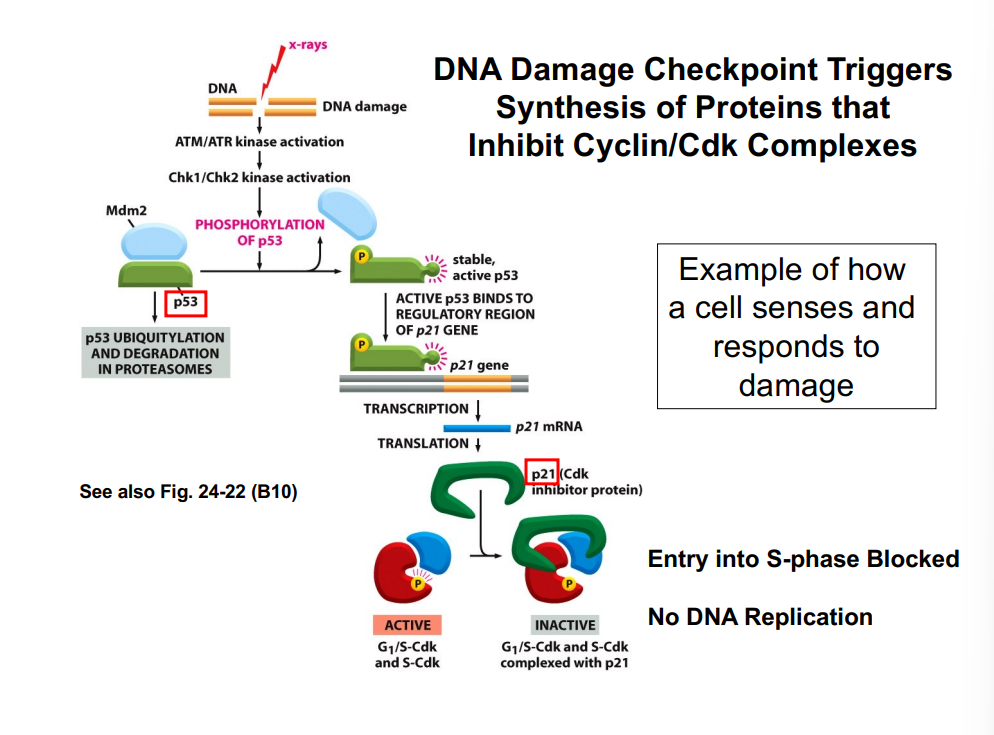
Cell Cycle Checkpoints
Cell Cycle CheckpointsWhat Is a Checkpoint?
A checkpoint is a point in the cell cycle at which progression pauses until a specific condition is met. Checkpoints serve as quality control mechanisms — they ensure that one phase of the cell cycle is completed correctly before the next begins. Important terminology:
• Checkpoint ON = cell cycle is PAUSED (the checkpoint is actively halting progression).
• Checkpoint OFF = cell cycle is PROCEEDING (the checkpoint condition has been met and the block is removed).
Overview of Cell Cycle Checkpoints
There are multiple checkpoints distributed throughout the cell cycle, each monitoring a different condition:
• Start/Restriction Point Checkpoint (G1): Evaluates whether the environment is favorable for division. In animal cells, this includes the presence of growth factors. In yeast, it checks whether the cell is large enough to accommodate the replicated genome. It also monitors DNA integrity.
• G2/M Checkpoint: Verifies that all DNA has been fully replicated before the cell enters mitosis. A cell must not proceed into mitosis with under-replicated chromosomes, as this would result in daughter cells with incomplete genomes.
• Spindle Assembly Checkpoint (SAC): Ensures that microtubules from the mitotic spindle have attached to all kinetochores before anaphase begins. This guarantees equal segregation of sister chromatids.

DNA Damage Checkpoint: p53 and p21
DNA Damage Checkpoint: p53 and p21
The DNA damage checkpoint provides a clear example of how the cell senses damage and responds by arresting the cell cycle:
• Double-stranded DNA breaks (induced by X-rays or other genotoxic agents) are sensed by the cell, triggering a kinase cascade involving ATM/ATR and Chk1/Chk2 kinases.
• p53 is normally bound to the protein Mdm2, which promotes its ubiquitination and proteasomal degradation — keeping p53 levels low in undamaged cells.
• Upon DNA damage, the kinase cascade phosphorylates p53. Phosphorylated p53 dissociates from Mdm2, is stabilized, and becomes transcriptionally active.
• p53 acts as a transcription factor and drives expression of the gene encoding p21.
• p21 is a CDK inhibitory protein, functionally analogous to Sic1. p21 binds and inactivates G1/S and S phase cyclin-CDK complexes, blocking entry into S phase and halting DNA replication.
• This arrest is beneficial: it gives the cell time to repair the double-stranded breaks using DNA repair mechanisms before attempting replication. This is a checkpoint in action — not permanent cell cycle arrest, but a pause that allows repair.
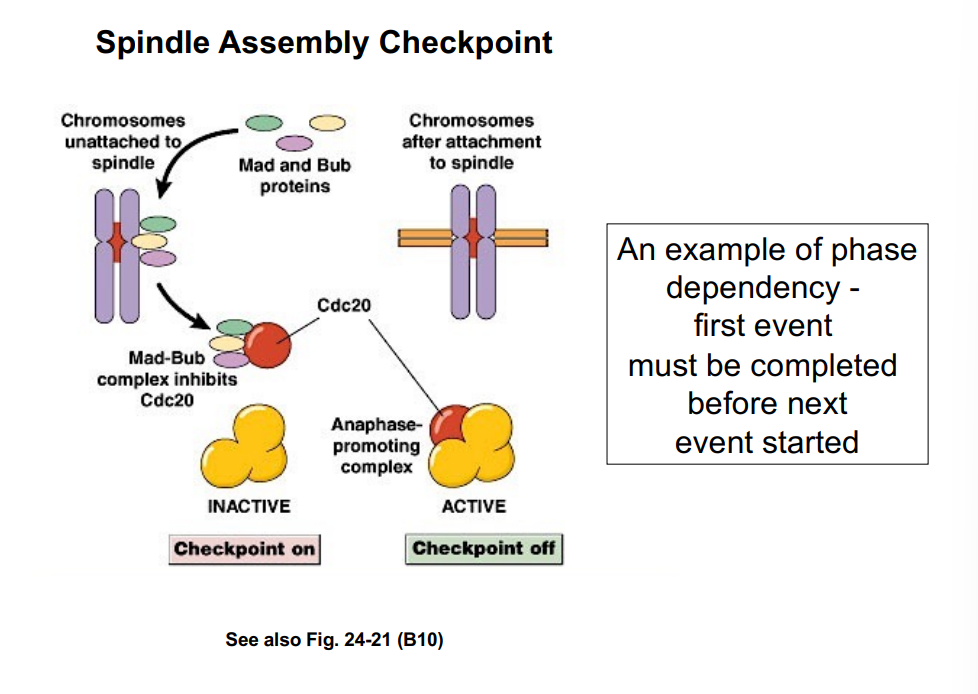
Spindle Assembly Checkpoint (SAC)
Spindle Assembly Checkpoint (SAC)
The spindle assembly checkpoint is a key example of phase dependency — one event in the cell cycle must be completed before the next event can begin:
• At each kinetochore, there are two categories of proteins: Mad proteins and Bub proteins. When chromosomes are not yet attached to the spindle, these proteins are actively bound to the kinetochore.
• Cdc20 is a co-activator required to activate the Anaphase Promoting Complex (APC/C). While Mad and Bub proteins are bound to the kinetochore, they signal to Cdc20 and keep it sequestered — preventing APC/C activation.
• With the APC/C inactive, mitotic cyclin is not degraded and sister chromatids are not separated. The cell cycle is paused — the checkpoint is ON.
• Once microtubules attach to all kinetochores, the Mad and Bub proteins are displaced. Cdc20 is now free to bind and activate the APC/C. The APC/C then ubiquitinates mitotic cyclin, which is degraded — CDK activity falls and anaphase proceeds.
• The checkpoint is now OFF, meaning the cell cycle resumes. The whole system ensures that sister chromatid separation (anaphase) cannot begin until every chromosome is properly attached to the spindle — preventing chromosome mis-segregation.
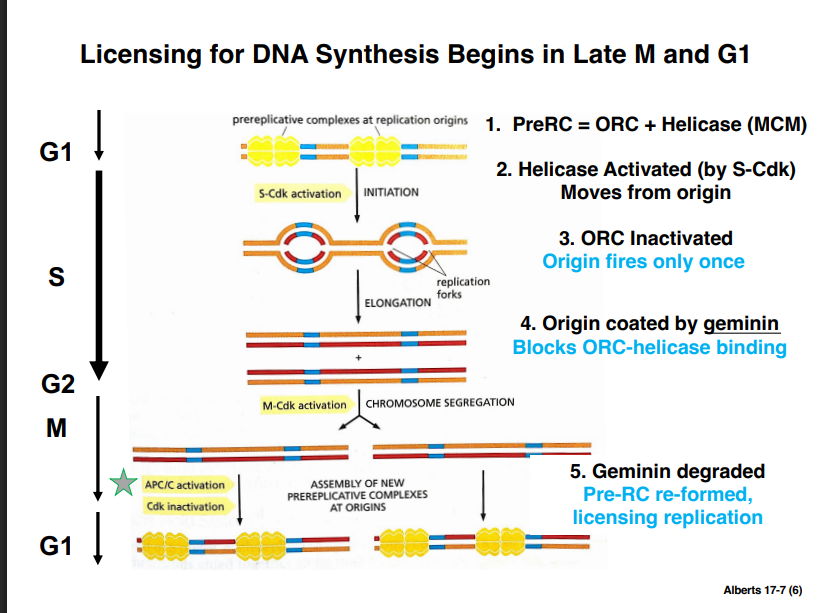
DNA Licensing: Replication Only Once Per Cell Cycle
DNA Licensing: Replication Only Once Per Cell CycleThe Problem: Preventing Re-Replication
A critical problem the cell must solve is ensuring that DNA replicates exactly once per cell cycle. Multiple rounds of replication without mitosis would produce cells with abnormally high DNA content — a cellular disaster.
• Evidence from the Rao and Johnson S/G2 fusion experiment showed that a G2 nucleus, even in the presence of an S phase nucleus, does not re-enter S phase. The G2 nucleus waits for the S nucleus to finish and then both progress together into mitosis.
• This demonstrated that the cell cycle only moves forward, not backward, and that DNA is "licensed" to replicate only once per cell cycle.
Origins of Replication and the Pre-Replication Complex (Pre-RC)
DNA replication in eukaryotes begins at multiple origins of replication, which are hundreds of base pairs long and enriched in A-T base pairs (which have only two hydrogen bonds, making them easier to unwind). Key features:
• In eukaryotes, clusters of origins activate simultaneously. Not all regions of a chromosome replicate at the same time — timing depends on how tightly the DNA is packaged. Highly compacted chromatin must first be opened before the replication machinery can access it.
• The Origin Recognition Complex (ORC) marks each origin of replication throughout the cell cycle. In G1, the ORC recruits a helicase (part of the MCM protein family) to form the Pre-Replication Complex (Pre-RC). This licenses the origin for one round of replication.
Steps of DNA Licensing
The licensing system involves a sequence of events that ensures each origin fires only once:
• Step 1 — Pre-RC formation: In G1, the ORC binds the helicase (MCM proteins) at each origin of replication, forming the Pre-RC. The DNA is now licensed to replicate.
• Step 2 — Helicase activation: At the onset of S phase, the S phase CDK complex phosphorylates components at the origin, activating the helicase. The activated helicase unwinds the DNA, creating two replication forks that move away from the origin in opposite directions. DNA polymerases synthesize new strands behind each fork.
• Step 3 — ORC inactivation: As a result of the same S-CDK phosphorylation events, the ORC is inactivated after firing. Because the helicase has moved away and the ORC is inactivated, each origin can fire only once — it cannot re-initiate replication on its own.
• Step 4 — Geminin blocks re-licensing: After replication, the replicated DNA becomes coated with a protein called geminin. Geminin sterically blocks the helicase from re-associating with the ORC, preventing a new Pre-RC from forming. This ensures no origin can be re-activated within the same cell cycle.
• Step 5 — Geminin degradation re-licenses DNA: During M phase, the APC/C becomes active and ubiquitinates geminin, which is then degraded by the proteasome. With geminin gone, the ORC can now rebind the helicase at each origin, re-forming the Pre-RC. As the cell exits M phase and enters G1 of the next cycle, the DNA is once again licensed to replicate.
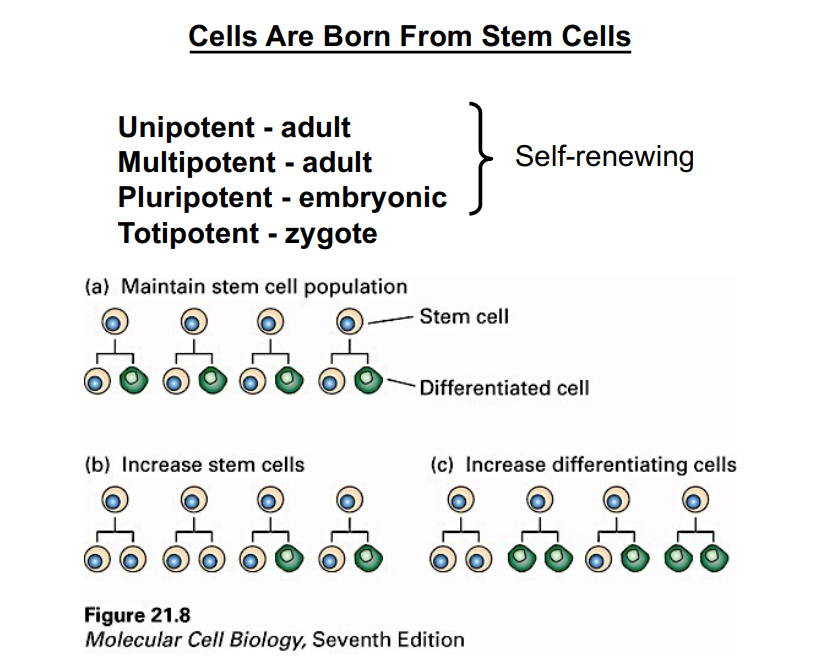
Cell Birth (Proliferation)
Cell Birth (Proliferation)
A. Growth vs. Proliferation
Cell growth refers to an increase in cell size and mass. Cell proliferation refers to the multiplication of cells — the actual increase in cell number through division.
B. Symmetric vs. Asymmetric Division
• Symmetric division: Both daughter cells are of equivalent size following division.
• Asymmetric division: The cell does not divide exactly in half. One daughter cell may be two-thirds the size of the mother cell, while the other is only one-third. One may grow, or one may remain small.
• Cell lineage: When a series of cell replications occurs, successive generations of cells form a family tree. The cells within this family tree that share a common ancestor cell are collectively called a cell lineage — defined by which cell is derived from which predecessor.
C. Stem Cells
In humans, new cells arise from stem cells. Stem cells are self-renewing cell populations, meaning that when a stem cell divides, it produces at least one copy of itself (another stem cell) along with potentially a differentiated cell. Differentiated cells are specialized cells that carry out specific functions and are no longer stem cells.
Stem cell populations are flexible:
• Populations can expand by producing additional stem cells from each division.
• Populations can decrease when stem cells begin producing two differentiated daughter cells instead of one stem cell and one differentiated cell. The population persists as long as at least some cells are still producing a stem cell for the next generation.
Types of Stem Cells:
• Pluripotent (embryonic): Can produce any cell type in the body. Can generate all three germ layers (ectoderm, mesoderm, endoderm) during embryogenesis.
• Multipotent (adult): Can produce different cell types, but restricted to a specific cell lineage. Example: hematopoietic stem cells produce various types of blood cells.
• Unipotent (adult): Can produce only one type of differentiated cell, but still self-renewing (produces another stem cell plus that one type of differentiated cell).
• Totipotent (zygote): The zygote is totipotent, meaning it can give rise to all cell types including extraembryonic tissues. However, the zygote is NOT a stem cell because it is not self-renewing — it does not produce more zygotes.
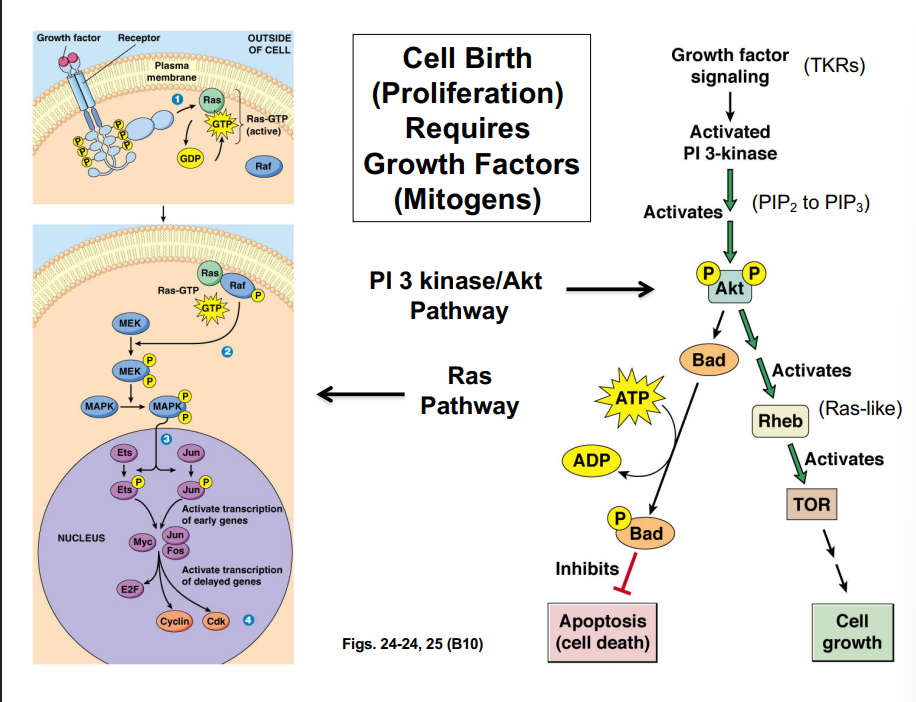
Signaling Pathways Required for Cell Birth
Signaling Pathways Required for Cell Birth
Two major signaling pathways are simultaneously required for cell proliferation: the RAS pathway and the PI3 kinase/AKT pathway. Both are activated by growth factors called mitogens (growth factors that specifically stimulate cell proliferation) binding to tyrosine kinase receptors (TKRs).
A. The RAS Signaling Pathway
• RAS is a small monomeric G protein (GTPase) that acts as a molecular switch.
• A ligand (mitogen) binds an enzyme-linked receptor (tyrosine kinase receptor). The receptor is activated and undergoes autophosphorylation.
• An adapter protein binds the phosphorylated cytoplasmic domain of the receptor. A GEF (guanine nucleotide exchange factor) then exchanges GDP for GTP on the RAS protein, making RAS active.
• Active RAS-GTP leads to activation of MAP kinase cascades (Mitogen-Activated Protein kinases, not microtubule-associated proteins). These MAP kinases phosphorylate proteins that activate transcription factors.
• The three key early-acting transcription factors to know are: Myc, Jun, and Fos. These activate transcription of proteins needed for cell cycle progression, including Cyclin and CDK.
• The transcription factors also ultimately drive expression of E2F, which further promotes cell cycle entry.
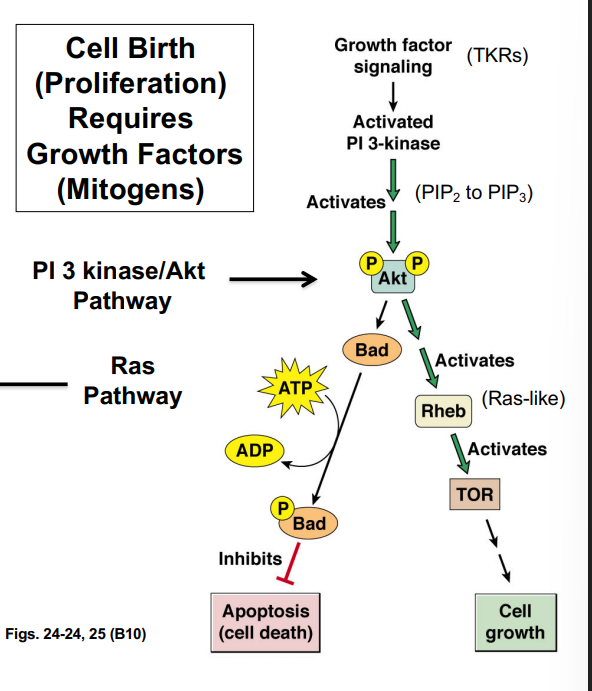
The PI3 Kinase / AKT Pathway
The PI3 Kinase / AKT Pathway
• Growth factors also activate different tyrosine kinase receptors that activate the enzyme PI3 kinase.
• PI3 kinase converts PIP2 (phosphatidylinositol-4,5-bisphosphate) to PIP3 (phosphatidylinositol-3,4,5-trisphosphate) by adding a phosphate group to the 3rd carbon of the inositol ring.
• After PIP3 is generated, a series of downstream events leads to the activation of AKT kinase.
• AKT is a branch point — it phosphorylates substrates along two distinct pathways:
◦ Cell survival (inhibiting death): AKT phosphorylates a protein called BAD. When BAD is phosphorylated, it inhibits apoptosis (programmed cell death). Key concept: in this context, "BAD is good" because phosphorylated BAD = no cell death.
◦ Cell growth: AKT, through multiple intermediary steps, activates a small GTPase called Rheb. Rheb is a cousin of RAS and belongs to the RAS subfamily of small G proteins. Active Rheb-GTP activates TOR kinase, which stimulates cell growth.
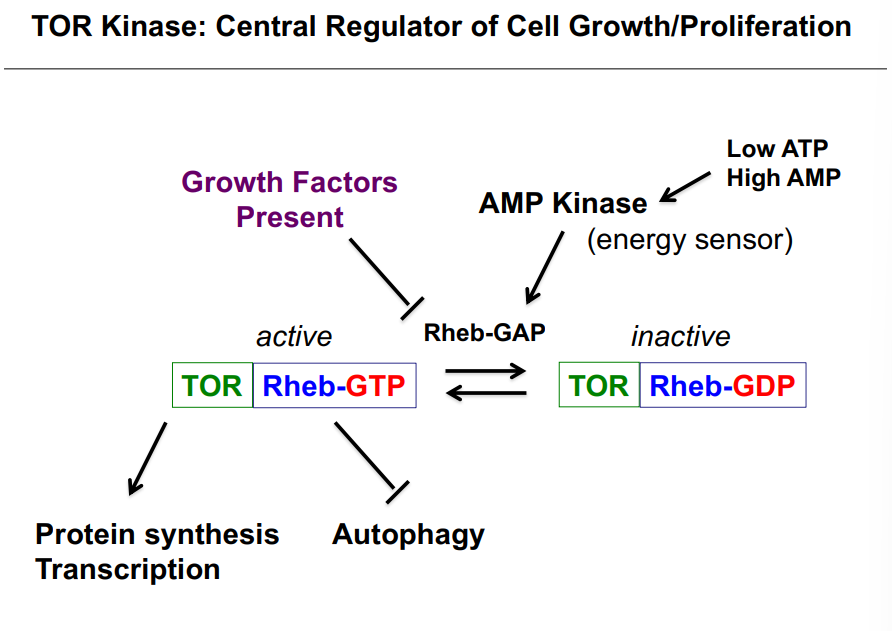
TOR Kinase: Central Regulator of Cell Growth and Proliferation
TOR Kinase: Central Regulator of Cell Growth and Proliferation
TOR kinase is a master regulator of cell growth. Its activity is controlled by two converging inputs via the protein Rheb-GAP:
• Growth factors present: Growth factor signaling inhibits Rheb-GAP. GAPs stimulate GTP hydrolysis, so when Rheb-GAP is blocked, Rheb remains in its active GTP-bound state, which keeps TOR kinase active.
• Low energy (Low ATP / High AMP): AMP kinase acts as a cellular energy sensor. When ATP levels are low, AMP levels rise, activating AMP kinase. AMP kinase then activates Rheb-GAP, which rapidly hydrolyzes Rheb-GTP to Rheb-GDP, leaving TOR kinase inactive.
When TOR is active (growth factors present, adequate energy):
• Protein synthesis and transcription are upregulated — necessary for cell growth and division.
• Autophagy is inhibited — autophagy is the process where a cell cannibalizes its own organelles and macromolecules. When nutrients and growth factors are available, autophagy is shut down.
When TOR is inactive (low energy): Protein synthesis and transcription decrease, and autophagy may be activated to scavenge internal resources. This is an energy conservation response.
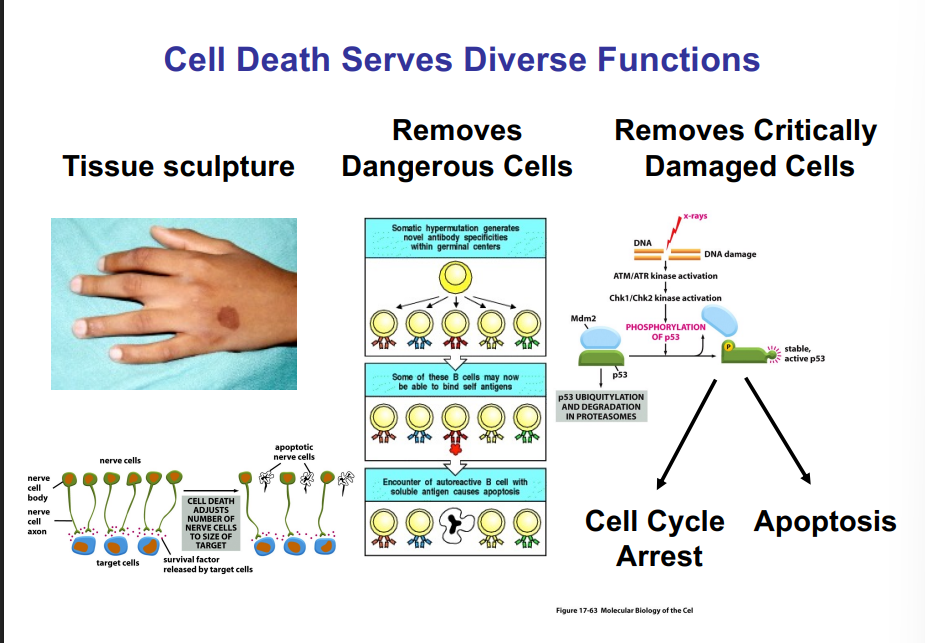
Cell Death: Functions and Importance
Cell Death: Functions and Importance
Cell death, though often perceived negatively, serves critical functions at the organismal level. There are three important functions that arise from programmed cell death:
• Tissue sculpting during development: Cell death enables tissues to be shaped. A classic example is digit formation — during normal development, cells between the fingers die, separating them. In individuals with mutations that prevent this cell death, webbing persists between the digits (a condition caused by failure of programmed cell death in those tissues).
• Neural pruning in brain development: Excessive neural connections are established during brain development. Over time, excess neurons die, pruning connections and improving brain function. This process continues until approximately age 25, which is why brain maturation is not complete until then.
• Removal of dangerous cells: Immune cells that mistakenly recognize self-antigens (instead of foreign antigens) must be eliminated to prevent autoimmune disease. This is accomplished through regulated programmed cell death of those self-reactive immune cells.
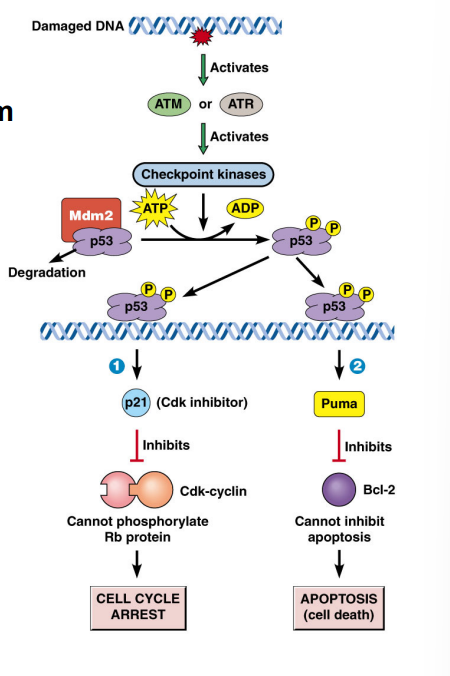
Removing Critically Damaged Cells via P53
Removing Critically Damaged Cells via P53
When DNA is damaged (e.g., by X-rays causing double-strand breaks), a series of signaling events activates the transcription factor p53. Activated p53 drives two parallel responses:
• Cell cycle arrest: p53 induces expression of p21, a CDK inhibitor that blocks the Cyclin-CDK complex, halting the cell cycle so the cell can attempt DNA repair.
• Apoptosis if repair fails: p53 also drives expression of a protein called PUMA. PUMA inhibits BCL-2, which is normally an inhibitor of apoptosis. So: p53 induces PUMA, PUMA inhibits BCL-2, and BCL-2 can no longer block apoptosis. Two inhibitions equal activation of cell death. This eliminates cells that cannot be repaired from the population.
BCL-2 is a critical protein to know: it is an inhibitor of apoptosis. When it is itself inhibited (by PUMA), apoptosis proceeds.
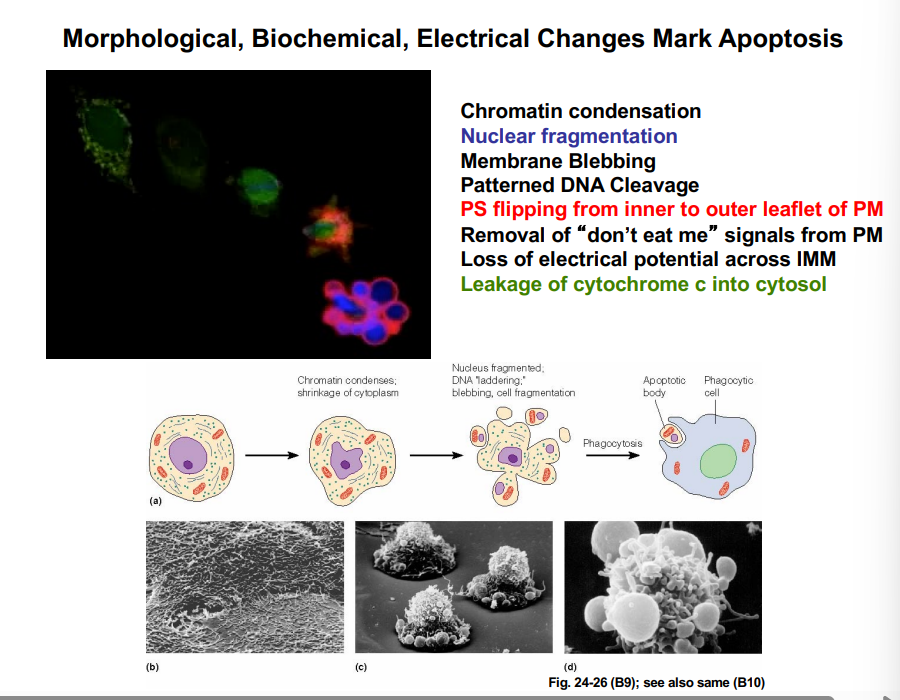
Apoptosis: Cellular Events
Apoptosis: Cellular Events
Apoptosis is programmed cell death — a specific, ordered series of biochemical events that result in the orderly dismantling of the cell. The following signature events occur during apoptosis:
• Cytochrome c leakage: Cytochrome c is a small protein normally residing in the mitochondria as part of the electron transport chain (between Complex III and Complex IV). During apoptosis, it leaks from the mitochondria into the cytosol — this is one of the earliest events.
• Phosphatidylserine (PS) flipping: Normally, phosphatidylserine is located on the inner (cytosolic) leaflet of the plasma membrane. During apoptosis, it flips to the outer leaflet — a signal to phagocytic cells that the cell is undergoing programmed death.
• Removal of "don't eat me" signals: Healthy cells display surface molecules that signal phagocytes not to engulf them. During apoptosis, these molecules are internalized, removing that protection.
• Chromatin condensation and nuclear fragmentation: Chromosomes condense and the nucleus fragments. Importantly, DNA cleavage is patterned (not random) — it occurs at specific sites.
• Membrane blebbing and cell fragmentation: The plasma membrane blebs outward and the cell breaks apart into smaller membrane-enclosed fragments. Each fragment contains pieces of nucleus and/or cytoplasm.
• Apoptotic bodies: The small cell fragments produced during this disintegration are called apoptotic bodies. They are engulfed and destroyed by phagocytic cells. This is a clean process — no inflammation is triggered.
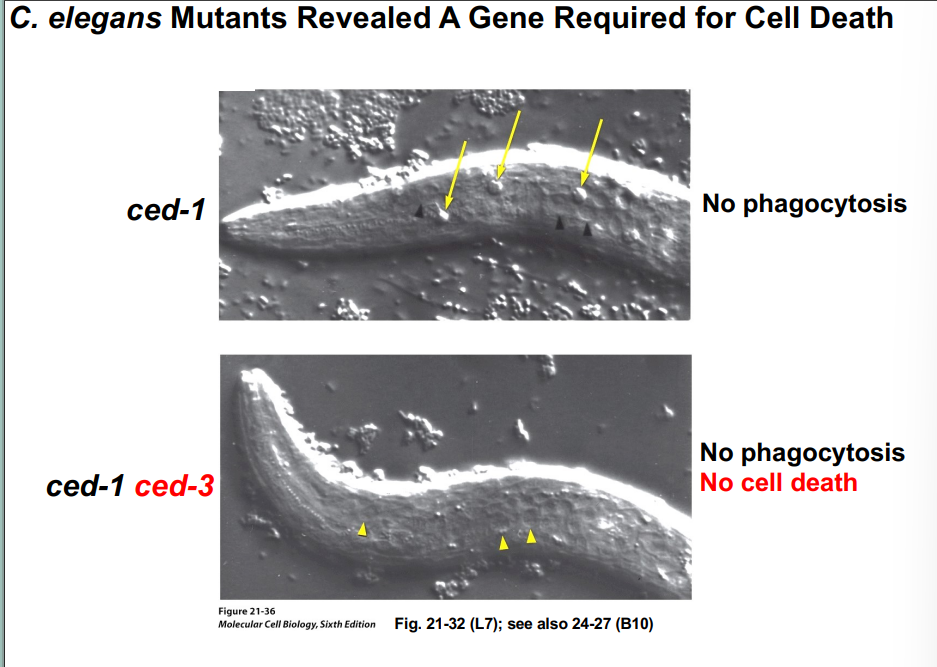
Discovery of Apoptosis: C. elegans as a Model Organism
Discovery of Apoptosis: C. elegans as a Model Organism
Much of what is known about apoptosis was discovered through genetic studies in Caenorhabditis elegans (C. elegans), a small roundworm (nematode). Its value as a model organism comes from several features:
• It is multicellular but has a very small, fixed number of cells — hermaphrodites have 957 cells; males have 1031 cells.
• It is translucent, allowing direct visualization of individual cells and cell divisions.
• The complete cell lineage has been mapped — every cell's origin and fate is known.
• Mutations can be generated and phenotypes directly observed.
Key Mutations Leading to Discovery of Apoptosis
Two mutations were critical to identifying the apoptosis pathway:
• ced-1 mutation: Worms with this mutation accumulate button-like structures in their bodies. These structures are piles of apoptotic bodies — cell debris from cells that have undergone programmed cell death but have NOT been cleared because the ced-1 mutation prevents other cells from being able to engulf and destroy the debris (no phagocytosis of debris).
• ced-1 + ced-3 double mutation: When the ced-3 mutation is added to ced-1 worms, the button-like accumulations of debris disappear entirely. This demonstrated that ced-3 is required for apoptosis itself — no ced-3 means no cell death occurs in the first place, so no debris is ever generated to accumulate. Subsequent study revealed that ced-3 encodes a cellular protease.
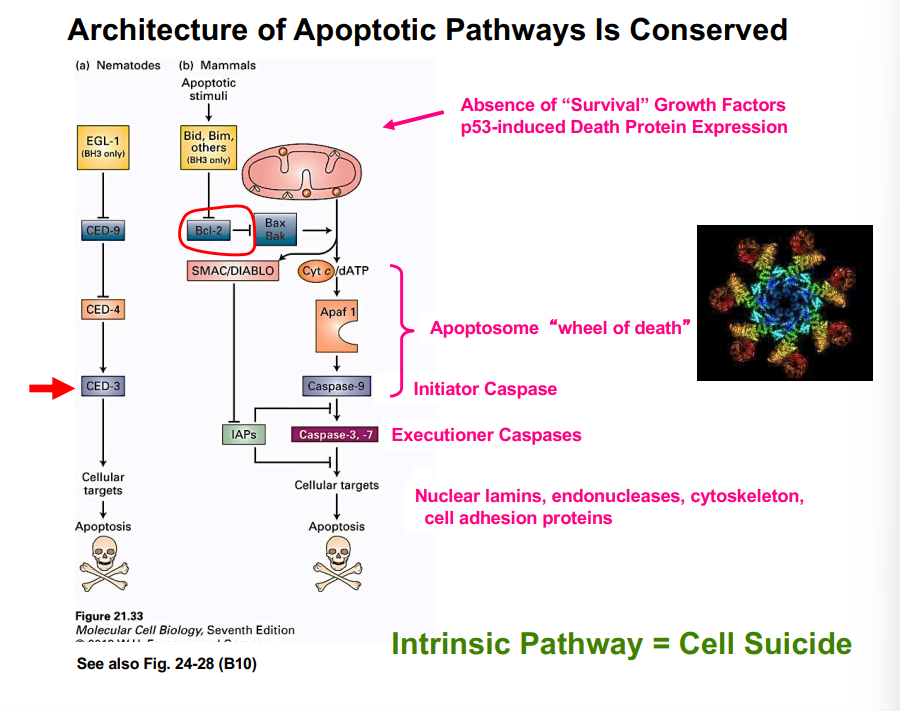
The Intrinsic Pathway of Apoptosis (Cell Suicide)
The Intrinsic Pathway of Apoptosis (Cell Suicide)
The intrinsic pathway is initiated from within the cell. The pathway in C. elegans is conserved in mammals (humans), with functional homologs in the same pathway positions.
• An apoptotic stimulus (e.g., absence of survival growth factors, p53-induced signaling) results in inhibition of BCL-2.
• BCL-2 normally inhibits pro-apoptotic proteins BAX and BAK. When BCL-2 is inhibited, BAX and BAK become active and form openings (pores) in the outer mitochondrial membrane.
• Cytochrome c leaks out through these pores. In the cytosol, cytochrome c combines with a deoxyATP and the protein Apaf-1 (you do not need to memorize "Apaf-1").
• This complex assembles with Caspase-9 (the mammalian homolog of worm CED-3) into a large wheel-shaped structure called the apoptosome — also referred to as the "wheel of death." The caspase proteins are positioned at the outer spokes of this wheel.
• Caspase-9 within the apoptosome is the initiator caspase. Its specific role is to activate, through proteolysis (cleavage), executioner caspases (e.g., Caspase-3 and Caspase-7).
• Executioner caspases then spread throughout the cell and degrade many other proteins, driving the full apoptotic program — including the lipid flipping, nuclear fragmentation, and membrane blebbing described earlier.
Summary of key players to know: BCL-2 (inhibitor of apoptosis), BAX/BAK (pro-apoptotic), Cytochrome c, Apoptosome, Caspase-9 (initiator caspase), Caspase-3/-7 (executioner caspases).
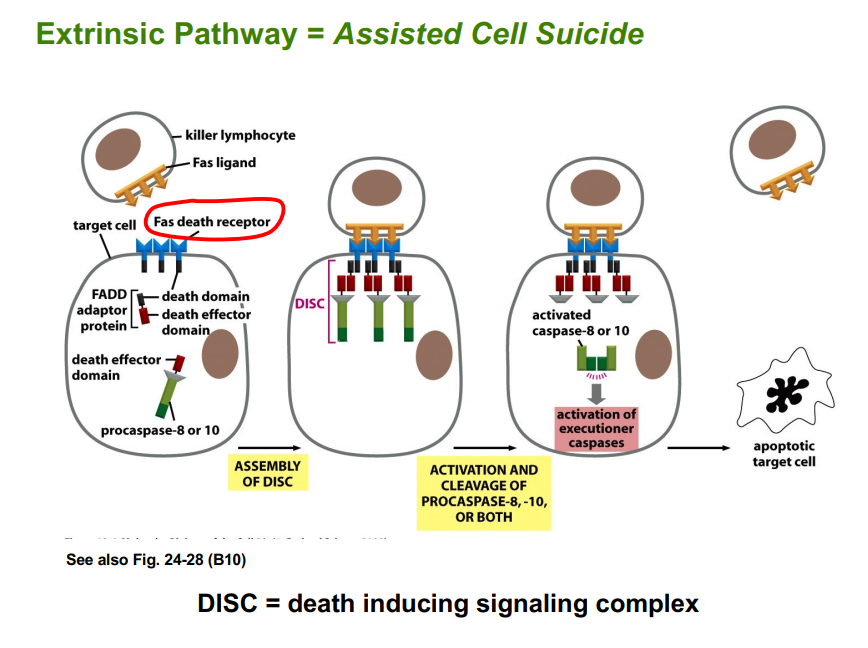
The Extrinsic Pathway of Apoptosis (Assisted Cell Suicide)
The Extrinsic Pathway of Apoptosis (Assisted Cell Suicide)
The extrinsic pathway is initiated from outside the cell, driven by signals from the immune system. This is considered assisted cell suicide.
• A killer lymphocyte (immune cell) expresses a ligand on its cell surface. Unlike most Fas ligands that are diffusible, this ligand is membrane-bound.
• A target cell under apoptotic conditions presents death receptors on its surface. The killer lymphocyte physically contacts the target cell through a ligand-death receptor interaction — this is an example of juxtacrine signaling.
• The ligand-death receptor interaction triggers the assembly of a large protein complex called the Death-Inducing Signaling Complex (DISC).
• DISC activates initiator caspases (Caspase-8 or Caspase-10), which then activate executioner caspases, leading to apoptosis just as in the intrinsic pathway.
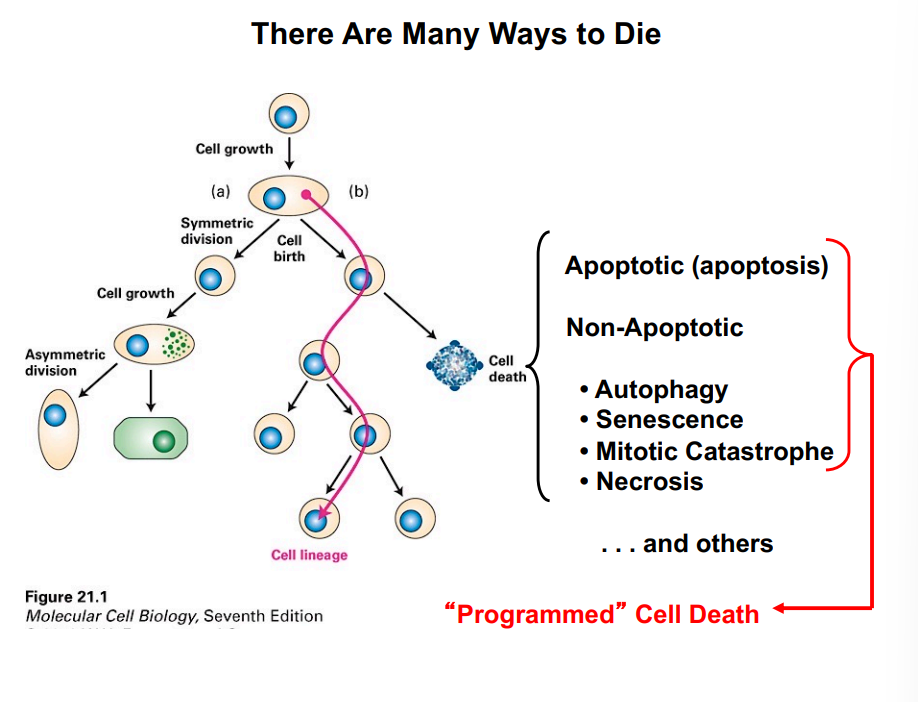
Other Forms of Cell Death: Non-Apoptotic Programmed Cell Death
Other Forms of Cell Death: Non-Apoptotic Programmed Cell Death
Apoptosis (intrinsic and extrinsic) is not the only way a cell can die. Non-apoptotic forms of programmed cell death include:
• Excessive autophagy: If autophagy (cellular self-cannibalism) becomes excessive rather than merely a survival response, it can result in cell death.
• Senescence: Cells can enter a terminal G0 (non-dividing) state. Pathways exist that can lead to death from this senescent state.
• Mitotic catastrophe: If the entire mitotic spindle fails to properly organize or assemble (not just a single microtubule), mitosis cannot occur and the cell initiates a death program. This is distinct from apoptosis.
All of the above — apoptotic and non-apoptotic — are collectively called programmed cell death because they all involve specific signals and biochemical pathways.
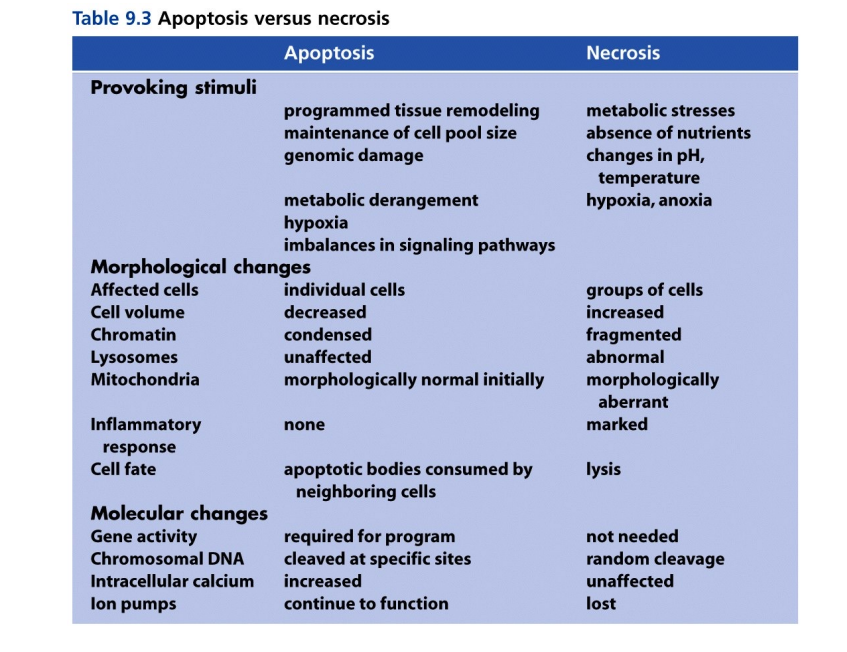
Necrosis: NOT Programmed Cell Death
Necrosis: NOT Programmed Cell Death
Necrosis is fundamentally different from programmed cell death. It results from severe physical damage to a cell — for example, tissue near a cut site. In necrosis:
• There is no specific biochemical program at work.
• The cells are simply physically damaged beyond recovery and die.
• Unlike apoptosis, necrosis typically causes inflammation and affects groups of cells.
• In necrosis, DNA is cleaved randomly (not at specific sites as in apoptosis), the cell swells, and eventually undergoes lysis rather than the orderly packaging into apoptotic bodies.
Note: You do not need to memorize the full comparison table of apoptosis vs. necrosis, but understand that the processes are fundamentally different in both their triggers and their molecular/cellular execution.
Correcting the Record: C. elegans Cell Counts
Correcting the Record: C. elegans Cell Counts
• C. elegans (a small roundworm) is a key model organism used in understanding apoptosis and other cellular processes. It is transparent, meaning all of its cells can be observed directly and their lineages tracked.
• The correct cell counts: a male C. elegans has 1,031 somatic cells; a hermaphrodite has 959 cells. These numbers were previously misstated and are now corrected for accurate notes (not testable).
Introduction to Cancer Biology
Introduction to Cancer Biology
Cancer is a broad, catch-all term for a whole variety of diseases, all unified by one defining feature: abnormal cell growth and division, often with the spread of those cells throughout the body. It was once thought to be a single disease; it is actually many distinct diseases. Research into the cell biology of cancer has led to increasingly effective treatments and cures — hope continues to grow as scientific understanding deepens.
Early detection is among the most critical factors in defeating cancer. For colorectal cancer specifically, screening guidelines have shifted — colonoscopies are now recommended starting at age 45, down from age 50. People at or above that age should be encouraged to schedule one if they have not already done so.
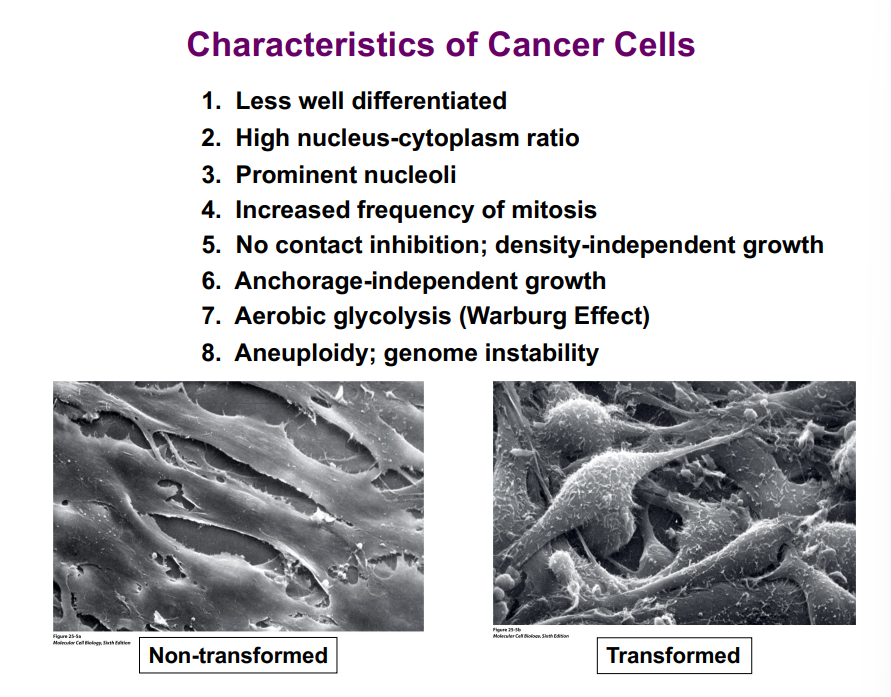
Characteristics of Cancer Cells
Characteristics of Cancer Cells
Under a microscope, cancer cells look visibly different from normal cells. They are rounder, more crowded, grow on top of each other, and display very little spacing between them. The following eight characteristics define cancer cells:
1. Less Well Differentiated
Differentiation refers to a cell acquiring specific physical and biochemical characteristics that allow it to carry out a specialized function. Cancer cells have lost this specialization. For example, intestinal epithelial cells are highly differentiated and optimized for nutrient absorption; cancer cells derived from similar tissue would lack these structures.
2. High Nucleus-to-Cytoplasm Ratio
The nucleus takes up a disproportionately large fraction of the cell volume compared to normal cells. This reflects the high metabolic activity of a rapidly dividing cell.
3. Prominent Nucleoli
Cancer cells contain many, enlarged nucleoli — the nuclear structures where ribosomal subunits are assembled. This makes sense: rapid growth and division require enormous amounts of protein synthesis, which in turn demands many ribosomes. The nucleolus enlarges and multiplies to meet this demand for ribosomal RNA and ribosomal protein production.
4. Increased Frequency of Mitosis
Cancer cells divide more frequently than normal cells. This is one of the defining features that drives tumor growth.
5. No Contact Inhibition; Density-Independent Growth
Normal cells are aware of their neighbors. When cells make physical contact with adjacent cells, they receive signals to stop dividing — this is called contact inhibition. Cancer cells completely ignore these signals. They also exhibit density-independent growth: whereas normal cells stop dividing when a culture dish is full (forming a single-cell monolayer), cancer cells continue dividing regardless of how crowded the environment is, growing on top of one another in multilayered masses.
6. Anchorage-Independent Growth
Normal cells require contact with an extracellular matrix or surface in order to survive and divide. Cancer cells do not need these anchorage signals — they can divide while suspended, which is key to their ability to spread throughout the body.
7. Aerobic Glycolysis — The Warburg Effect
This is addressed in detail in the next section below.
8. Aneuploidy and Genome Instability
Cancer cells frequently have abnormal chromosome numbers (aneuploidy) and highly unstable genomes. Chromosomal translocations — exchanges of segments between non-homologous chromosomes — are common. This instability accelerates the accumulation of additional mutations.
Terminology: Transformed vs. Non-Transformed Cells
A cancer cell that divides indefinitely is called a transformed cell. A normal, healthy cell is a non-transformed cell. This is a confusing overlap in biological terminology: in bacteria and fungi, "transformation" means the uptake of exogenous DNA — not indefinite division. In mammalian cells, when a cell takes up foreign DNA experimentally, it is called a transfected cell, not a transformed cell. The distinction is important to keep straight.
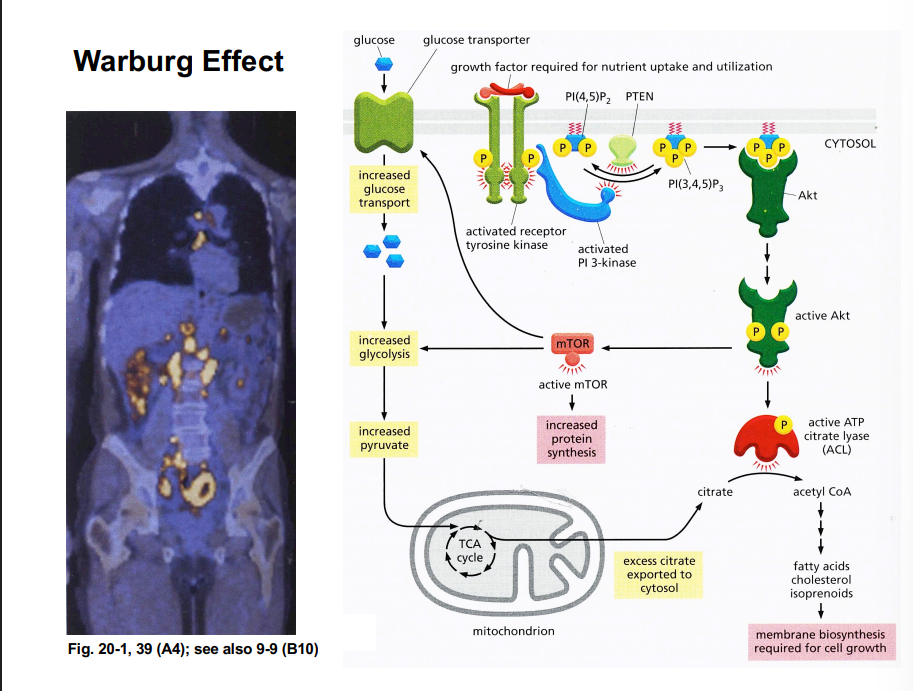
The Warburg Effect (Aerobic Glycolysis)
The Warburg Effect (Aerobic Glycolysis)
The Warburg effect, discovered over a century ago by biochemist Otto Warburg, describes the phenomenon in which cancer cells perform glycolysis at a very high rate even in the presence of oxygen — hence the term aerobic glycolysis. This is counterintuitive because glycolysis is far less efficient at generating ATP compared to oxidative phosphorylation in the mitochondria. However, cancer cells do it in such massive quantities that the sheer volume of glycolysis wins the numbers game: more total ATP is produced than would be generated through mitochondrial respiration.
The Signaling Pathway Behind the Warburg Effect
The following cascade links growth factor signaling to the metabolic reprogramming seen in cancer cells:
• A growth factor binds a receptor (often a receptor tyrosine kinase) at the cell surface, triggering receptor dimerization and autophosphorylation.
• The activated receptor stimulates PI3-kinase, which phosphorylates the membrane lipid PI(4,5)P2 (PIP2) to generate PI(3,4,5)P3 (PIP3).
• PIP3 recruits and activates AKT (a serine/threonine kinase) at the plasma membrane.
• Active AKT activates ATP-citrate lyase (ACL/citrate lyase), which converts citrate (exported from the mitochondrial TCA cycle) into acetyl-CoA. Acetyl-CoA is a key anabolic building block used to synthesize fatty acids, cholesterol, and isoprenoids — all essential for expanding plasma membrane area during cell division.
• Active AKT also activates mTOR (TOR kinase). When TOR is active, protein synthesis is upregulated and autophagy is suppressed. This supports cell growth prior to division.
• A critical downstream target of mTOR is a glucose transporter embedded in the plasma membrane. mTOR activation leads to increased expression and membrane insertion of this transporter, dramatically increasing glucose uptake into the cell.
• The influx of glucose drives high rates of glycolysis, generating large amounts of ATP and pyruvate. The excess pyruvate feeds the TCA cycle, which in turn produces excess citrate — which is exported back to the cytoplasm to feed acetyl-CoA production (a feedback loop).
• Pyruvate is also converted to lactate in the cytoplasm. This lactate is exported from the cell, acidifying the extracellular environment. This acidic environment impairs the function of immune cells and can even induce them to undergo apoptosis — effectively shielding the cancer cell from immune destruction.
Clinical Application: PET Scans
Because cancer cells consume glucose at an abnormally high rate, this metabolic property can be exploited diagnostically. Patients are given a drink containing radioactive glucose. Over time, tumors throughout the body preferentially take up large amounts of this radioactive glucose. A PET (positron emission tomography) scan then detects the radioactive signal, revealing the precise location and extent of tumors as bright spots on the image.
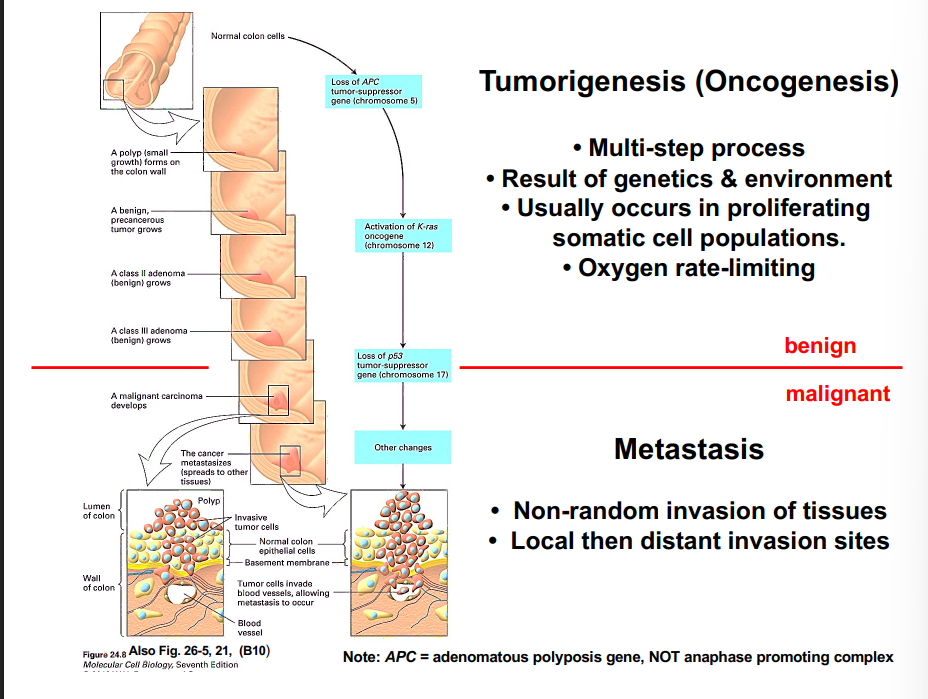
Tumorigenesis (Oncogenesis)
Tumorigenesis (Oncogenesis)
Tumorigenesis and oncogenesis are interchangeable terms for the process by which a normal cell becomes a tumor cell — starting from a single abnormal cell all the way to a detectable mass. It is a multi-step process.
Key Features of Tumorigenesis
• Multi-step process: Most tumors require multiple mutations accumulated over time, not a single event.
• Genetics and environment: Mutations can be inherited (making someone predisposed to certain cancers) or acquired through environmental exposure (e.g., toxic chemicals, industrial waste). Usually it is a combination of both. The Love Canal environmental disaster is a historical example — people living closest to a toxic waste site had the highest rates of tumor development.
• Occurs primarily in proliferating cells: Cells that are already dividing are most vulnerable, because DNA replication introduces opportunities for mutation. Non-dividing cells can still accumulate mutations, but the risk is lower.
• Oxygen is rate-limiting: Tumor growth is limited by oxygen availability. As a tumor grows, cells at the center can become oxygen-deprived, which constrains growth.
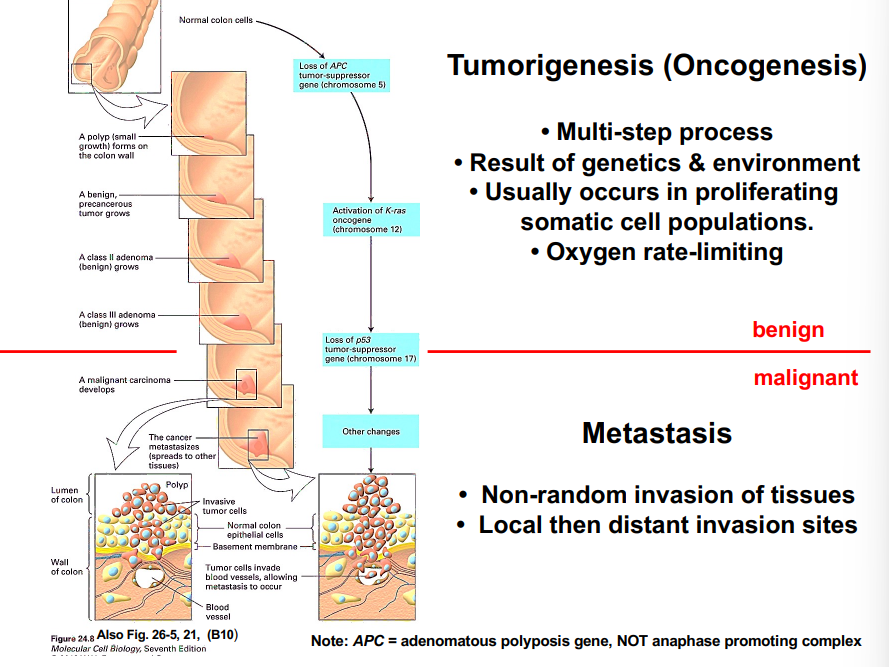
Benign vs. Malignant Tumors
Benign vs. Malignant Tumors
Early-stage tumors are typically benign — they remain as a localized, non-spreading mass. Benign tumors may cause problems if they compress an organ or nerve, but they are not immediately life-threatening. In some cases (e.g., slow-growing prostate tumors), a watch-and-wait approach is medically appropriate.
When a tumor acquires the ability to invade surrounding tissues, it becomes malignant. This is the critical threshold. Malignant tumors can then spread cells to distant parts of the body through the bloodstream or lymphatic system — a process called metastasis. Metastasis involves first local invasion, then invasion of tissues progressively farther from the primary tumor site.
APC Gene (Adenomatous Polyposis Gene) — Terminology Note
In tumorigenesis diagrams, APC refers to the adenomatous polyposis gene — a tumor suppressor gene commonly mutated in colorectal cancer. It does NOT refer to the anaphase-promoting complex, which is a separate concept from cell cycle regulation. This naming overlap is worth noting but the names need not be memorized.
Types of Tumors
Types of Tumors
Tumors are classified by the tissue of origin:
• Carcinoma: Derived from epithelial cells. The most common type — approximately 90% of all tumors are carcinomas.
• Sarcoma: Derived from connective tissues such as bone or muscle.
• Lymphoma: Tumors arising in lymphoid tissue (lymph nodes, lymph glands).
• Leukemia: A proliferation of blood cells (usually white blood cells). Not a solid tumor — a disease of the blood.
An additional term to know: neoplasm. A neoplasm is simply a mass of tumor cells — it is synonymous with "tumor." Something described as neoplastic has the ability to generate a tumor.

Mutations and Cancer: Oncogenes vs. Tumor Suppressor Genes
Mutations and Cancer: Oncogenes vs. Tumor Suppressor Genes
Most tumors require multiple mutations. Experimental evidence from mouse models demonstrates this clearly: mice harboring a single oncogenic mutation (e.g., myc alone, or ras^V12 alone) develop tumors, but slowly. Mice harboring both mutations simultaneously develop tumors much more rapidly. The mutations act cooperatively — their combined effect is greater than the sum of their individual contributions.
Category 1: Oncogenes (Overactivity / Gain-of-Function Mutations)
Normally, a gene that participates in promoting cell growth operates under controlled conditions. This normal version of the gene is called a proto-oncogene. If a mutation occurs that causes the gene product to be permanently or excessively active, the mutated gene is called an oncogene. Even a single mutation in one copy of the gene (out of the two copies in a diploid cell) can be sufficient to promote cancer, because the hyperactive protein product exerts a dominant effect.
• Example — RAS: RAS is a GTPase that normally cycles between an active (GTP-bound) and inactive (GDP-bound) state. The RAS^V12 mutation locks RAS permanently in the active GTP-bound state, meaning it is constitutively turned on and continuously signaling for cell growth and division. Normal RAS is a proto-oncogene; mutated RAS^V12 is an oncogene.
How RAS Drives Uncontrolled Cell Cycle Entry
Constitutively active RAS activates the downstream RAS signaling pathway, which leads to the activation and formation of CDK-cyclin complexes. These complexes phosphorylate the retinoblastoma protein (Rb). Normally, unphosphorylated Rb binds and sequesters the transcription factor E2F, preventing transcription of S-phase genes. When Rb is phosphorylated, it releases E2F. E2F then drives transcription of the genes needed to pass the restriction (R) point and enter S phase — initiating DNA replication. With RAS permanently active, this pathway is continuously stimulated and the cell keeps entering S phase with no proper checkpoint control.
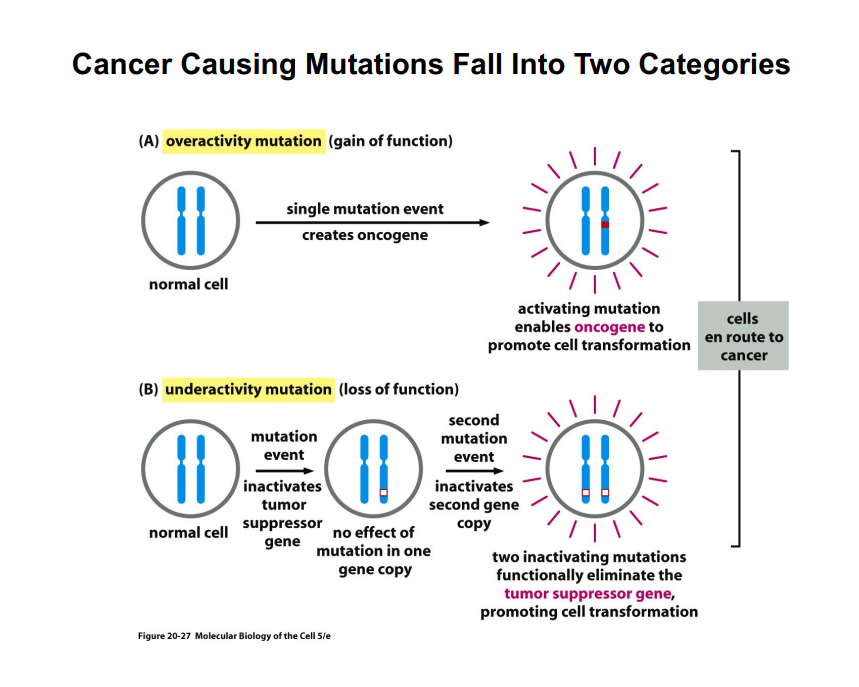
Category 2: Tumor Suppressor Genes (Underactivity / Loss-of-Function Mutations)
Category 2: Tumor Suppressor Genes (Underactivity / Loss-of-Function Mutations)
The other major class of cancer-promoting mutations involves genes whose protein products normally restrain cell growth or induce cell death when needed. These are tumor suppressor genes. Because cells are diploid, both copies of a tumor suppressor gene must be inactivated before the protective function is lost — a single functioning copy is generally enough to maintain normal control. This is why tumor suppressor mutations are recessive.
Key Tumor Suppressor Genes
• Rb (Retinoblastoma Protein): Discovered in the cancer retinoblastoma, Rb normally blocks the G1-to-S transition by holding E2F in an inactive state. When both copies of the RB gene are inactivated, no functional Rb protein is produced. Without Rb, E2F is permanently free to drive S-phase gene expression — the same outcome as constitutively phosphorylated Rb — and the cell cycle runs unchecked.
• p53: p53 is one of the most potent known tumor suppressors. When DNA damage is detected, p53 activity rises in the cell. At lower p53 levels, the cell undergoes G1 arrest — pausing the cycle to attempt DNA repair. As p53 levels continue to accumulate, and if repair is insufficient, the cell then initiates apoptosis (programmed cell death). This dual role — arrest then apoptosis — is concentration-dependent. When p53 is mutated and both copies are lost, the cell neither arrests nor undergoes apoptosis in response to DNA damage, allowing mutations to accumulate and propagate.
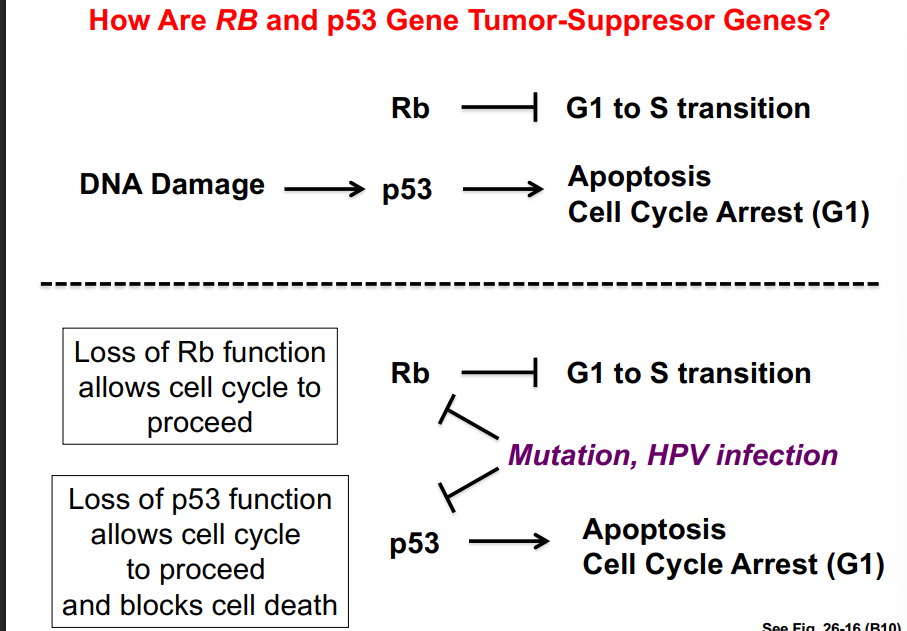
Viruses as a Non-Mutation Pathway to Tumor Suppressor Inactivation
Viruses as a Non-Mutation Pathway to Tumor Suppressor Inactivation
Mutation is not the only way to inactivate tumor suppressors. Certain viruses can achieve the same effect. Human papillomavirus (HPV) is a well-known example — viral proteins can bind and inactivate p53 and Rb, effectively removing these brakes on the cell cycle. This is why HPV is strongly linked to cancers of the reproductive system, and why HPV vaccination is remarkably effective at preventing those cancers.
Does Tumorigenesis Require the Same Mutations in Every Patient?
No — and this is important. Different patients can develop tumors through different combinations and orders of mutations. What matters is the functional consequence: pathways controlling cell growth, DNA repair, and programmed death must be disrupted. Various combinations of mutations in different genes can converge on the same result.
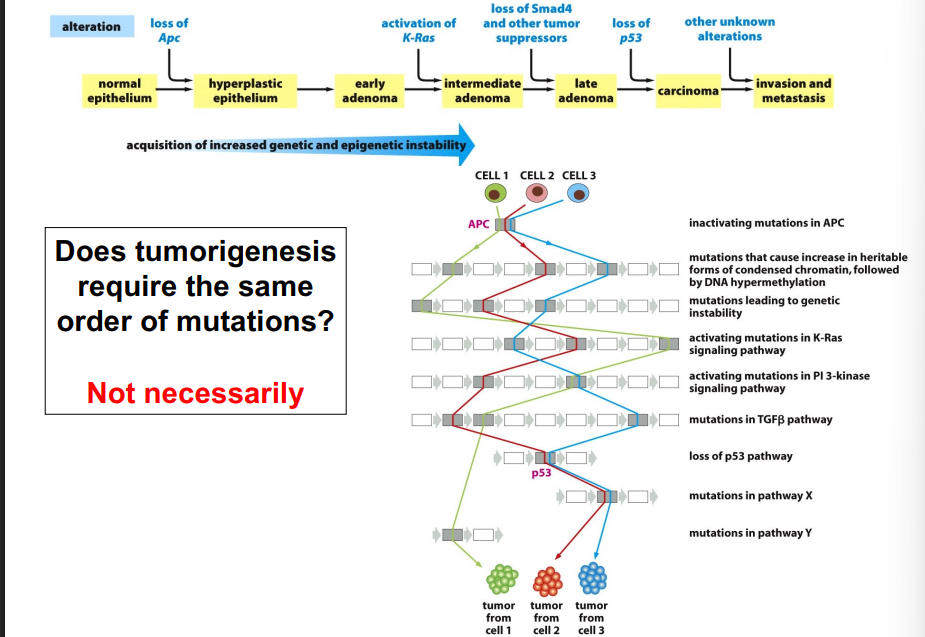
Are Tumors Derived from a Single Cell?
Are Tumors Derived from a Single Cell?
Evidence suggests that many tumors are monoclonal — meaning they originate from a single transformed cell that then divides repeatedly. Several lines of evidence support this:
• Tumors from female patients show the same pattern of X chromosome inactivation throughout. Because X inactivation is random during embryonic development, if a tumor arose from multiple independently transformed cells it would show a mixture of inactivation patterns. Uniform inactivation suggests a single-cell origin.
• Many tumors share the same abnormal karyotype throughout — all tumor cells carry the same chromosomal abnormality, consistent with descent from one progenitor cell.
• In multiple myeloma (a blood cancer), all tumor cells secrete the same identical antibody (monoclonal immunoglobulin/M-spike), confirming they descended from a single clone of B cells.
However, within a monoclonal tumor, not all cells are equal. As the tumor evolves through additional rounds of mutation, subpopulations emerge with different mutation profiles. Only a small minority of cells within a tumor — called tumor stem cells — possess high replicative potential and are truly tumorigenic. This helps explain why simply removing bulk tumor cells is sometimes insufficient for a cure.
Hallmarks of Cancer & The Seven Protein Categories
Hallmarks of Cancer & The Seven Protein Categories
Seven types of proteins normally control cell growth and proliferation. Defects in these proteins produce the hallmarks of cancer:
• Signaling molecules (growth factors)
• Signal receptors
• Intracellular signal transducers
• Transcription factors
• Cell cycle control proteins
• DNA repair proteins
• Apoptotic proteins
The hallmarks of cancer that emerge when these proteins malfunction include: self-sufficiency in growth signals, insensitivity to anti-growth signals, evasion of apoptosis, limitless replicative potential (immortality), sustained angiogenesis (growth of new blood vessels to supply the tumor), and tissue invasion and metastasis.
Tumorigenesis — Multiple Mutations & Tumor Origins
Tumorigenesis — Multiple Mutations & Tumor OriginsMultiple Mutations Accelerate Tumorigenesis
Having more than one mutation dramatically accelerates the rate at which a tumor develops. The classic experimental demonstration involves picking two genes known to be critical for cell cycle progression, but in reality, tumors contain far more than just two mutations — particularly as time goes on. The two-mutation model is an extreme, simplified experimental scenario, not a reflection of what is seen in actual tumor biology.
Different Mutational Pathways Can Produce the Same Tumor Type
Tumorigenesis does not require the same set of mutations in every case. Genotyping studies of many different tumors — including different types and even the same type — show that tumors do not always contain identical mutations. Instead, there are multiple mutational pathways, each representing a different accumulation of mutations that can arrive at the same end result: a tumor. This is illustrated by tracing three separate cells through different gene mutation events and seeing how each arrives at a distinct tumor, even if the starting tissue was the same.
Key developmental stages in epithelial tumor progression (not required to memorize all steps):
• Normal epithelial cells
• Hyperplastic cells
• Adenomas
• Carcinoma (derived from epithelial cell layers)
• Invasion of local tissues — at this point the tumor is considered malignant
• Metastasis — spread to distant parts of the body; the cancer is definitively malignant
Important distinction: Malignancy refers to the spread of tumor cells, either locally (invasion) or at a distance (metastasis). Carcinomas arise from epithelial cells.
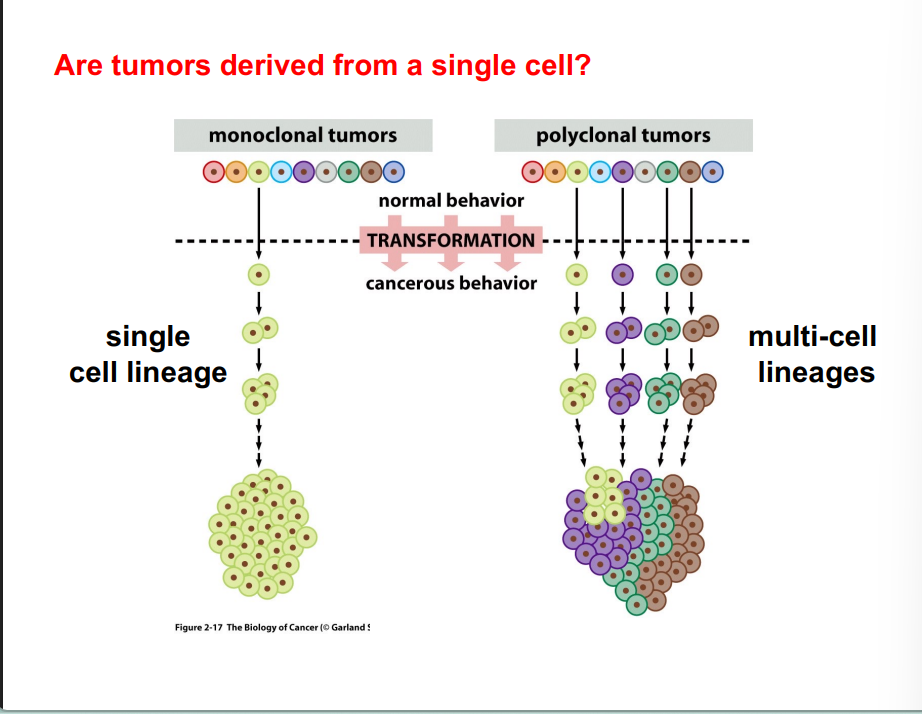
Are Tumors Derived from One Cell or Multiple Cells?
Are Tumors Derived from One Cell or Multiple Cells?
In most cases, tumors are derived from a single founding cell — this is called a monoclonal tumor. A single cell undergoes a mutation, proliferates, and generates a lineage of daughter cells that form the tumor mass. Less commonly, tumors can be polyclonal, meaning multiple cells independently transform and contribute different cell lineages to the same tumor.
Evidence that most tumors are monoclonal:
1. X Chromosome Inactivation Pattern
In female cells, one of the two X chromosomes is randomly inactivated in each cell during development. This means adult tissues show a mosaic pattern — some cells have the maternal X inactivated, others have the paternal X inactivated. If a tumor develops within that tissue, all cells of the tumor show the same X chromosome inactivated. This uniformity implies that all tumor cells descend from a single ancestor cell that had a specific X chromosome inactivated. While it is possible that multiple cells happened to inactivate the same X chromosome, other experiments have ruled this out.
2. Shared Karyotype within Tumors
A karyotype is the full visual display of a cell's chromosomes arranged in homologous pairs. When a DNA translocation event occurs in a single cell — where a segment of DNA from one chromosome moves to another — that cell will divide and pass the translocation on to all its descendants. Looking at tumor tissue, the majority or all of the tumor cells share the identical translocation, which is strong evidence they all came from the same original mutant cell.
3. Antibody Identity in Multiple Myeloma
Multiple myeloma is a cancer of B cells — antibody-secreting immune cells. In a healthy person, many different B cells produce many different antibodies (a polyclonal antibody population), so running blood serum on a polyacrylamide gel shows a broad smear of antibody proteins. In multiple myeloma patients, one type of B cell is massively expanded, and all those cancer cells produce the same antibody. This shows up as a single dominant band — an M-spike — on the gel, which is direct evidence that all the cancerous B cells share a common ancestor (monoclonal origin).
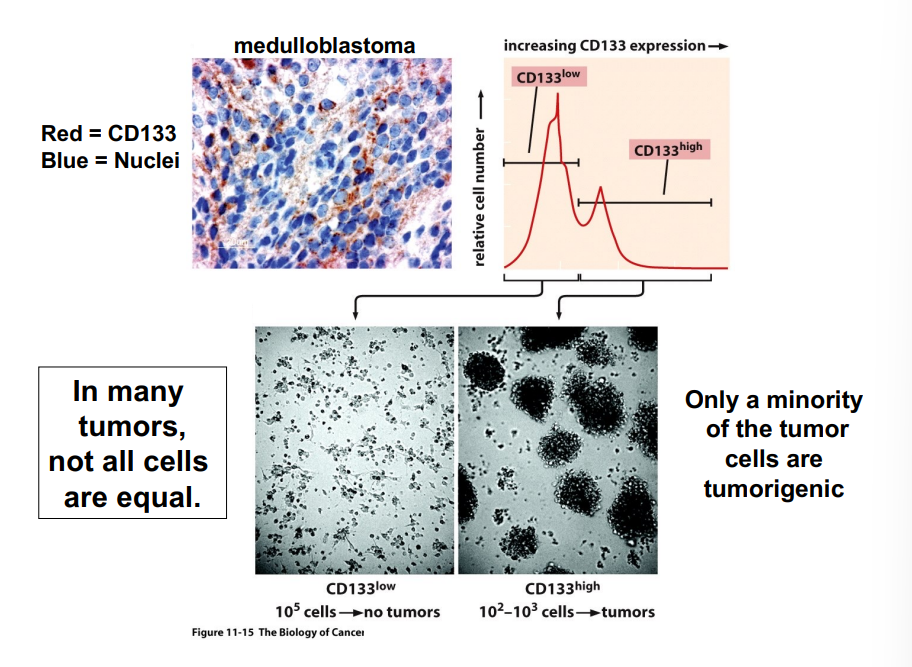
Not All Cells Within a Tumor Are Equal — The Tumor Stem Cell Hypothesis
Not All Cells Within a Tumor Are Equal — The Tumor Stem Cell Hypothesis
Even though a tumor originates from a single cell, the cells within the tumor are not all identical. This is the central claim of the tumor stem cell hypothesis: not every cell in the tumor has the same ability to replicate and drive tumor growth. The model works as follows:
• A stem cell acquires a first mutation and begins replicating more than surrounding cells, generating an expanded population.
• If one of those stem cells then acquires a second mutation (usually randomly, through environmental exposures), cells descended from it outgrow the rest of the tumor.
• A third mutation can again give a sub-population an even greater replicative advantage.
• The result is a tumor composed of cells carrying different numbers of mutations, but only those stem cells with the most mutations divide the most rapidly. The majority of cells in the tumor have limited replicative potential.
Experimental support — Medulloblastoma example: A brain tumor (medulloblastoma) was stained for the protein CD133, a cell-surface membrane-associated protein involved in cell signaling. Cells with high CD133 levels (CD133-high) and low CD133 levels (CD133-low) could be separated by flow cytometry. When 100,000 CD133-low cells were placed in a culture dish, no tumor formation was observed. When only 100–1,000 CD133-high cells were placed in a dish, rapid cell division and tumor-like masses appeared. This demonstrates that only a small subset of cells within a tumor are truly tumorigenic — consistent with the stem cell hypothesis, even if these cells are not necessarily classic stem cells.
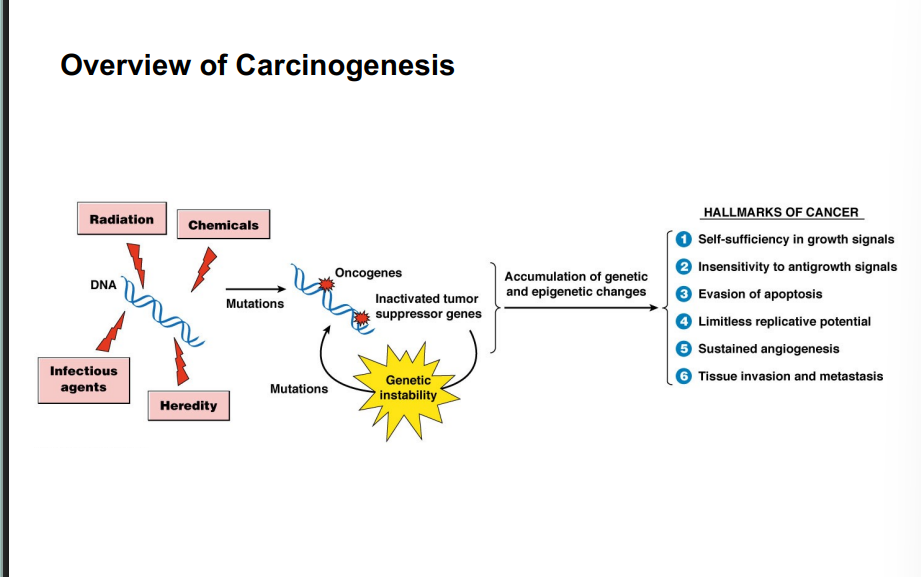
Part 2: Overview of Carcinogenesis & The Six Hallmarks of Cancer
Part 2: Overview of Carcinogenesis & The Six Hallmarks of Cancer
Overview of Carcinogenesis
Carcinogenesis refers to DNA damage inflicted by external agents or inherited factors that initiate tumor development. Causative agents include:
• Radiation
• Chemical carcinogens
• Infectious agents (viruses, bacteria)
• Heredity — inherited mutations that predispose someone to cancer from birth
These agents cause mutations that can activate oncogenes and/or inactivate tumor suppressor genes. Both types of events contribute to genetic instability, and the accumulation of such changes leads to the six hallmarks of cancer. A single oncogene forming in a cell is not sufficient to produce a tumor — multiple mutations disrupting multiple processes must occur simultaneously.
The Six Hallmarks of Cancer:
• Self-sufficiency in growth signals
• Insensitivity to anti-growth signals
• Evasion of apoptosis
• Limitless replicative potential (immortality)
• Sustained angiogenesis (not covered in depth in this course)
• Tissue invasion and metastasis
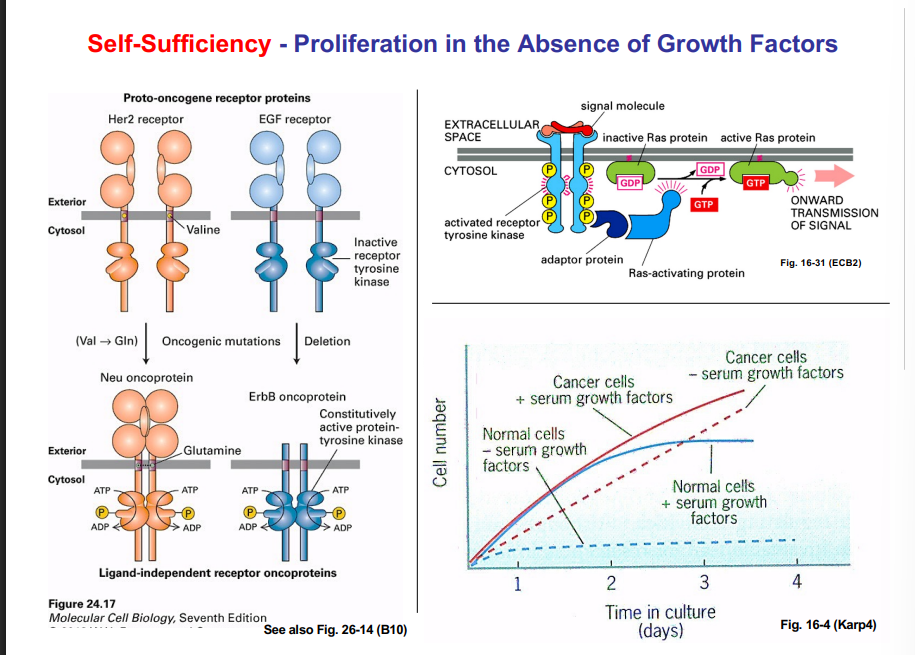
The Hallmarks in Detail Hallmark
1: Self-Sufficiency — Proliferation in the Absence of Growth Factors
The Hallmarks in DetailHallmark 1: Self-Sufficiency — Proliferation in the Absence of Growth Factors
Normal cells require growth factors present in serum (the liquid portion of blood after clotting) to proliferate. Serum is loaded with growth factors that drive cell division. When serum is removed from cultured normal cells, growth stops. Cancer cells, however, can grow even without these external growth factors — they are self-sufficient.
Key experimental observation: Normal cells grown with serum proliferate steadily and then plateau due to contact inhibition. Normal cells without serum barely grow. Cancer cells with serum grow even more than normal cells (because they lack contact inhibition and anchorage dependence). Most strikingly, cancer cells WITHOUT serum grow significantly more than normal cells with serum. This definitively shows that cancer cells do not depend on exogenous growth factor signals.
Molecular basis — mutations in receptor tyrosine kinases:
Most self-sufficiency mutations occur at the very first step of growth factor signaling pathways: the receptor itself. Two well-studied examples:
HER2 Receptor (becomes Neu oncoprotein)
HER2 is a single-pass transmembrane tyrosine kinase receptor. In 10–30% of breast cancers, a single amino acid substitution occurs in the transmembrane domain — a valine is replaced by a glutamine. This seemingly small change alters the receptor's structure enough that the receptor dimerizes and auto-phosphorylates itself without any ligand binding. It is constitutively active: always signaling for the cell to divide regardless of whether a growth factor is present. Once this oncogenic mutation produces a constitutively active receptor, it is renamed from HER2 (the proto-oncogene product) to Neu (the oncoprotein).
EGF Receptor (ErbB oncoprotein)
The epidermal growth factor (EGF) receptor is another important tyrosine kinase receptor. EGF is a growth factor that recurs throughout biology. An oncogenic mutation in this receptor causes deletion of nearly all of its extracellular domain — the region that normally binds to EGF. Despite lacking the ligand-binding domain, the truncated receptor is still constitutively active. Two truncated proteins come together, auto-phosphorylate each other, and initiate the downstream signaling cascade as if EGF were present. This truncated protein is called the ErbB oncoprotein.
Both of these examples highlight the principle that self-sufficiency usually results from mutations in receptors that make them permanently active without needing their ligand.
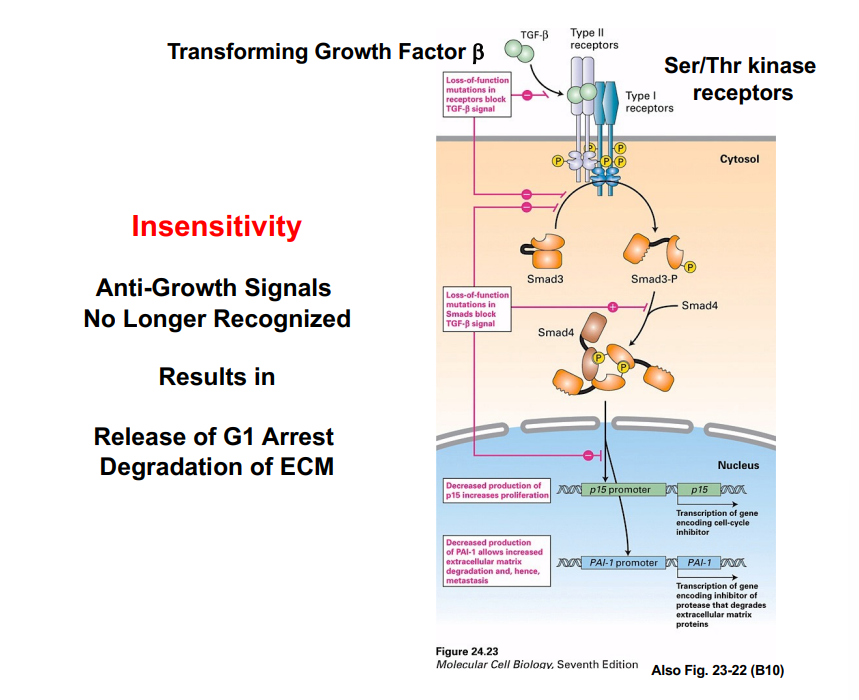
Hallmark 2: Insensitivity to Anti-Growth Signals
Hallmark 2: Insensitivity to Anti-Growth Signals
Normal cells are subject to signals from their environment that tell them to stop growing. A well-studied example is Transforming Growth Factor beta (TGF-beta). Despite its name, TGF-beta does NOT promote transformation into cancer — it does the opposite. It suppresses cell growth and movement, making it a potent anti-growth signal.
How TGF-beta works:
• TGF-beta binds to serine/threonine kinase receptors on the cell surface (a different class from tyrosine kinase receptors).
• Activated receptors phosphorylate SMAD proteins in the cytoplasm (specifically SMAD3).
• Phosphorylated SMAD3 interacts with SMAD4, forming a complex.
• This SMAD complex acts as a transcription factor and enters the nucleus.
• In the nucleus, it activates transcription of p15, a gene encoding a cell cycle inhibitor — this halts cell division (G1 arrest).
• SMAD signaling also activates expression of inhibitors of proteases that degrade the extracellular matrix (ECM). Without those proteases, cells cannot break down the ECM around them and therefore cannot move — a further brake on invasion.
Cancer connection: Mutations in the TGF-beta receptors, in SMAD proteins, or in the nuclear import machinery prevent the signal from being transmitted. The result is that cells no longer respond to TGF-beta's stop signals. Cell cycle inhibitors are not expressed, the cells keep dividing, and proteases remain uninhibited — facilitating ECM degradation and eventual invasion.
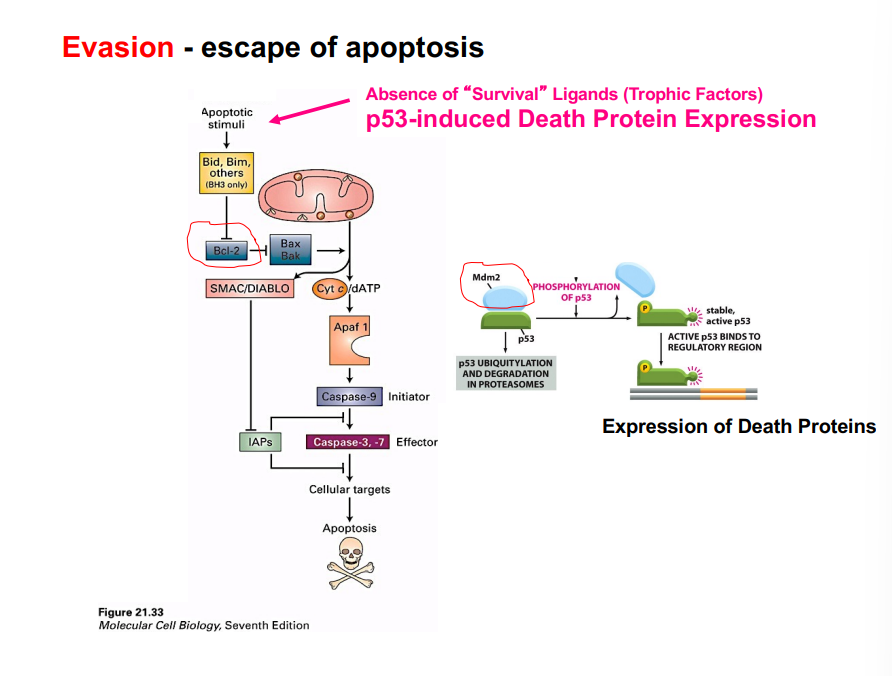
Hallmark 3: Evasion of Apoptosis
Hallmark 3: Evasion of ApoptosisAnoikis — Cell Death from Loss of ECM Contact
Under normal conditions, cells must maintain contact with the extracellular matrix (ECM) to survive. A cell that loses sufficient ECM contact undergoes a specific form of programmed cell death called anoikis (pronounced approximately 'ah-NOY-kis' — a Greek-derived term with notoriously variable pronunciation). This is not just a lab curiosity — it is a critical process in normal development.
Classic experiment: ECM-coated glass squares of different sizes were placed in culture dishes. A single cell was seeded on each square. Results:
• On large squares (30–40 µm), cells grew and divided normally — DNA synthesis was high and apoptosis was low.
• On small squares (5 µm), cells underwent extensive apoptosis — DNA synthesis was essentially zero.
• Apoptosis decreased as island size increased; DNA synthesis increased as island size increased. These two curves are inversely related.
Anoikis in Breast Tissue Development
During normal breast tissue development, ducts must form. Ducts arise because cells in the interior of a solid epithelial mass undergo anoikis — they lose ECM contact and die off via apoptosis. This hollows out the tissue and creates the ductal lumen. The surviving cells on the outside wall remain in contact with laminin (an ECM protein, visible as red staining) and do not undergo apoptosis. The apoptotic cells in the center stain positively for caspase-3, a hallmark enzyme of apoptosis.
When anoikis fails: If interior cells do not undergo apoptosis, the duct does not form properly. Instead, cells accumulate in the center of the duct, filling it in and creating a solid mass — an early step toward a breast tumor. This is associated with elevated levels of Bcl-2.
Bcl-2 and Evasion of Apoptosis
Bcl-2 is an anti-apoptotic protein. In the intrinsic apoptosis pathway, pro-apoptotic proteins Bax and Bak form channels in the mitochondrial membrane, allowing cytochrome C to leak out. Cytochrome C then joins the apoptosome complex, which activates initiator caspases (e.g., caspase-9), which in turn activate executioner caspases (e.g., caspase-3/7) to carry out cell death.
Bcl-2 inhibits Bax and Bak. When Bcl-2 levels are abnormally high, cytochrome C does not leak from mitochondria, the apoptosome does not form, caspases are not activated, and the cell cannot die by apoptosis. Cancer cells with high Bcl-2 are therefore resistant to intrinsic apoptosis signals.
p53 and Evasion of Apoptosis
Another mechanism by which cancer cells evade apoptosis involves inactivation of p53. Under normal circumstances, DNA damage activates p53 by triggering its phosphorylation, which stabilizes it and allows it to act as a transcription factor. Active p53 drives expression of proteins that initiate programmed cell death and arrest the cell cycle at G1.
The protein MDM2 binds p53 and targets it for ubiquitylation and degradation in the proteasome, preventing it from acting as a transcription factor. In many cancers, mutations result in overexpression of MDM2 or other proteins that keep p53 inactive. Without active p53, the cell cannot launch apoptotic programs in response to DNA damage, allowing damaged cells to survive and proliferate.
The key takeaway is that evasion of apoptosis can arise through different mutations in different pathways — elevated Bcl-2, inactivated p53, or disruption elsewhere in the apoptotic machinery.
Hallmark 4: Limitless Replicative Potential (Immortality) — Preview
Hallmark 4: Limitless Replicative Potential (Immortality) — Preview
Self-sufficiency, insensitivity to anti-growth signals, and evasion of apoptosis allow a cell to proliferate unchecked, but they do not on their own guarantee that the cell can replicate indefinitely. There is a separate biological limit on cell division. Normal somatic cells can only divide a finite number of times before entering senescence (a permanent non-dividing state) or undergoing crisis (death by apoptosis driven by chromosome instability).
Cancer cells must also overcome this replicative limit to become truly immortal — this is the next topic to be covered (Friday's lecture). The mechanism involves telomeres — the protective sequences at the ends of chromosomes — and the enzyme telomerase.
Immortality: Limitless Replicative Potential
Immortality: Limitless Replicative Potential
The hallmark of immortality refers specifically to limitless replicative potential — not to any resistance to physical destruction. An immortalized cell can still be killed by physical or chemical means; immortality simply means the cell retains the capacity to keep dividing without an imposed upper limit on the number of divisions it can undergo.
Cell Senescence vs. Cell Crisis
Two distinct fates await normal cells that are cultured long-term: senescence and crisis. These are fundamentally different outcomes that must be clearly distinguished.
Cell Senescence
Senescence is a state in which a cell remains viable but loses its ability to replicate. Senescent cells enter a terminal G0 state — or in some cases a terminal G2 state — from which they do not re-enter the cell cycle. Key characteristics of senescent cells include:
• The cells remain alive and metabolically active
• They maintain a stable karyotype — chromosomes remain intact and morphologically normal
• They have no replicative potential — DNA may be replicated, but mitosis does not proceed; the cells cannot enter M phase
• Morphologically, senescent cells appear very flat, enlarged, and translucent when viewed under a microscope; the nuclei appear much larger
• Senescence is driven by the physiology of the cell combined with the accumulation of metabolic stress, particularly the buildup of reactive oxygen species (ROS) — highly reactive molecules containing oxygen that accumulate as cells undergo repeated rounds of division
Normal human cells placed in culture will typically divide approximately 40 to 50 times before entering senescence. After this point, the growth rate of the culture declines and eventually reaches zero. This phenomenon, observed and named after the researcher who described it in the 1960s, is called the Hayflick Limit. Critically, the Hayflick Limit measures replicative age — how many rounds of cell division have occurred — not chronological age or how many days the culture has been maintained.
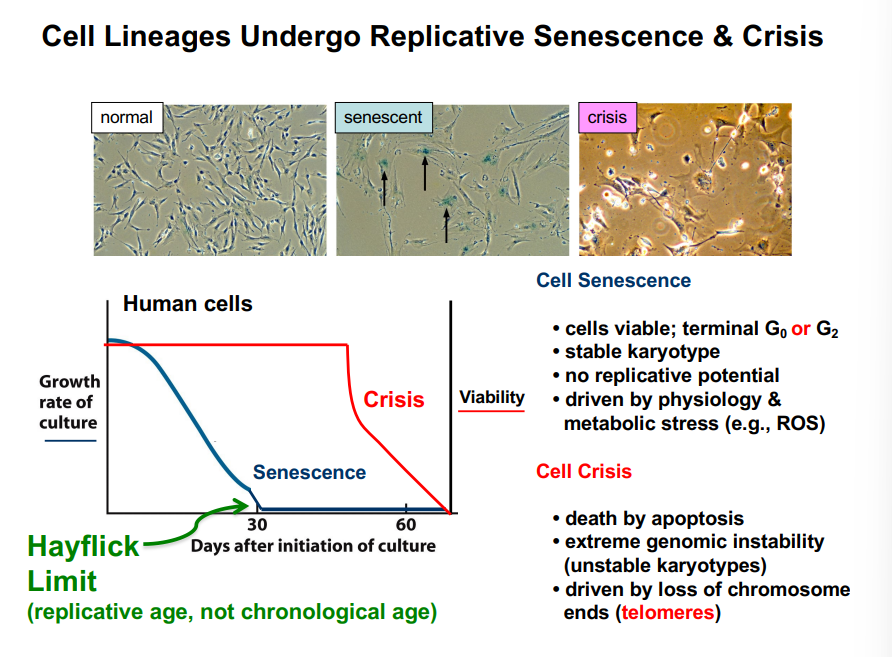
Cell Crisis
Cell Crisis
Crisis is a more severe and distinct outcome from senescence. Cells in crisis are not merely arrested — they are actively dying. Key characteristics of cell crisis include:
• Cells undergo apoptosis — programmed cell death — and die off rapidly from the culture
• The culture displays extreme genomic instability, characterized by highly unstable karyotypes
• Chromosomes can no longer be matched as homologous pairs because extensive chromosome rearrangements have occurred
• Morphologically, cells in crisis appear refractile and bubbly under a microscope, consistent with apoptotic changes
• Crisis is caused specifically by the loss of telomeres — the protective DNA sequences at the ends of each chromosome
The End-Replication Problem
DNA replication relies on RNA primers — short RNA sequences that must anneal to a template strand before DNA polymerase can synthesize new DNA. This mechanism works well for interior regions of chromosomes, but creates a fundamental problem at chromosome ends. To replicate the very end of a chromosome's lagging strand, an RNA primer would need to anneal to a template region that has no complementary strand extending further outward. Because no such template exists beyond the chromosome end, the primer cannot be placed, and a small segment of DNA at the end is lost with each round of replication.
As a result, with each successive round of DNA replication, chromosomes become progressively shorter at their ends. If this process continued unchecked, eventually genes essential for cell function would be lost, surveillance mechanisms would detect the damage, and the cell would be driven into apoptosis.
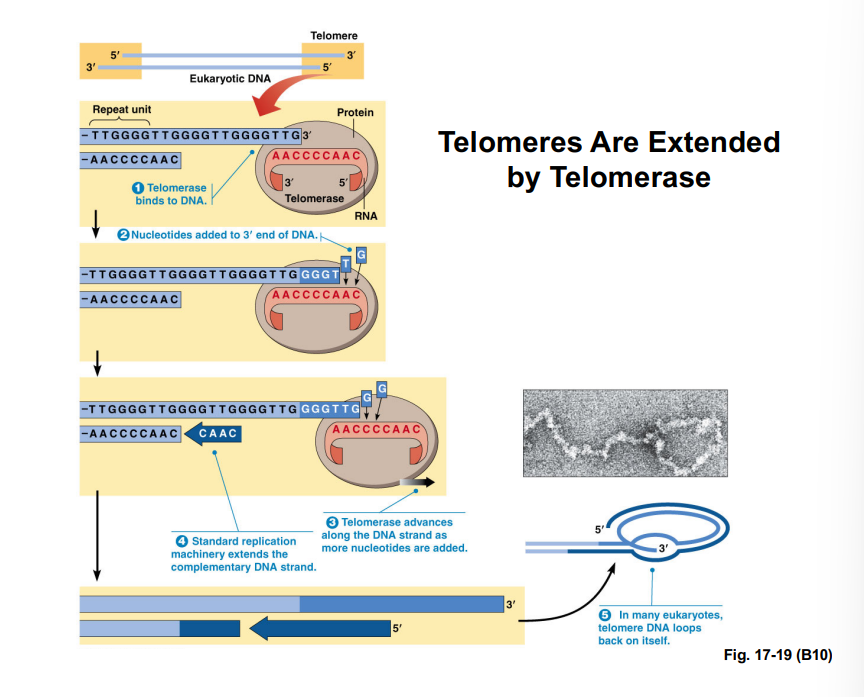
Telomeres and Telomerase
Telomeres and Telomerase
To solve the end-replication problem, cells maintain extra, non-coding DNA sequences at the ends of each chromosome called telomeres. Telomeric DNA is composed of repetitive sequence units (in humans, TTAGGG repeated many times). This buffer of non-coding DNA means that the shortening that occurs with each replication round initially consumes only the telomeric sequences, protecting the protein-coding genes within the chromosome body.
Telomeres also adopt a distinctive structure. The single-stranded overhang at the chromosome end loops back on itself, forming a circular lariat-like structure sometimes called a displacement loop. This looped structure has been visualized directly using electron microscopy.
How Telomerase Maintains Telomere Length
Telomerase is the enzyme responsible for extending telomere sequences. It carries an internal RNA molecule that serves as a template for DNA synthesis — meaning it does not require a separate complementary strand as a template. Telomerase extends the 3' end of the existing telomeric strand by adding new TTAGGG repeat units. Once extended, the complementary strand is then synthesized by conventional DNA replication machinery, which can lay down a new RNA primer on the now-extended template.
Embryonic cells and stem cells express high levels of telomerase, allowing them to maintain long telomeres and replicate extensively. As cells differentiate into adult somatic cells, telomerase expression is turned off, and telomeres gradually shorten with each cell division. This built-in shortening functions as a biological counting mechanism — the number of telomeric repeats serves as a record of how many times a cell lineage has divided.