Hemodynamic Final - Write outs
1/14
There's no tags or description
Looks like no tags are added yet.
Name | Mastery | Learn | Test | Matching | Spaced | Call with Kai |
|---|
No analytics yet
Send a link to your students to track their progress
15 Terms
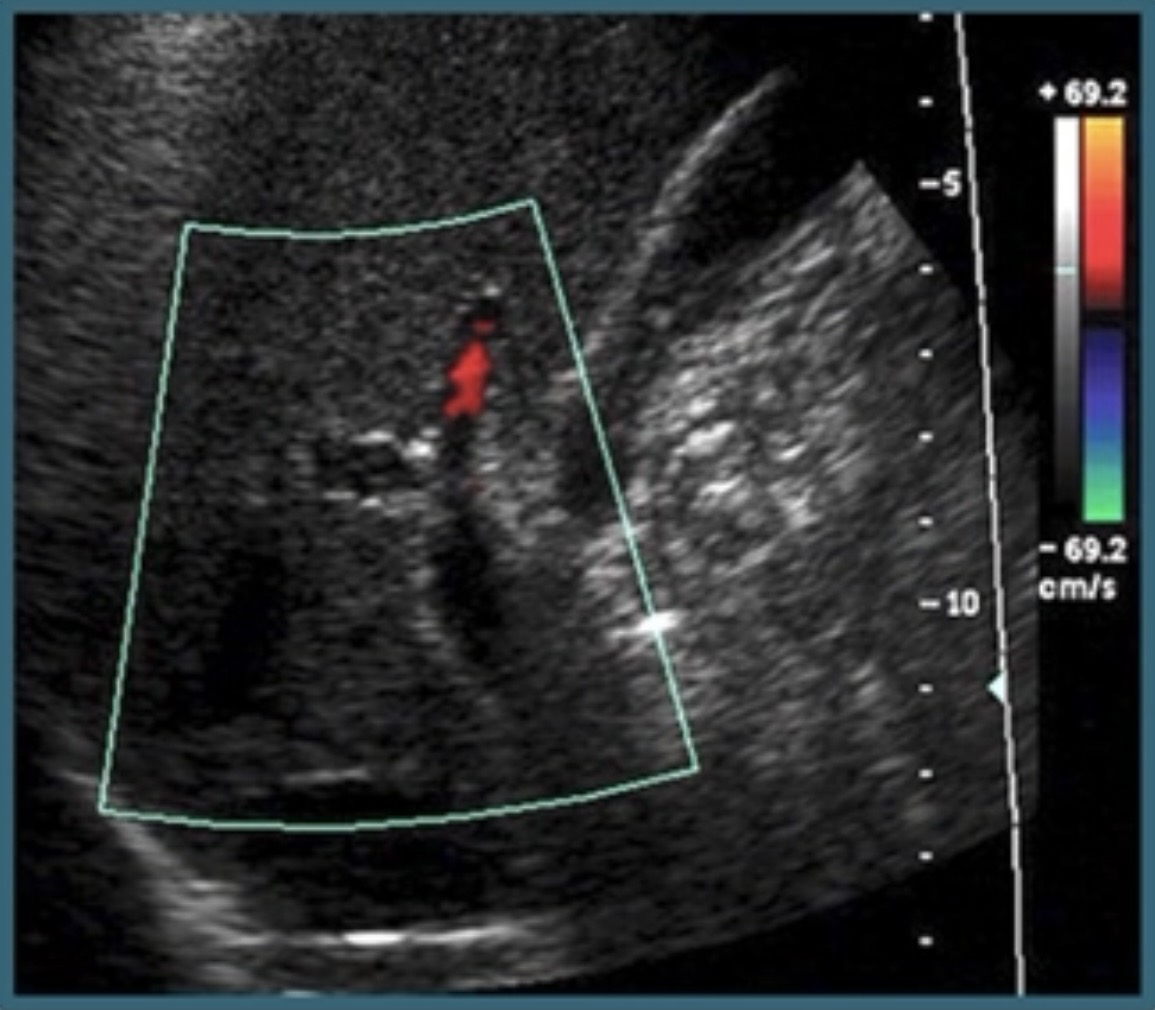
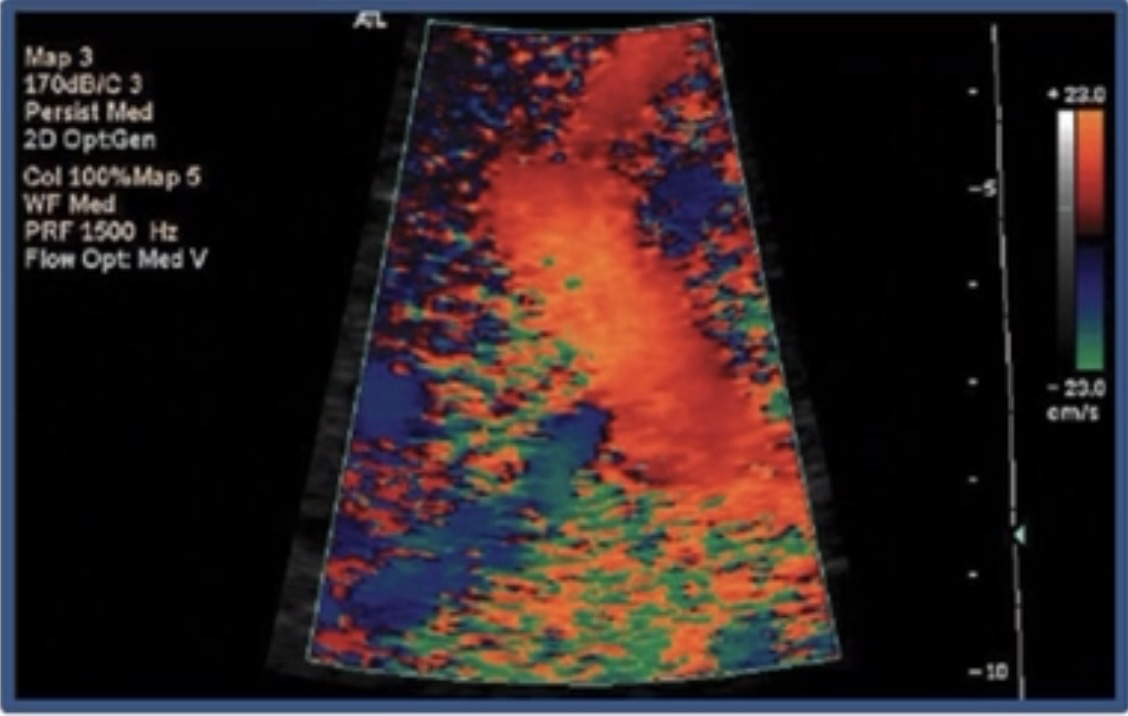
Color velocity scale is too high resulting in no fill of the vessel. Lower the color scale to allow for color to fill.
State what is wrong and how to fix it.
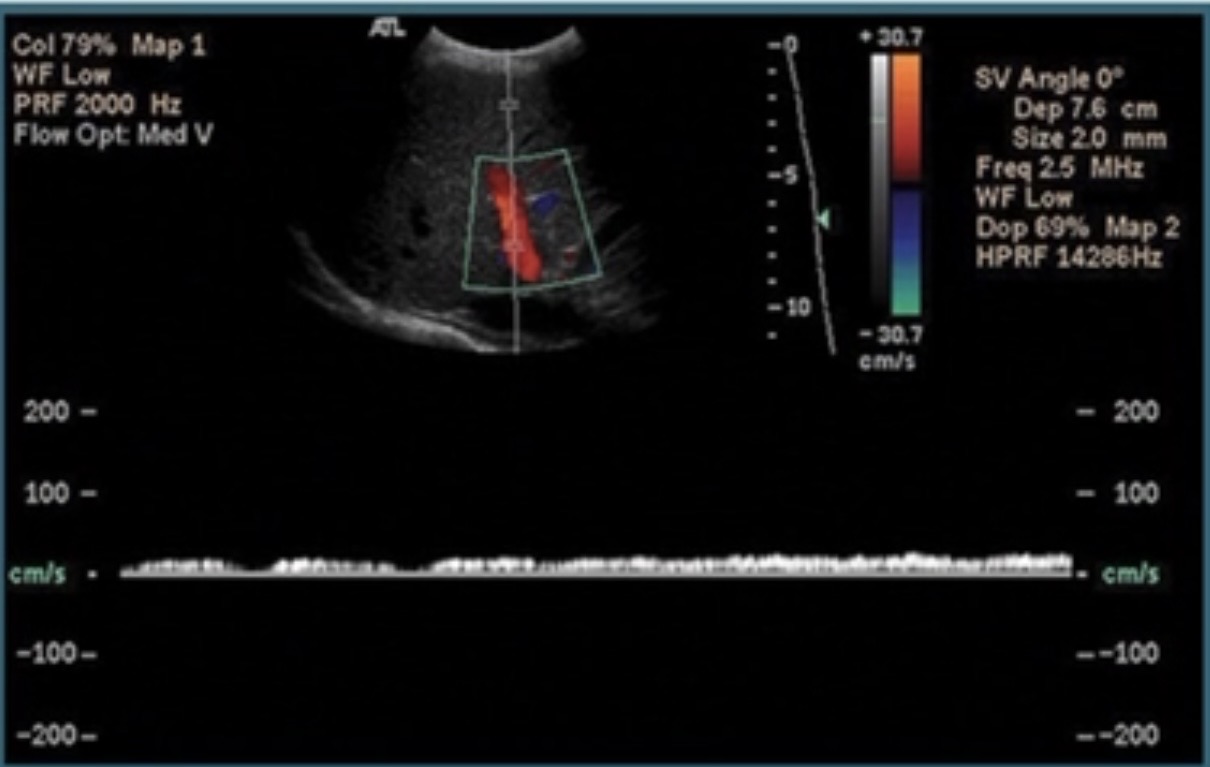
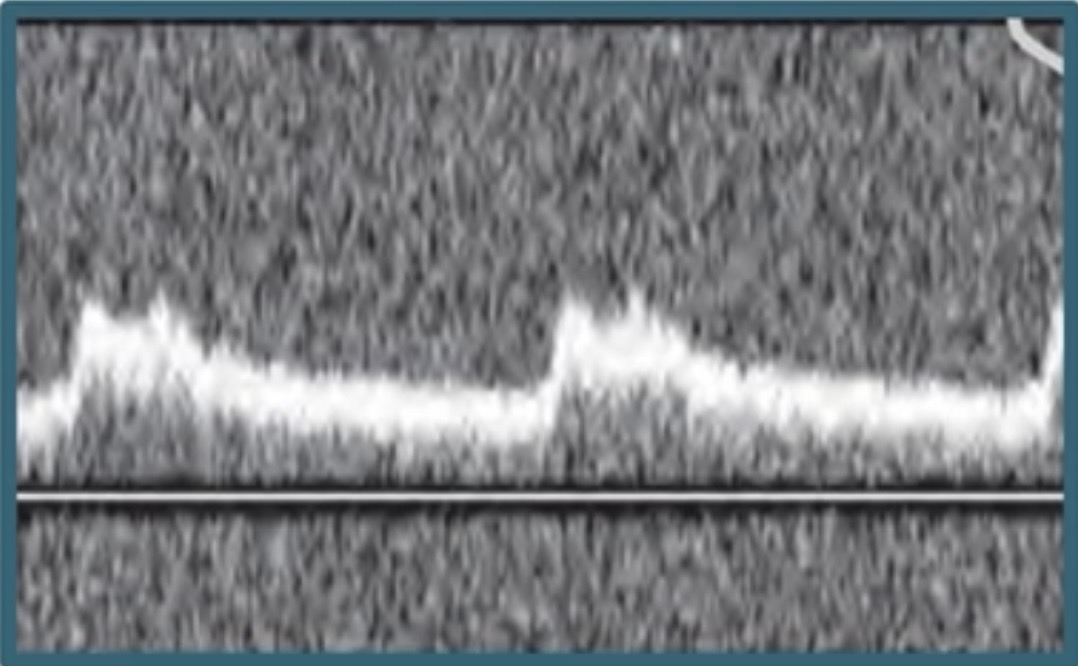
Spectral velocity scale is too high making the waveform look dampened. I would decrease the scale to take up more of the spectral window.
State what is wrong and how to fix it
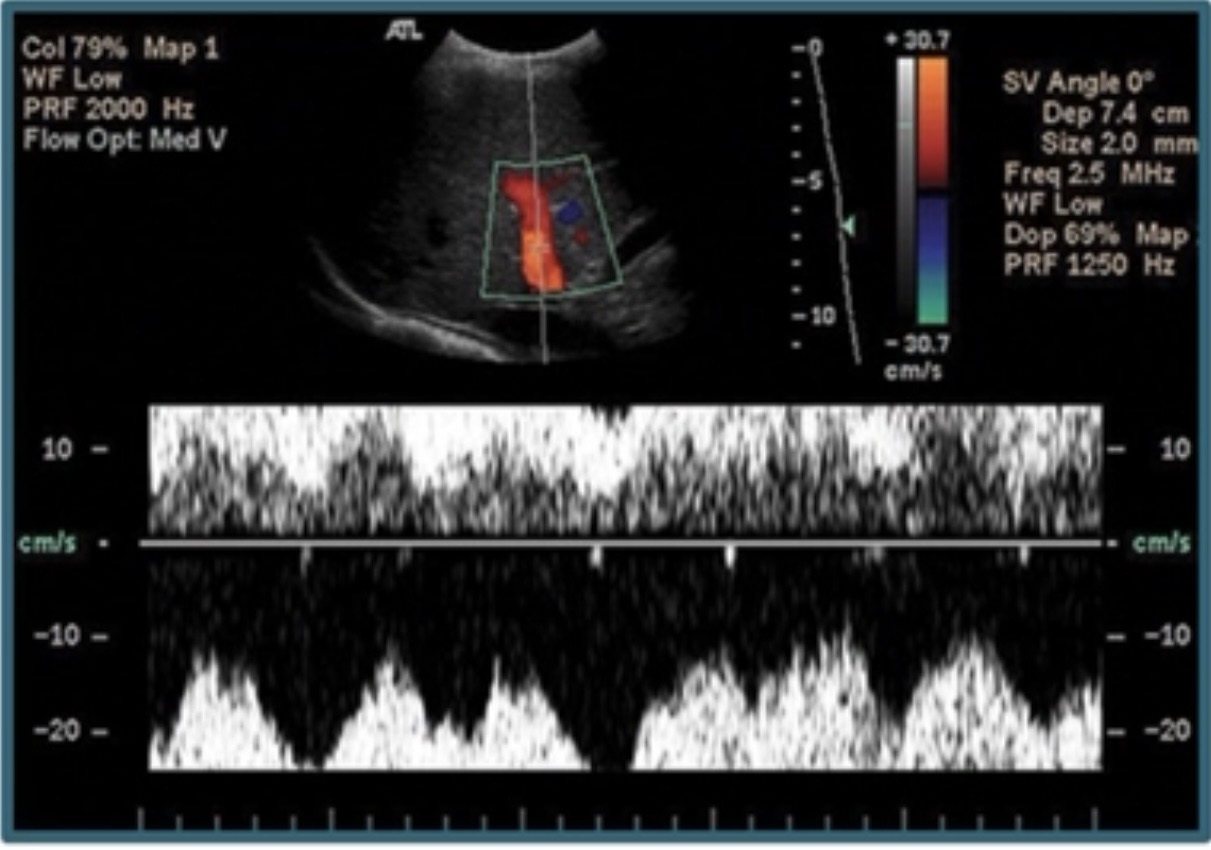
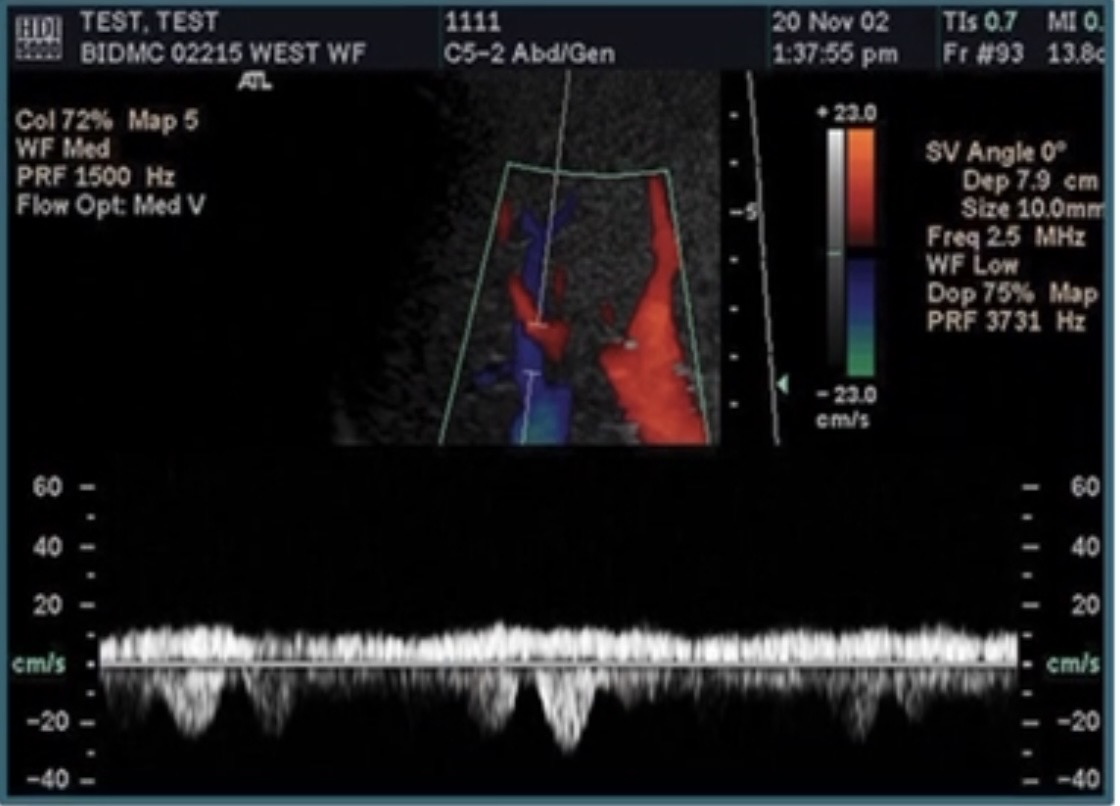
Spectral velocity scale is too high causing aliasing. I would decrease the scale and lower the baseline so the waveform is accurately displayed.
State what is wrong and how to fix it.
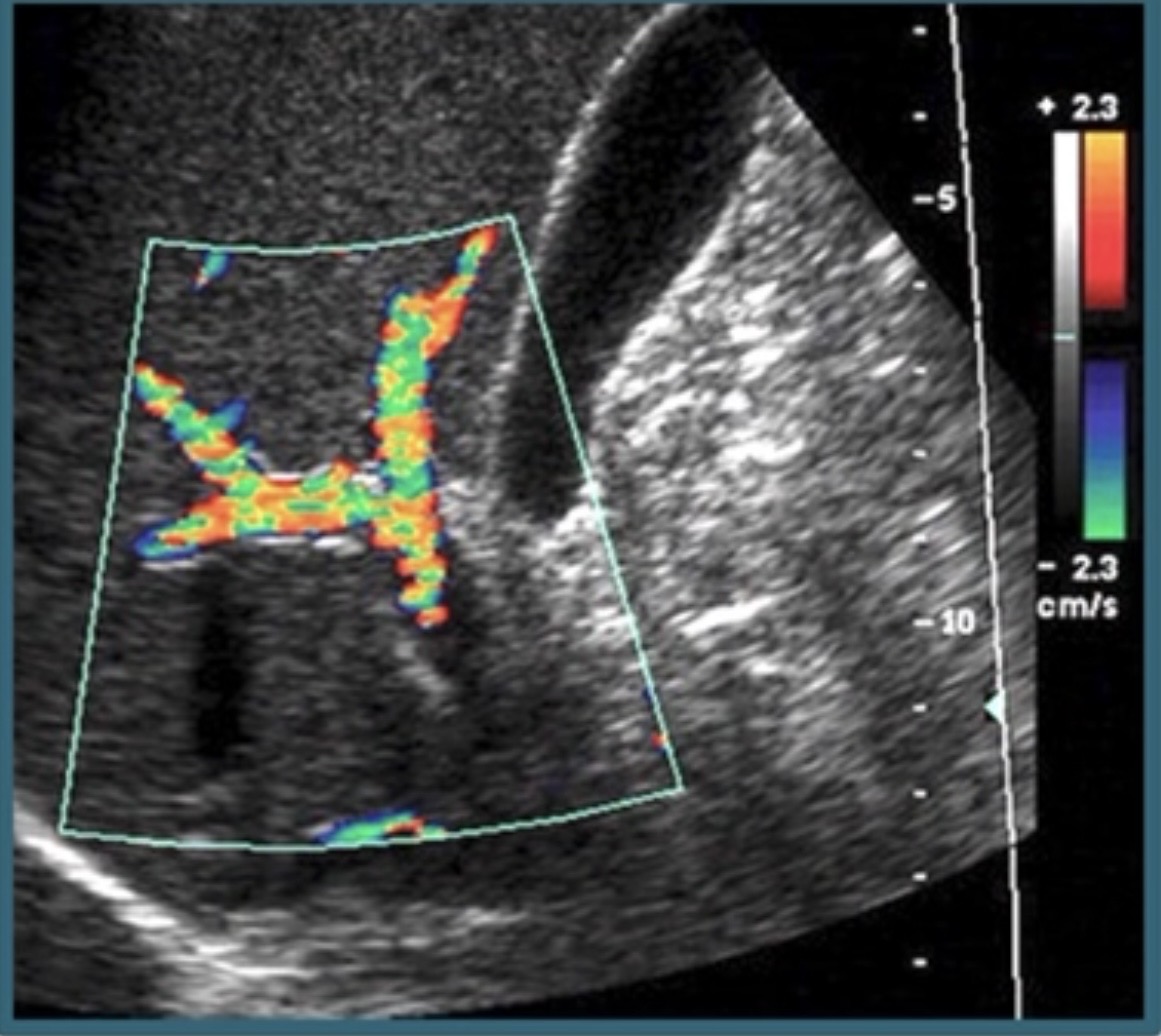
Color scale is too low resulting in color aliasing. I would increase the color scale since it is a larger vessel.
State what is wrong and how to fix it.
The color gain is too high causing blooming artifact to appear throughout color box. Decrease the color gain until only the vessel demonstrates color.
State what is wrong and how to fix it.
The spectral gain is too high causing noise to appear through to spectrum and spectral broadening in the spectral window. I would decrease it to minimize noise/make it echo free and obtain a clear spectral window.
State what is wrong and how to fix it.
The sample gate is too large causing both arterial and venous flow to be shown on the waveform. I would decrease the sample gate size so that it only picks up signals from the intended vessel.
What is wrong and how to fix it.
Increase the sample gate size to detect slow flow since the larger the gate the larger the sample taken.
If you had a vessel that had very slow flow what would you do to your settings to document the presence of slow flow
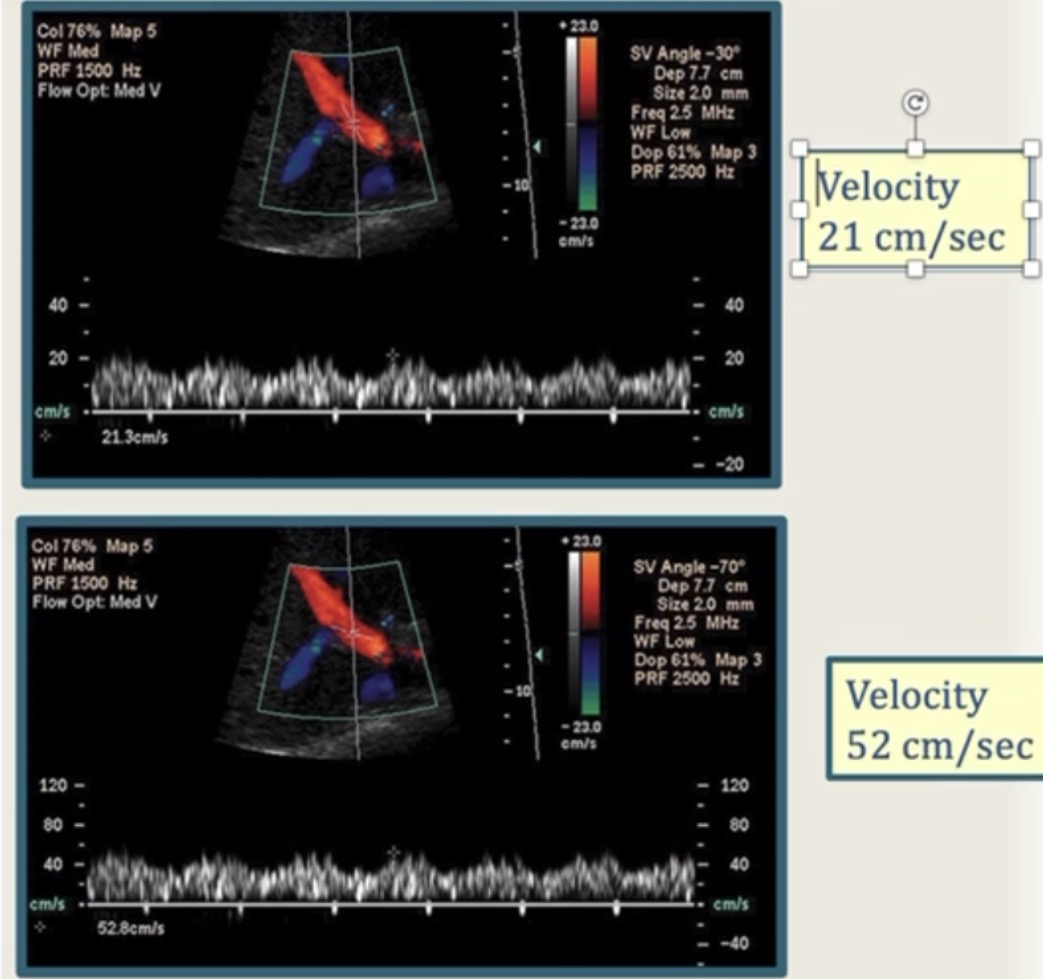
The velocities differ because the angles are different. The first velocity is low because because the angle is 30 which is closer to 0 and 45 degrees which is the desired angle. Second image velocity is high because angle is is over the desired 60 or lower.
Discuss the difference in velocities of these two images?
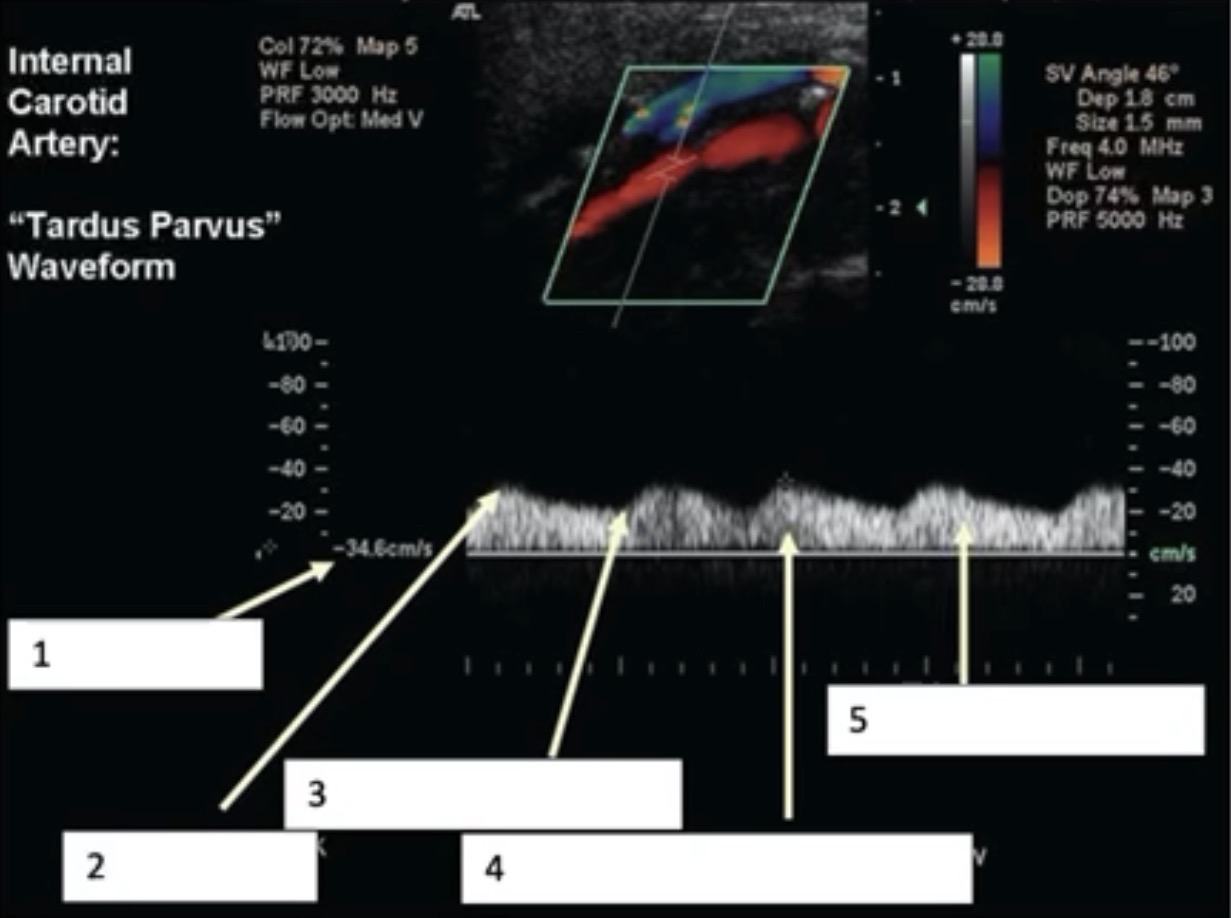
Low flow velocity
Rounded peak systole
Delayed acceleration
Filled-in spectral window
Decreased pulsatility
List 5 areas of distal stenosis.
Proximal or upstream
Less diastolic flow than normal
High velocity
High resistance
Before at stenosis
Highest velocity
Color aliasing
Narrowing
Plaque
Spectral broadening
Post stenotic turbulence at exit
At stenosis
Distal to or downstream
Dampened tardus parvus waveform
Decreased velocity (Low)
Distal to stenosis
IVJ
Subclavian vein
Axillary vein
IVC
List central veins
Pulsatile due to their close proximity to heart.
Describe the waveform for central veins