Wage-Setting Curve
1/3
Earn XP
Name | Mastery | Learn | Test | Matching | Spaced | Call with Kai |
|---|
No analytics yet
Send a link to your students to track their progress
4 Terms
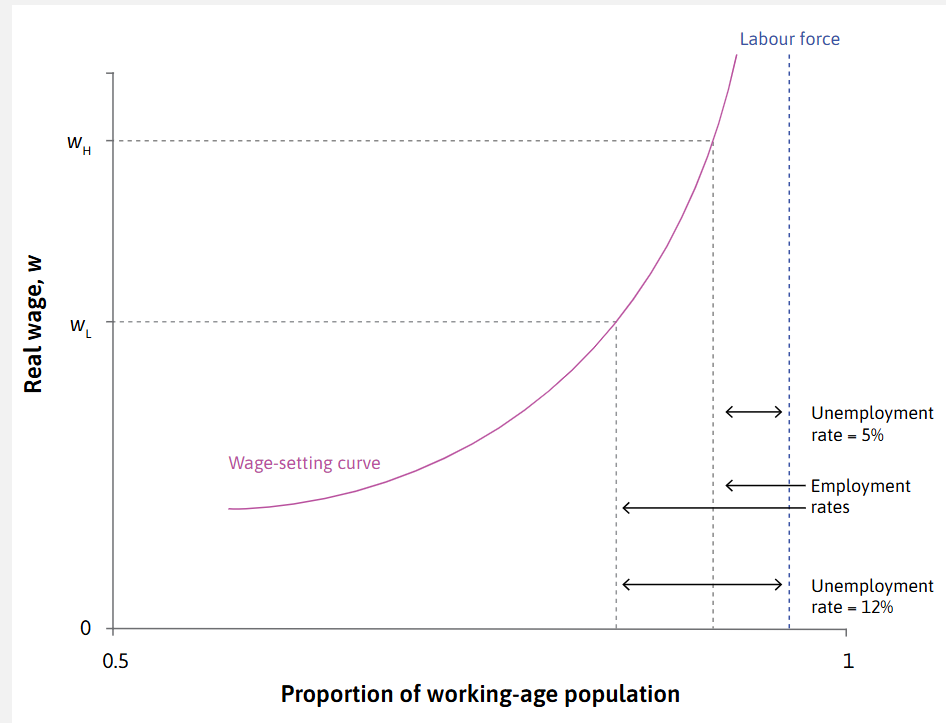
Explain this graph - what is going on?
-Labour Force - usually takes a value less than 1, because the PR won’t be 1
-Inactive workers thus lie to the right of the labour force line
-The employment rate represented by the line from LF to the employment levels, showing the share of the population working
-The unemployment rate is the number of workers in between the employment rate line and the labour force line.
-The curve is the wage-setting curve.
How does the wage-setting curve work?
-Works of the logic of the best response function of the employee. If the employment rate is x, then the Nash equilibrium wage will be w.
-If the best response function changes, for let’s say, a higher unemployment rate, then workers will find it in their best interests to provide more effort at any given wage level due to the increased cost of job loss. Thus, firms will, using their feasible cost lines, ensure that wages will go down while retaining most of the effort
-The WSC shows this. Movements along it showcases how changes in unemployment will lead to changes in real wages across the economy
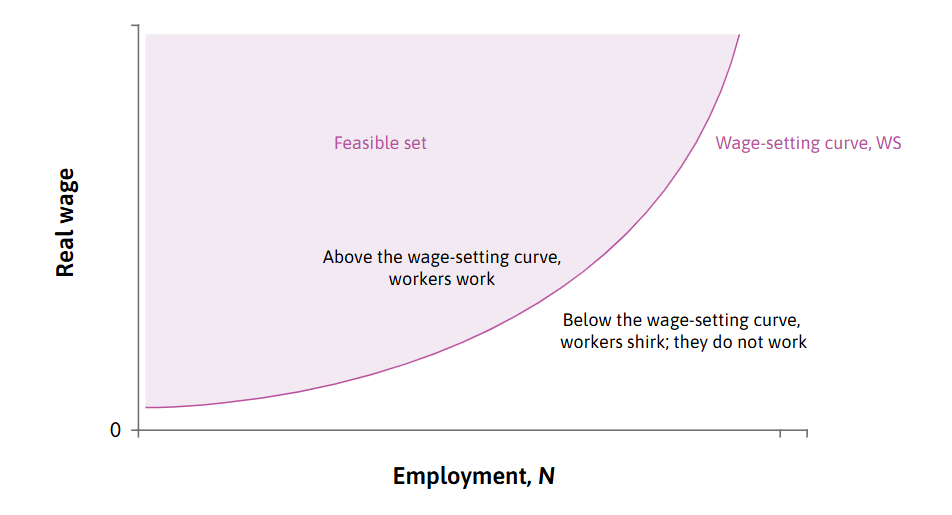
How can the WSC showcase only two levels of efforts?
-Working when the level of effort that the firm owners and managers are seen as good enough
-Shirking when the level of effort is not there.
Lmao
Lmao