Unit 1: One Variable Statistics
1/14
There's no tags or description
Looks like no tags are added yet.
Name | Mastery | Learn | Test | Matching | Spaced | Call with Kai |
|---|
No analytics yet
Send a link to your students to track their progress
15 Terms
Categorical Variable
Measures characteristics that are sorted into categories.
Gender, color, or brand names
Nominal variable
Unordered Categories
Blonde, brown, black
USA, Canada, Japan
Ordinal Variable
Ordered Categories
Dissatisfied, Neutral, Satisfied.
Elementary School, Middle School, High School
Binary
Two Specific Categories
Pass, Fail
Yes, No
Describing a Distribution
CSOCS
Context - What the data represents
Spread - Give the least and highest value in the data set
Range = Maximum - Minimum
Outliers - are there any values that stand out as unusual
2 standard deviations away or 1.5 × 1QR
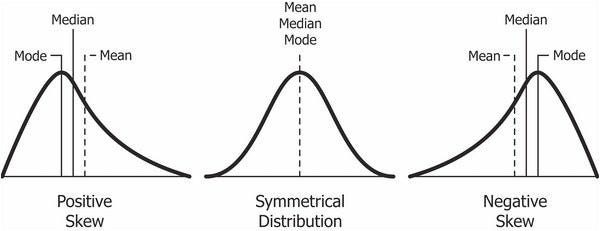
Shape - does the graph symmetry or is it skewed
Shape of a Distribution
Five-Number Summary
Minimum: The lowest value in the dataset
First Quartile: The 25th percentile, or median of the lower half of the data.
Median: The middle value of the dataset.
Third Quartile: The 75th percentile, or median of the upper half of the data.
Maximum: The highest value in the dataset
The Mean (x)
The average of the data
(sum of values) / (amount of numbers)
Median
The middle value of a data set, arranged from highest to lowest
→If the number of observations is odd, the Median is the center of the list (n+1)/2
→If the number of observations even, the center position can be found at (n/2)
Box Plots
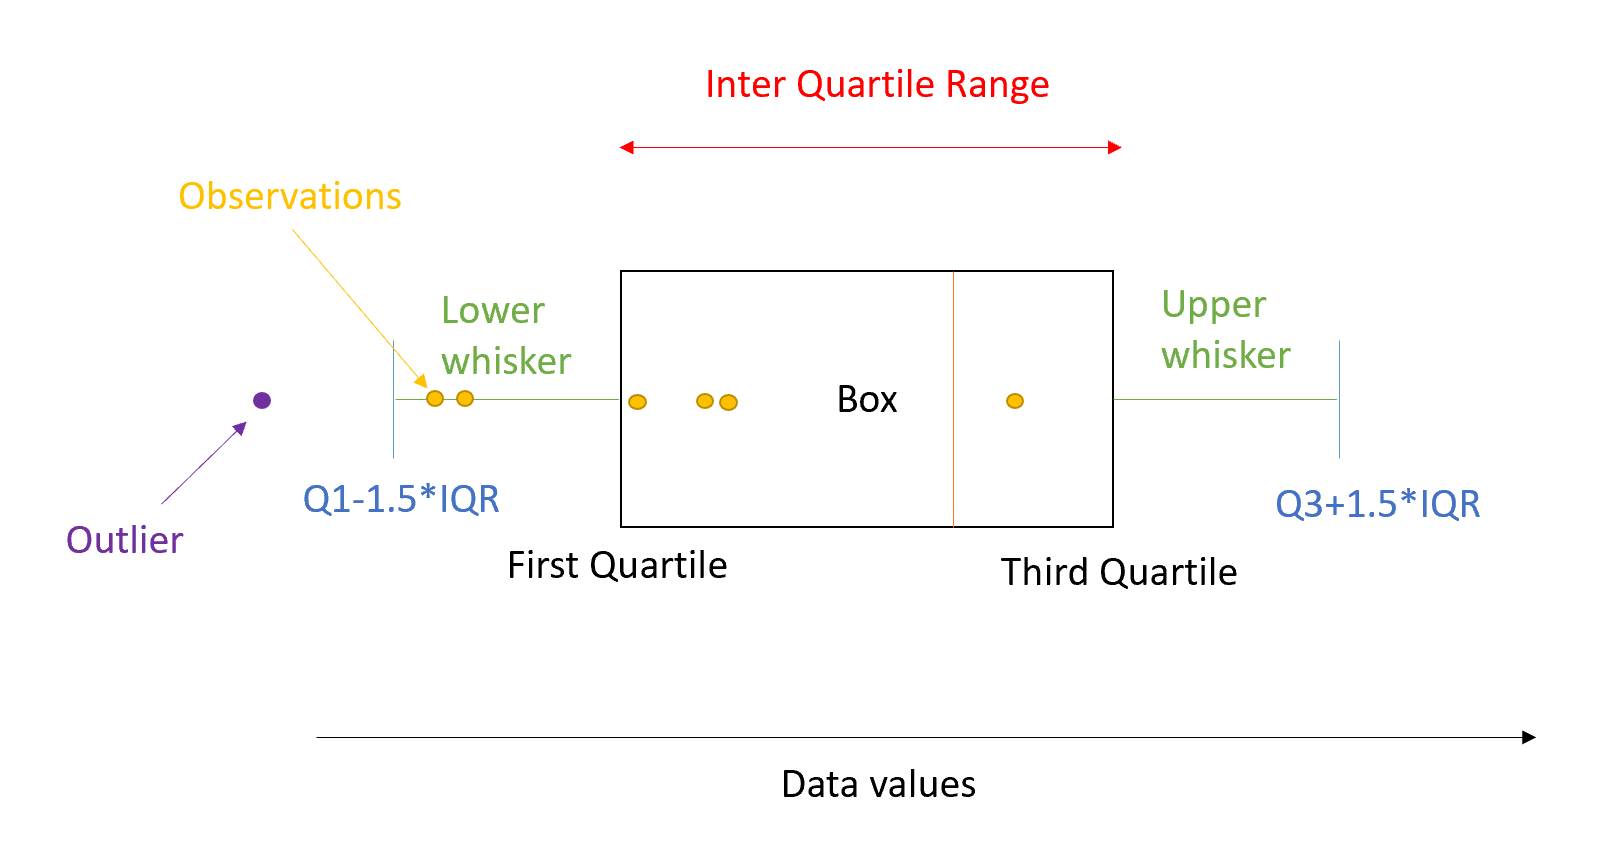
Its a graph of the five-number summary
Interquartile Range (IQR)
Represents the 50% of a data set
IQR = Q3 - Q2
Outliers
1.5 × 1QR
Q1 - 1.5 × 1QR → anything below this boundary is an outlier
Q2 + 1.5 × 1QR →anything above this boundary is an outlier
Standard Deviation (S or Sx)
How far dat is away from the mean
Normal Distribution
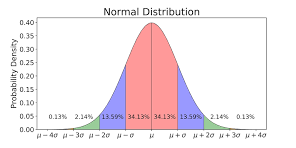
Within one SD - 68%
Within two SD - 95%
Within three SD - 99.7%