S7 tables & graphs, accuracy & precision
0.0(0)
Studied by 1 personCard Sorting
1/19
Earn XP
Description and Tags
Last updated 3:43 PM on 11/18/22
Name | Mastery | Learn | Test | Matching | Spaced | Call with Kai |
|---|
No analytics yet
Send a link to your students to track their progress
20 Terms
1
New cards
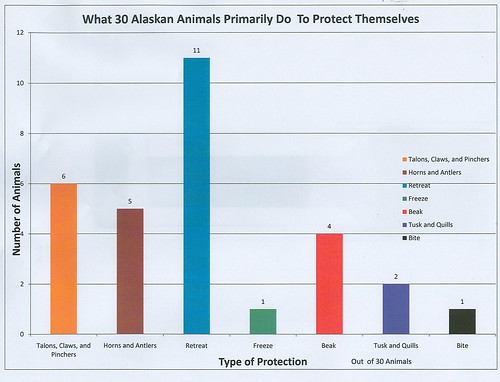
bar graph
graph that shows the relationship between one categorical variable and one continuous variable
2
New cards
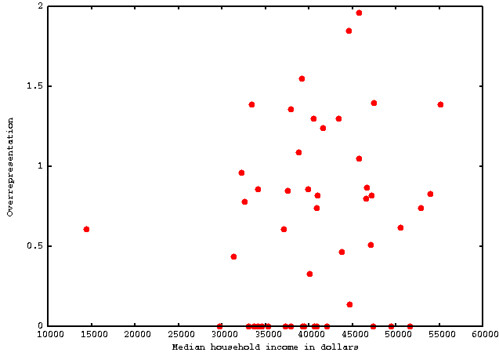
XY scatter
graph that shows the relationship between two continuous variables
3
New cards
x-axis
the horizontal line where the independent variable belongs on a graph
4
New cards
y-axis
the vertical line where the dependent variable belongs on a graph
5
New cards
interpolation
estimating a value within the range of measured data by using the line of best fit on a graph
6
New cards
extrapolation
estimating a value beyond the range of measured data by using the line of best fit on a graph
7
New cards
line of best fit
a line drawn in a scatter plot to fit most of the data points and which shows the relationship between the IV and DV
8
New cards
units
written on the axes, along with labels, to indicate how the data was measured
9
New cards
labels
written on the axes, along with units, to indicate the IV (x-axis) or DV (y-axis) is
10
New cards
table and graph title format
The effect of (IV) on (DV)
11
New cards
pie chart
a chart that shows the relationship of a part to a whole
12
New cards
error bars
used of a graph to show the variability of a data set
13
New cards
range
Distance between highest and lowest scores in a set of data.
14
New cards
accuracy
how close a measurement is to the true value (evaluated using the average of a data set)
15
New cards
precision
a measure of how close a series of measurements are to one another
16
New cards
average (mean)
the sum of a set of numbers divided by the number of numbers in a set
17
New cards
overlapping error bars
data sets are not considered conclusively different because the data is too similar
18
New cards
short error bars
data set is precise bc small range of data
19
New cards
long error bar
data set is not precise bc large range of data
20
New cards
error bars without overlap
data sets are conclusively different bc most data is not the same