MG205 Understand
1/48
There's no tags or description
Looks like no tags are added yet.
Name | Mastery | Learn | Test | Matching | Spaced | Call with Kai |
|---|
No analytics yet
Send a link to your students to track their progress
49 Terms
Level log model (all)
Log-level: log(y) = β₀ + β₁x + ε
A one-unit increase in x is associated with a (100·β₁)% change in y.
Level-log: y = β₀ + β₁log(x) + ε
A 1% increase in x is associated with a (β₁/100)-unit change in y.
Log-log: log(y) = β₀ + β₁log(x) + ε
A 1% increase in x is associated with a β₁% change in y. (β₁ is the elasticity.)
![<p><strong>Log-level: log(y) = β₀ + β₁x + ε</strong></p><ul><li><p>A one-unit increase in x is associated with a (100·β₁)% change in y.</p></li></ul><p class="font-claude-response-body break-words whitespace-normal leading-[1.7]"><strong>Level-log: y = β₀ + β₁log(x) + ε</strong></p><ul><li><p>A 1% increase in x is associated with a (β₁/100)-unit change in y.</p></li></ul><p class="font-claude-response-body break-words whitespace-normal leading-[1.7]"><strong>Log-log: log(y) = β₀ + β₁log(x) + ε</strong></p><ul><li><p>A 1% increase in x is associated with a β₁% change in y. (β₁ is the elasticity.)</p></li></ul><p></p>](https://assets.knowt.com/user-attachments/09c42519-c39e-4cef-a2be-9a9ce3b5267b.png)
what are mp?

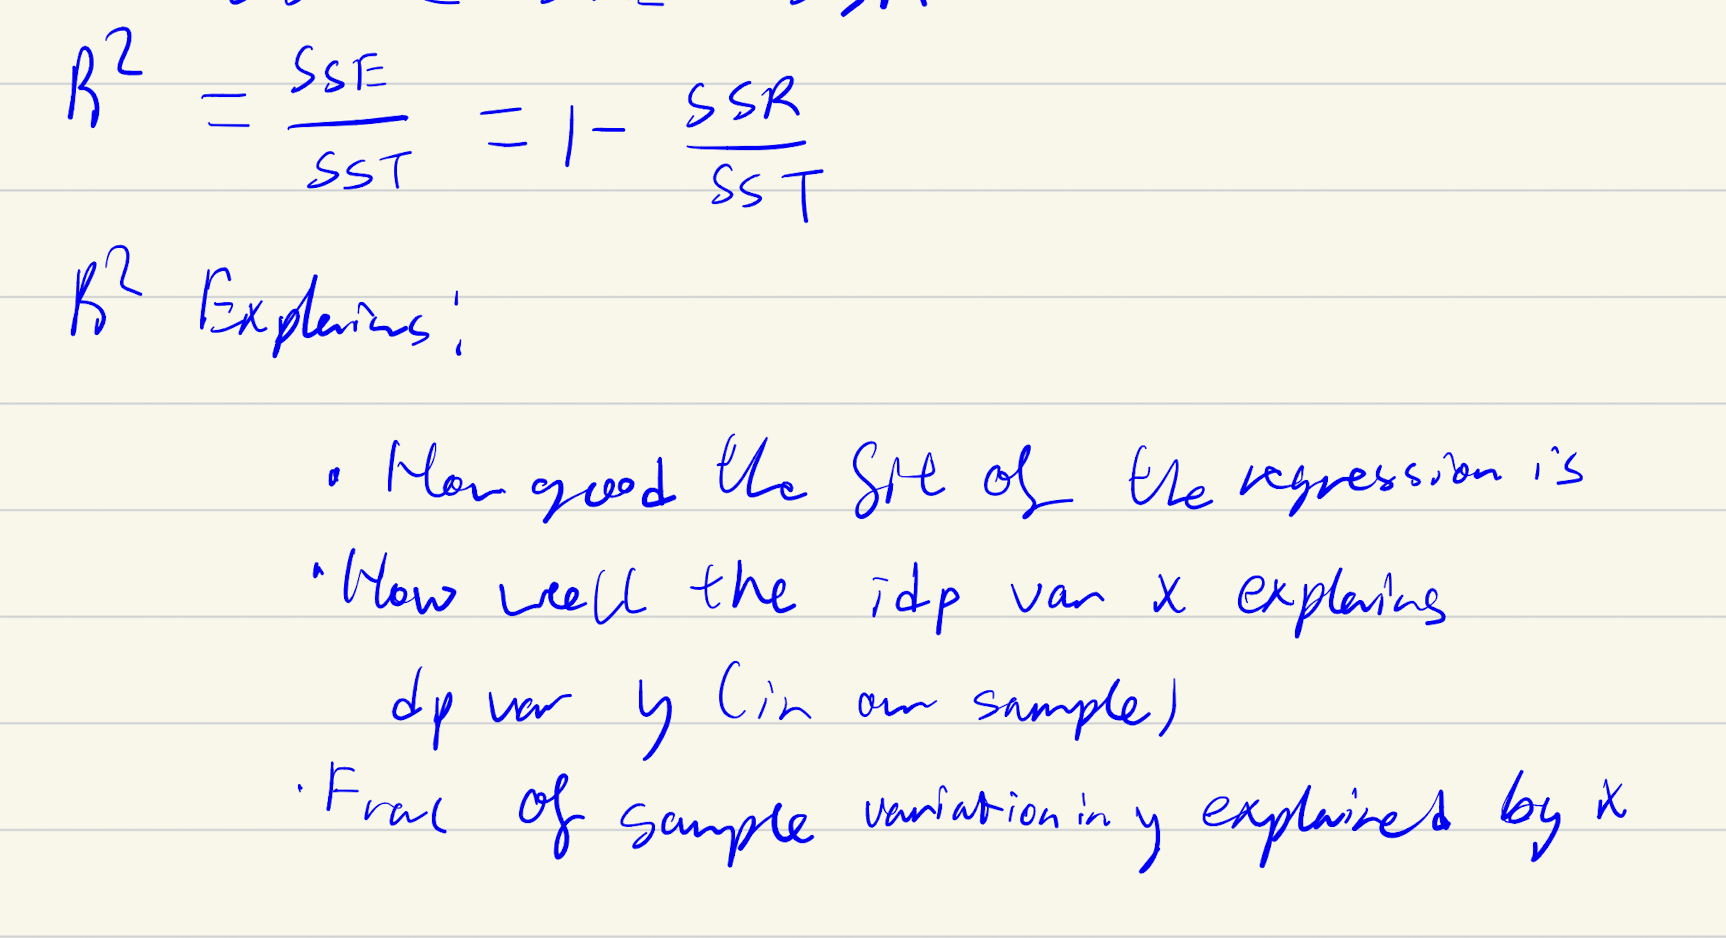
R²
also = var(y-est)/var(y)
How to check whether a regression is done right
see if meet MP
Statistical properties
conditions to satisfy for ols to be good.
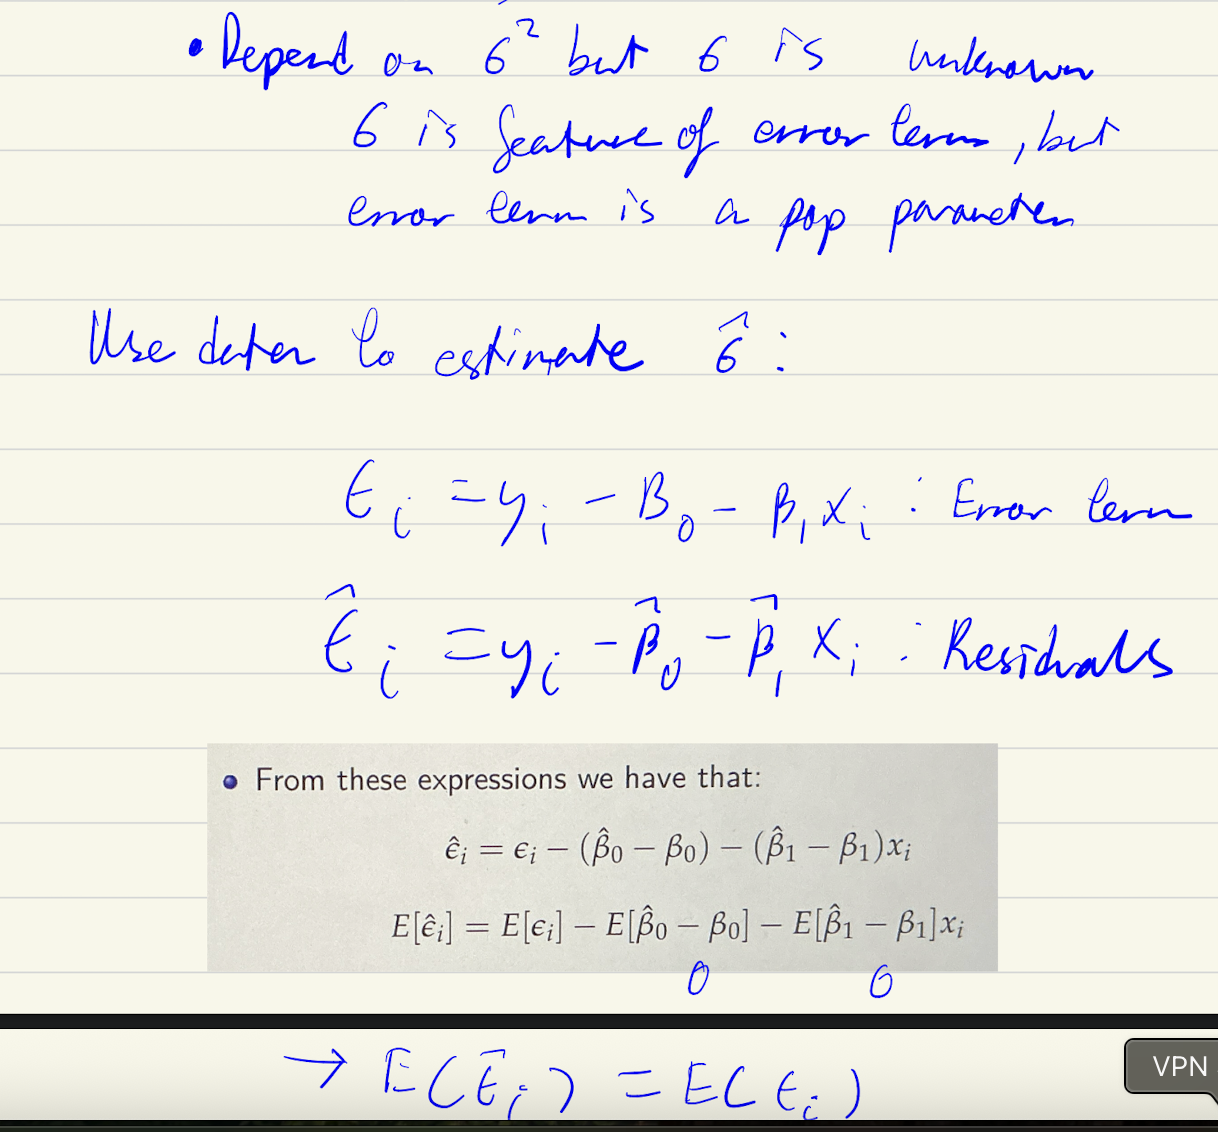
Error term vs residual
in expectation they are identical.
unbiasedness or low variance
unbiasedness always preffered even if high variance→or else meaningless even if low variance
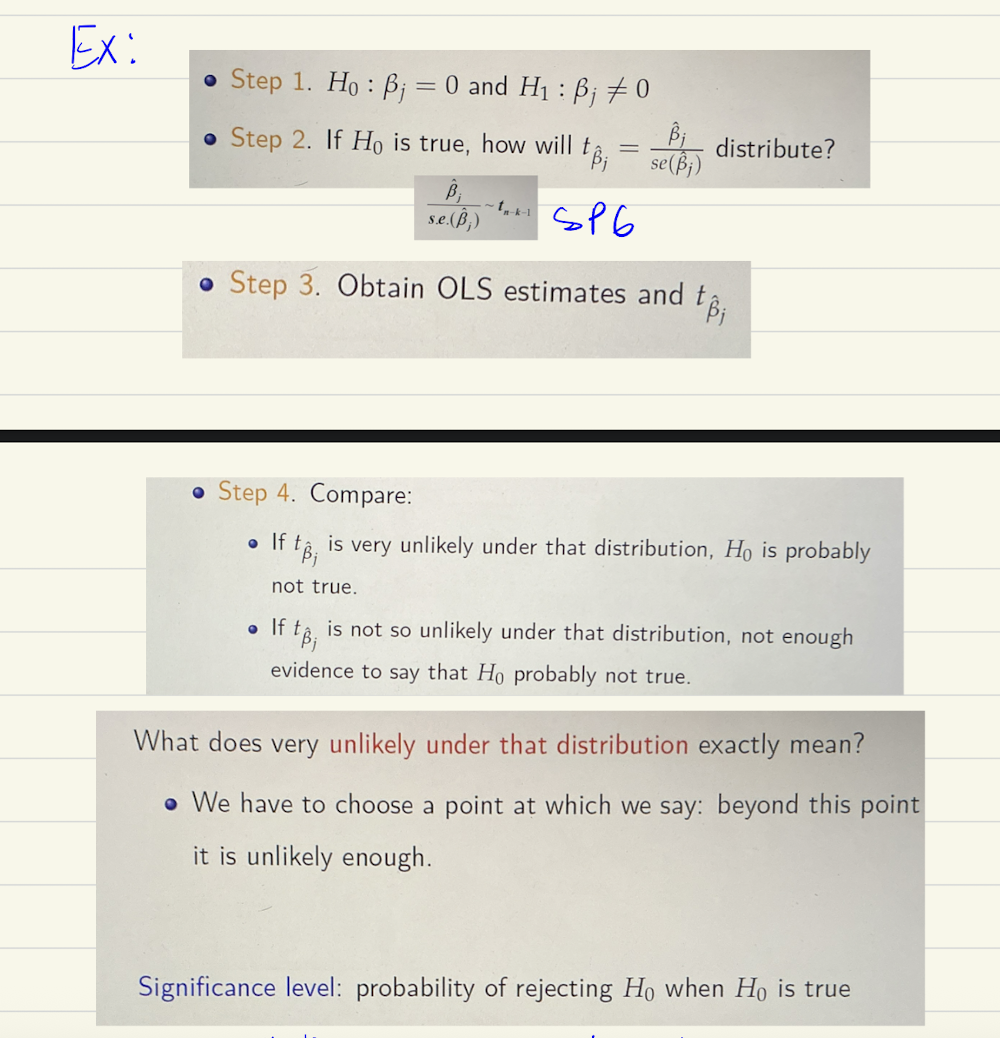
Hypothesis process
Assume null hypothesis is true
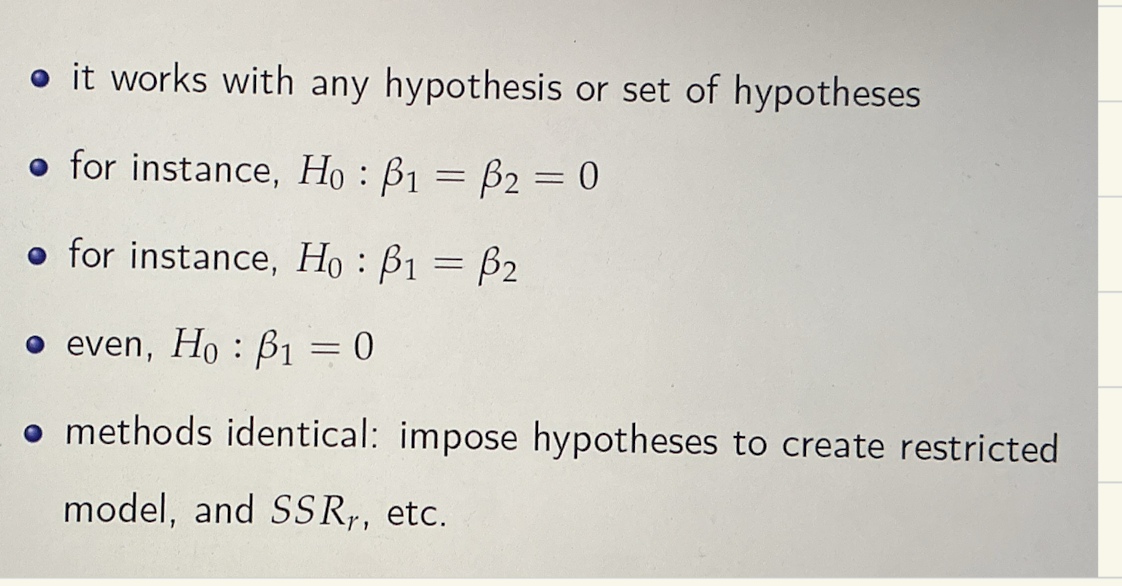
When to use F test
Testing multiple hypothesis
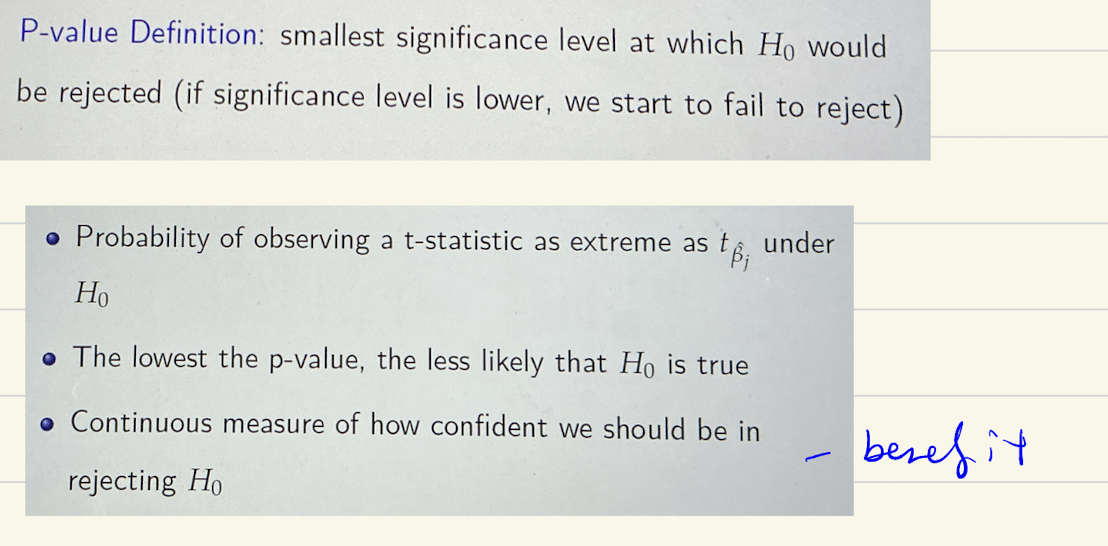
P-value
sig value that maps the t-statistic
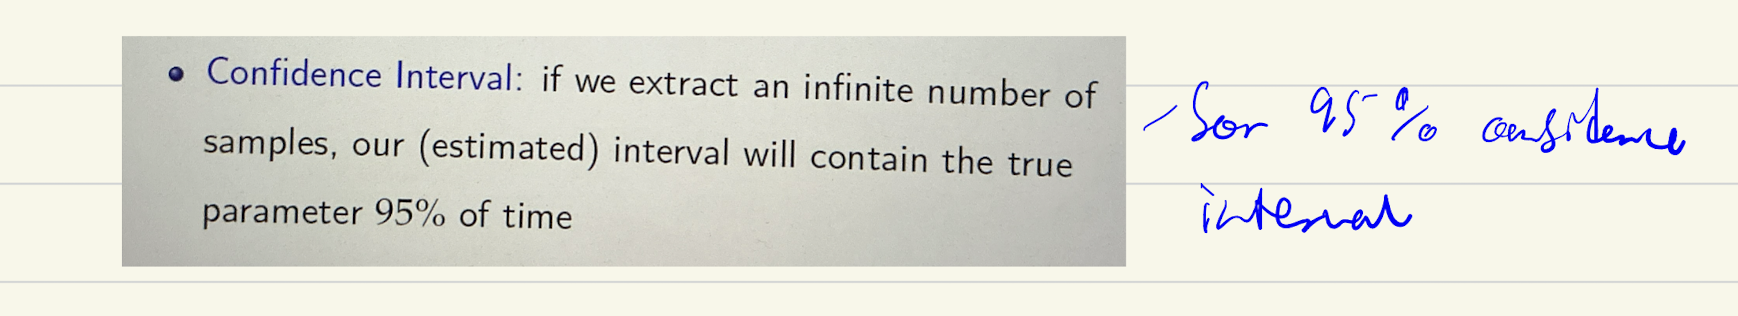
confidence interval - what it means
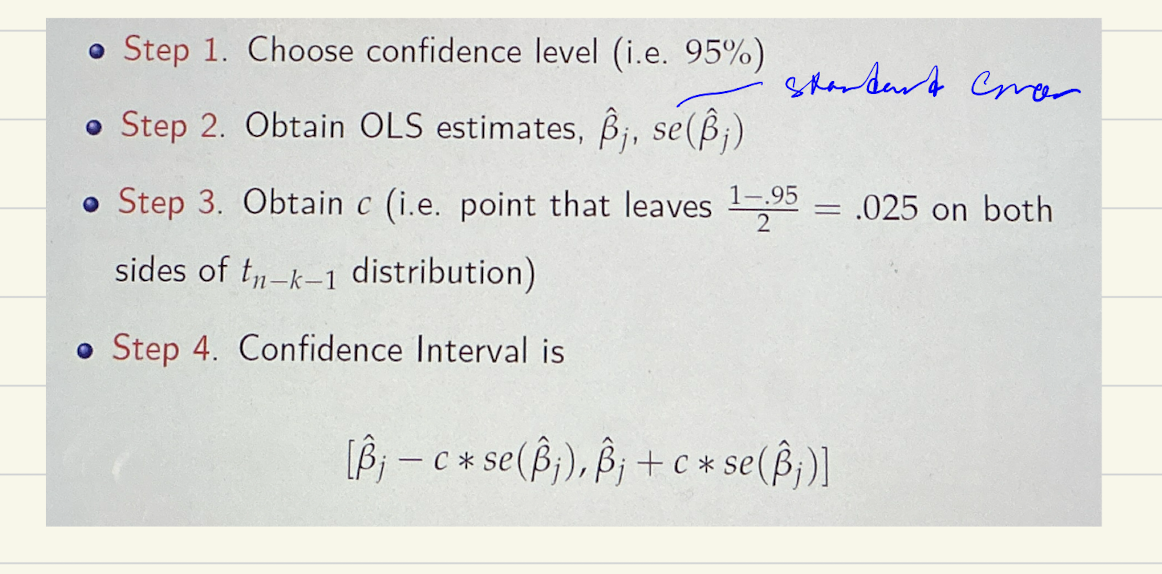
Steps of confidencce interval
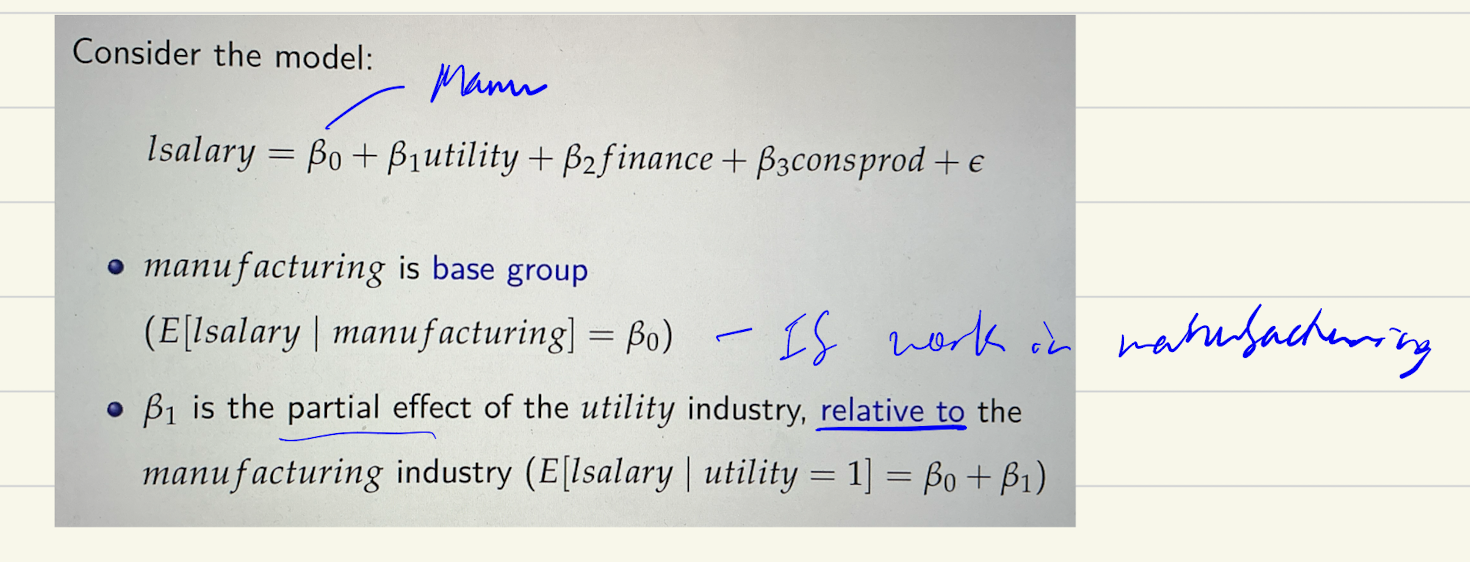
Dummy variables - what coefficients mean
coefficient is relative usually;
ex: if utility coefficient is 0.35. then salary in the utility industry is 35% lower than in the manufacturing industry
Non linear Relations
Can regress on x + x2 + x3…to see if coefficient is stats sig - if is then likely that type of relation
Need to still meet as1: linearity

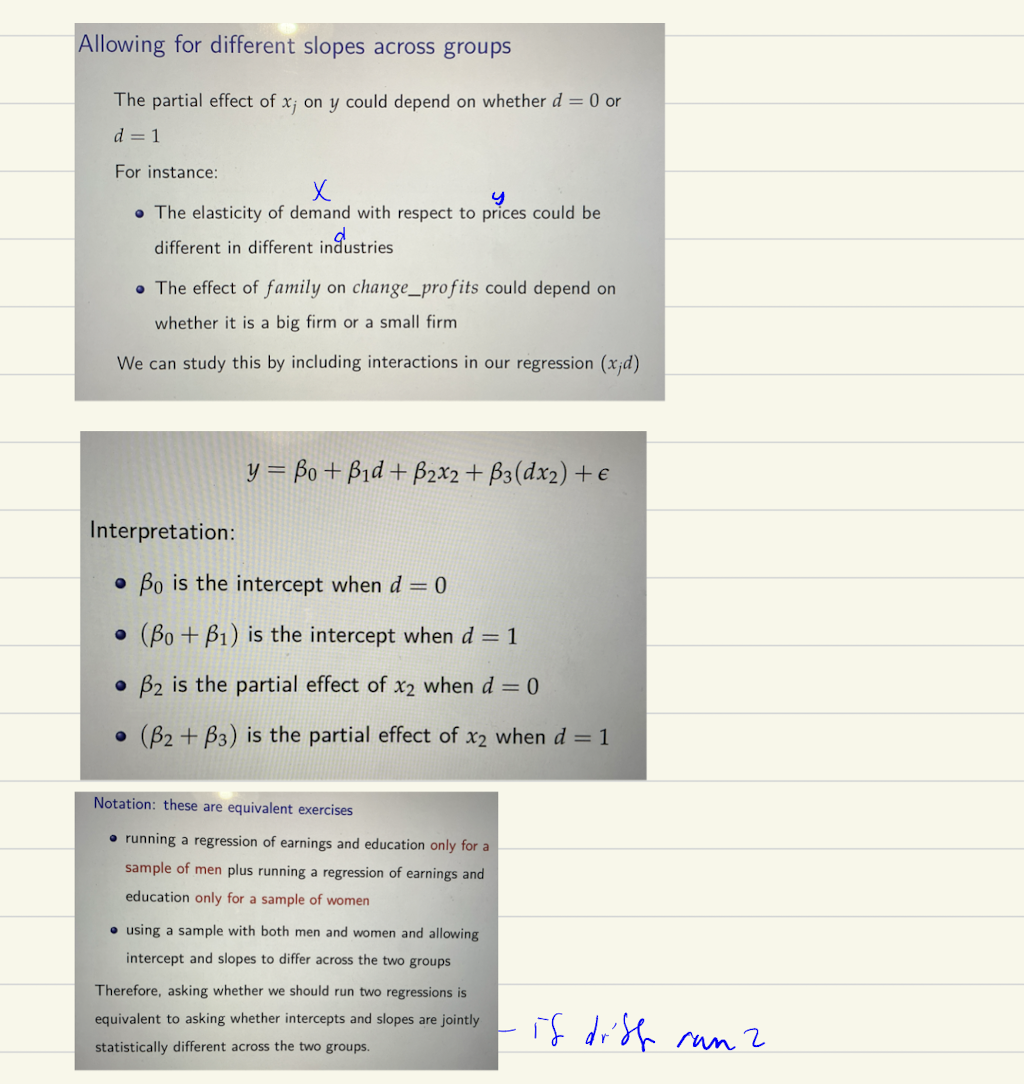
intersection of dummies/groups - what to do
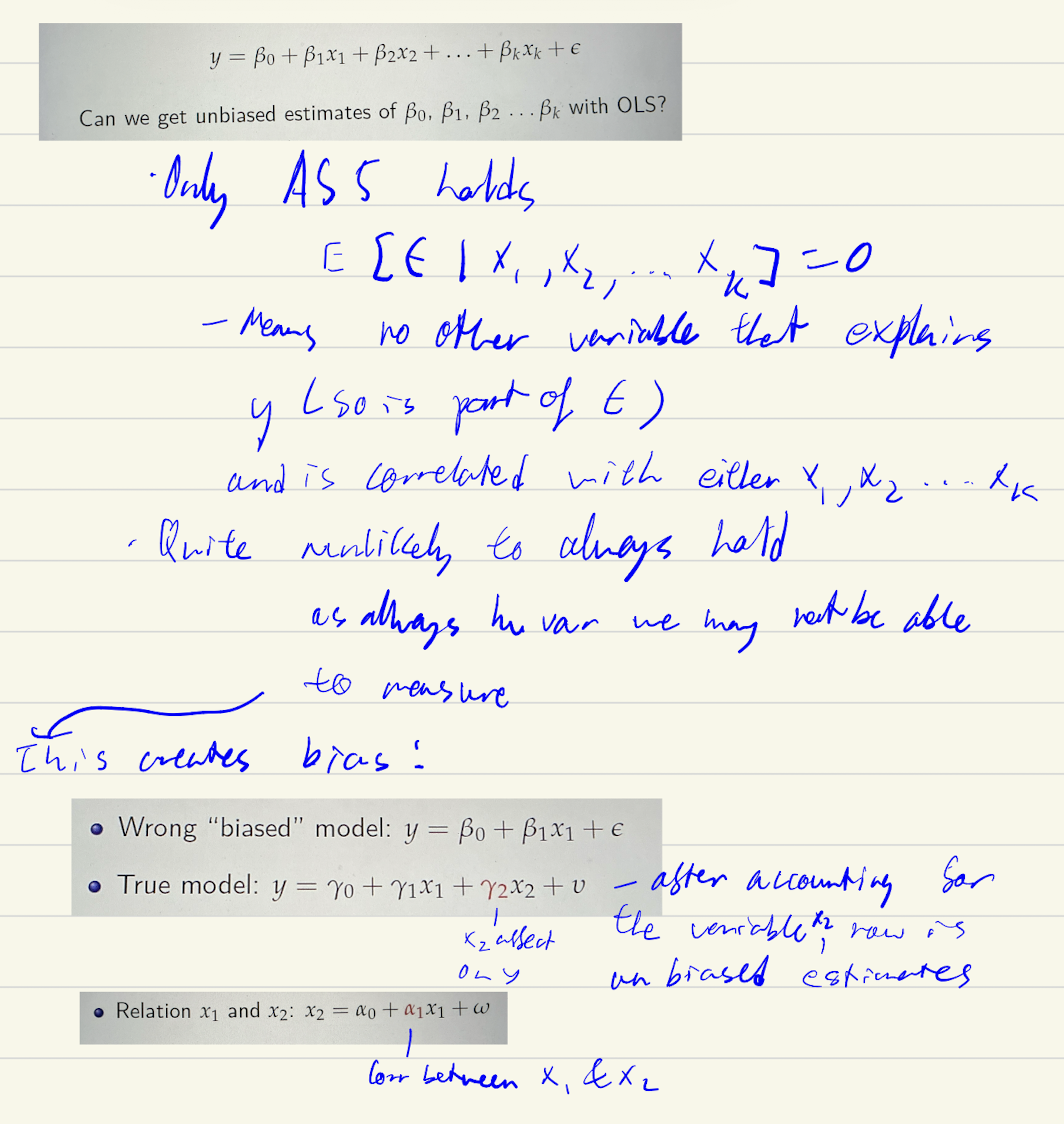
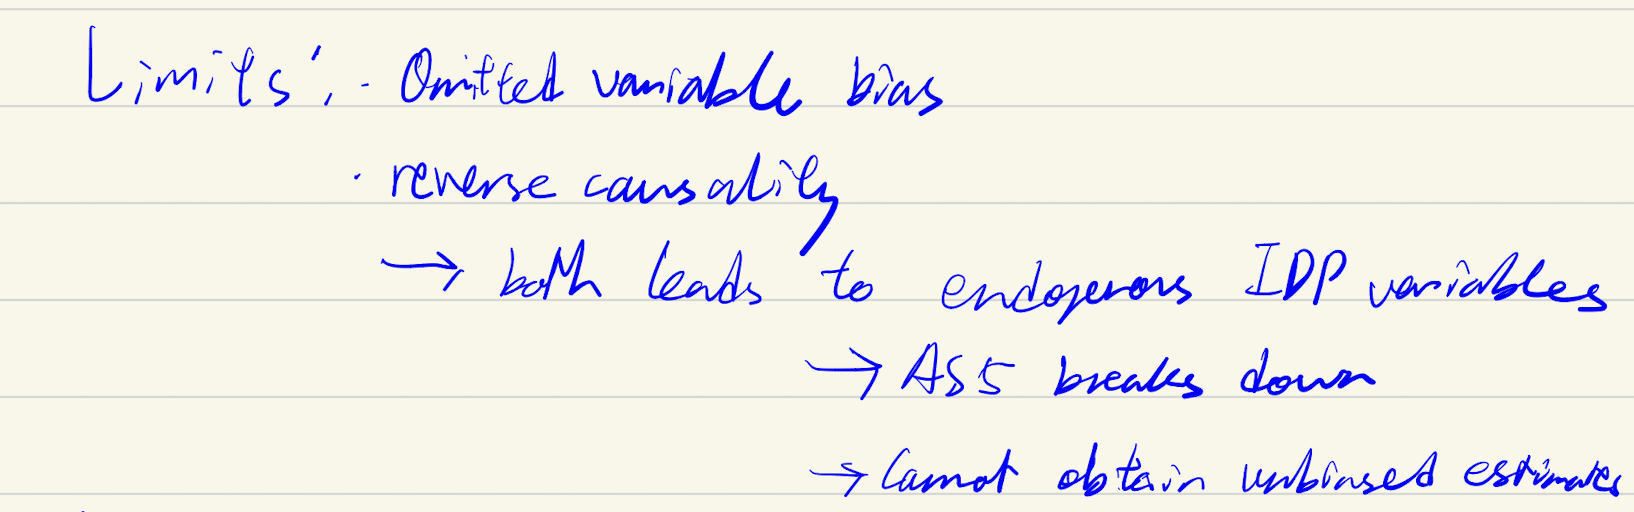
OVB (Limitator)
impacts as5
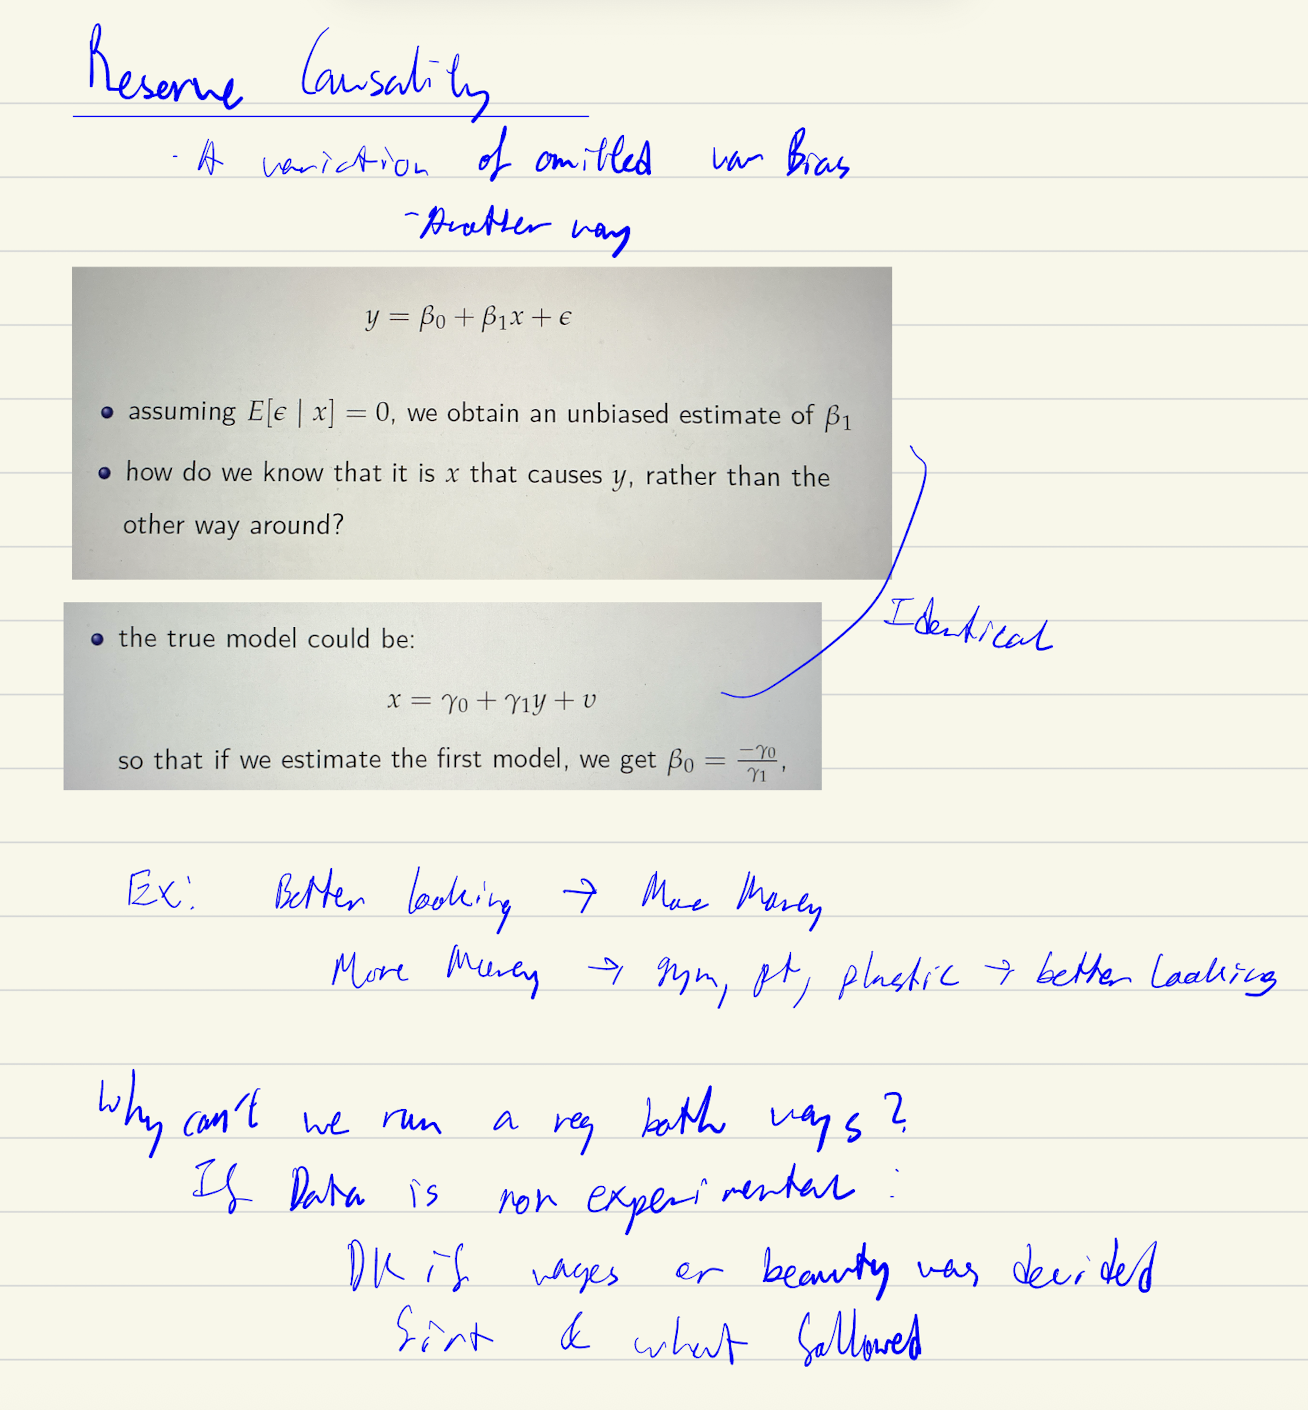
Reverse causality (limitator of OLS)
impacts as5
Non Random Samples (limitator)
A lot of variables can lead to non random samples. When looking at something impacts on firm profitability → lead to AS5 failure as firms with good profits more likely to boast.
Why AS2 not neccessary? Large firms likely have more resources and can respond to telephone survey, though not random error term is still expected 0 → as5 still hold

How to deal with outliers
outliers impact ols, because it tries to minimise sum of squared residuals, giving more weight to outliers

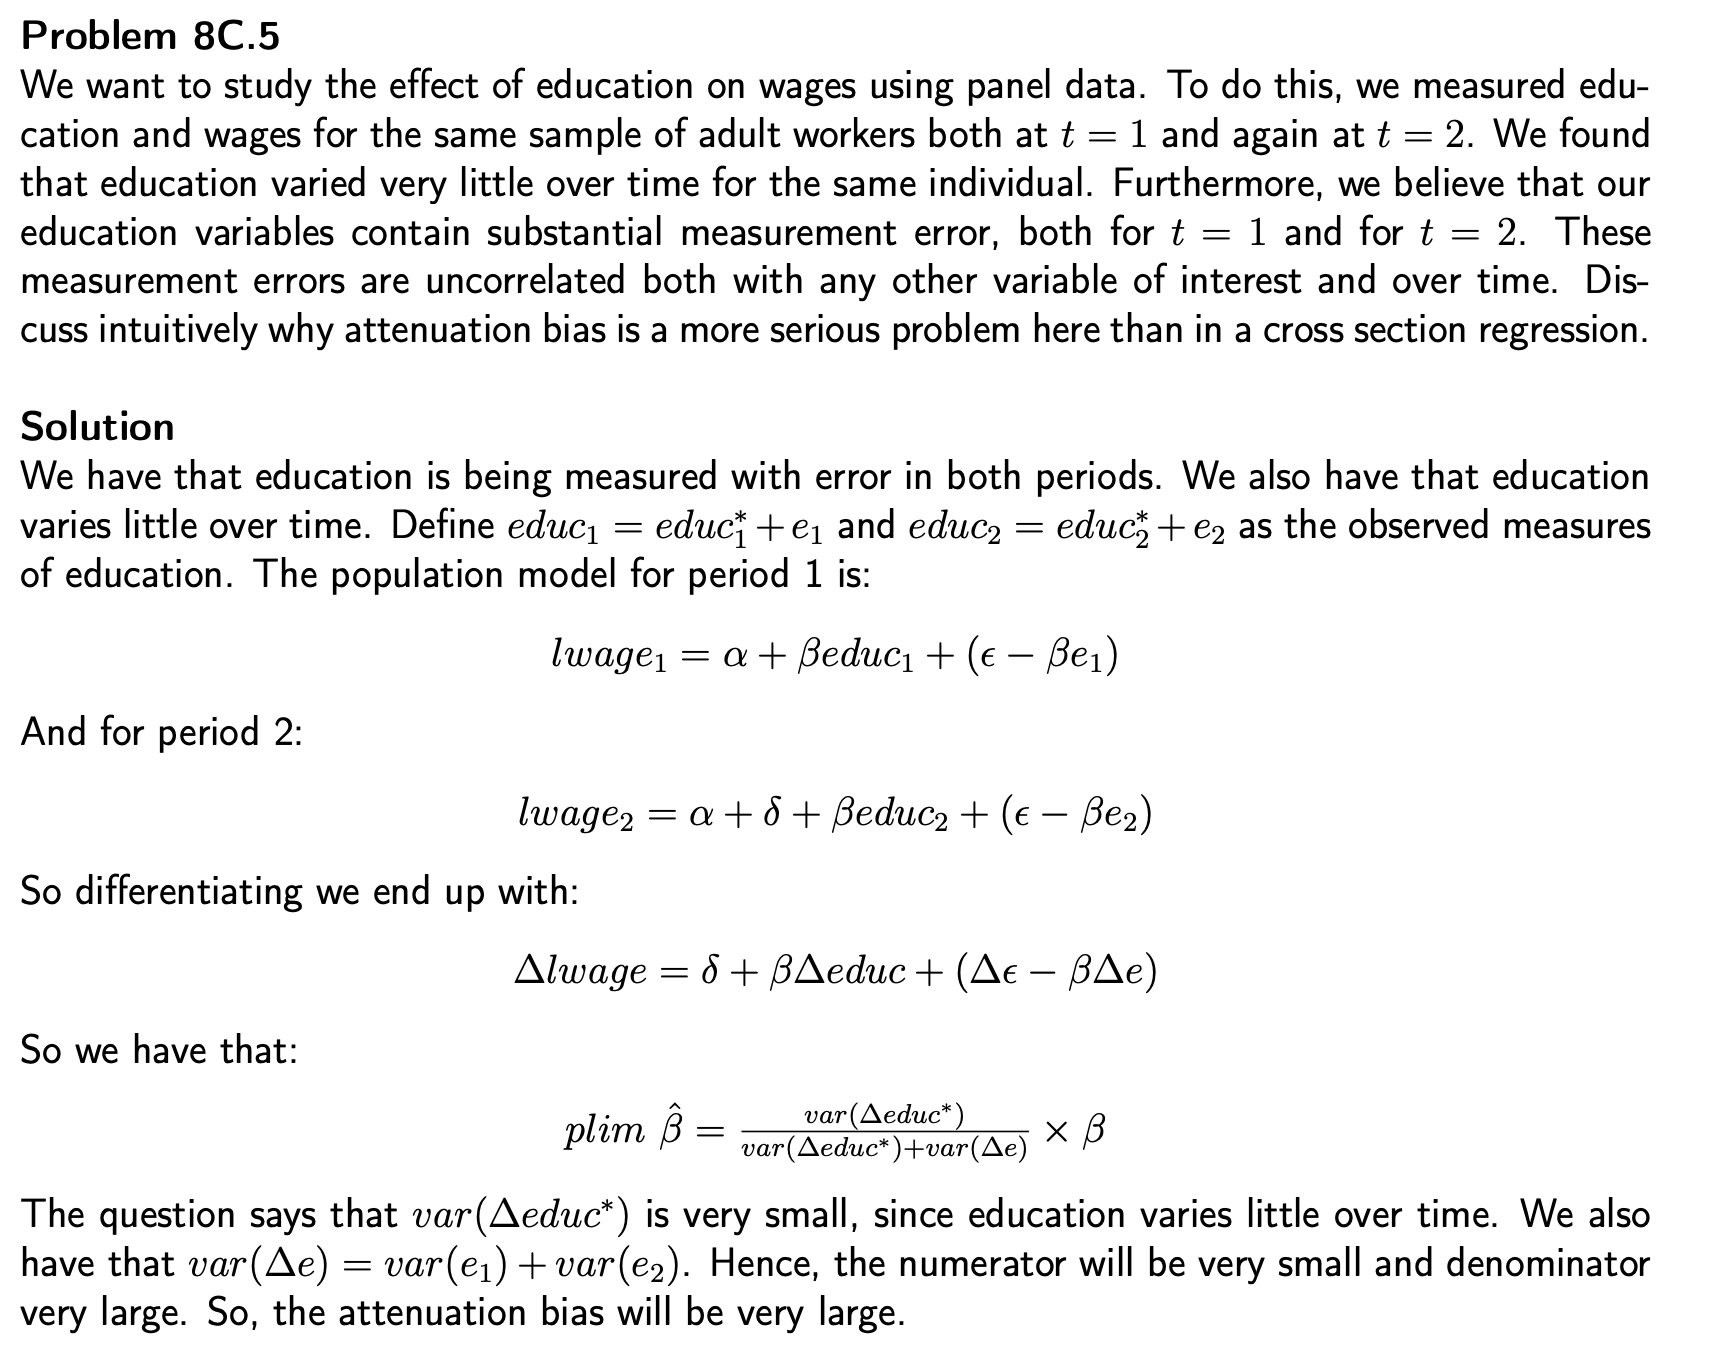
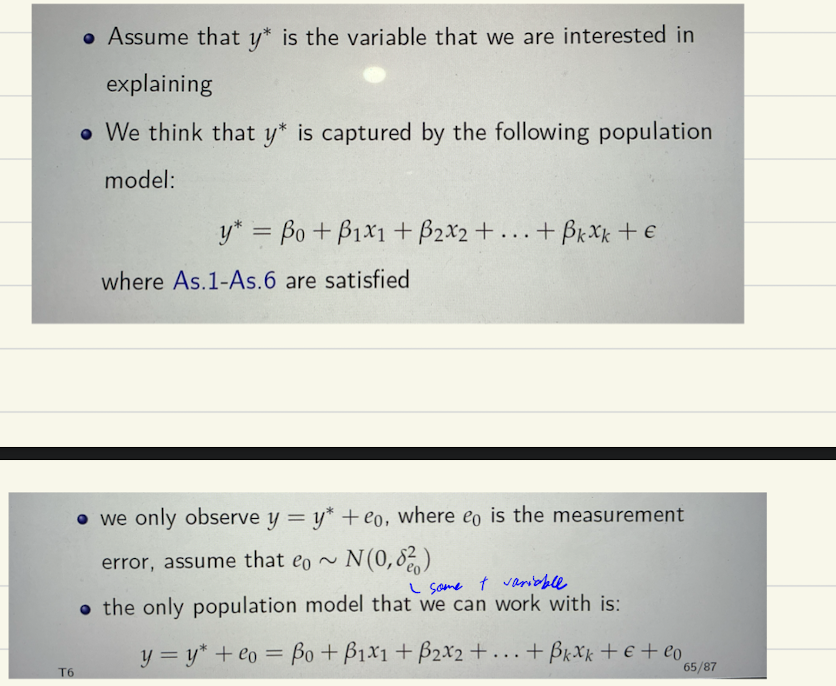
Measurement error - what is it, why it happens
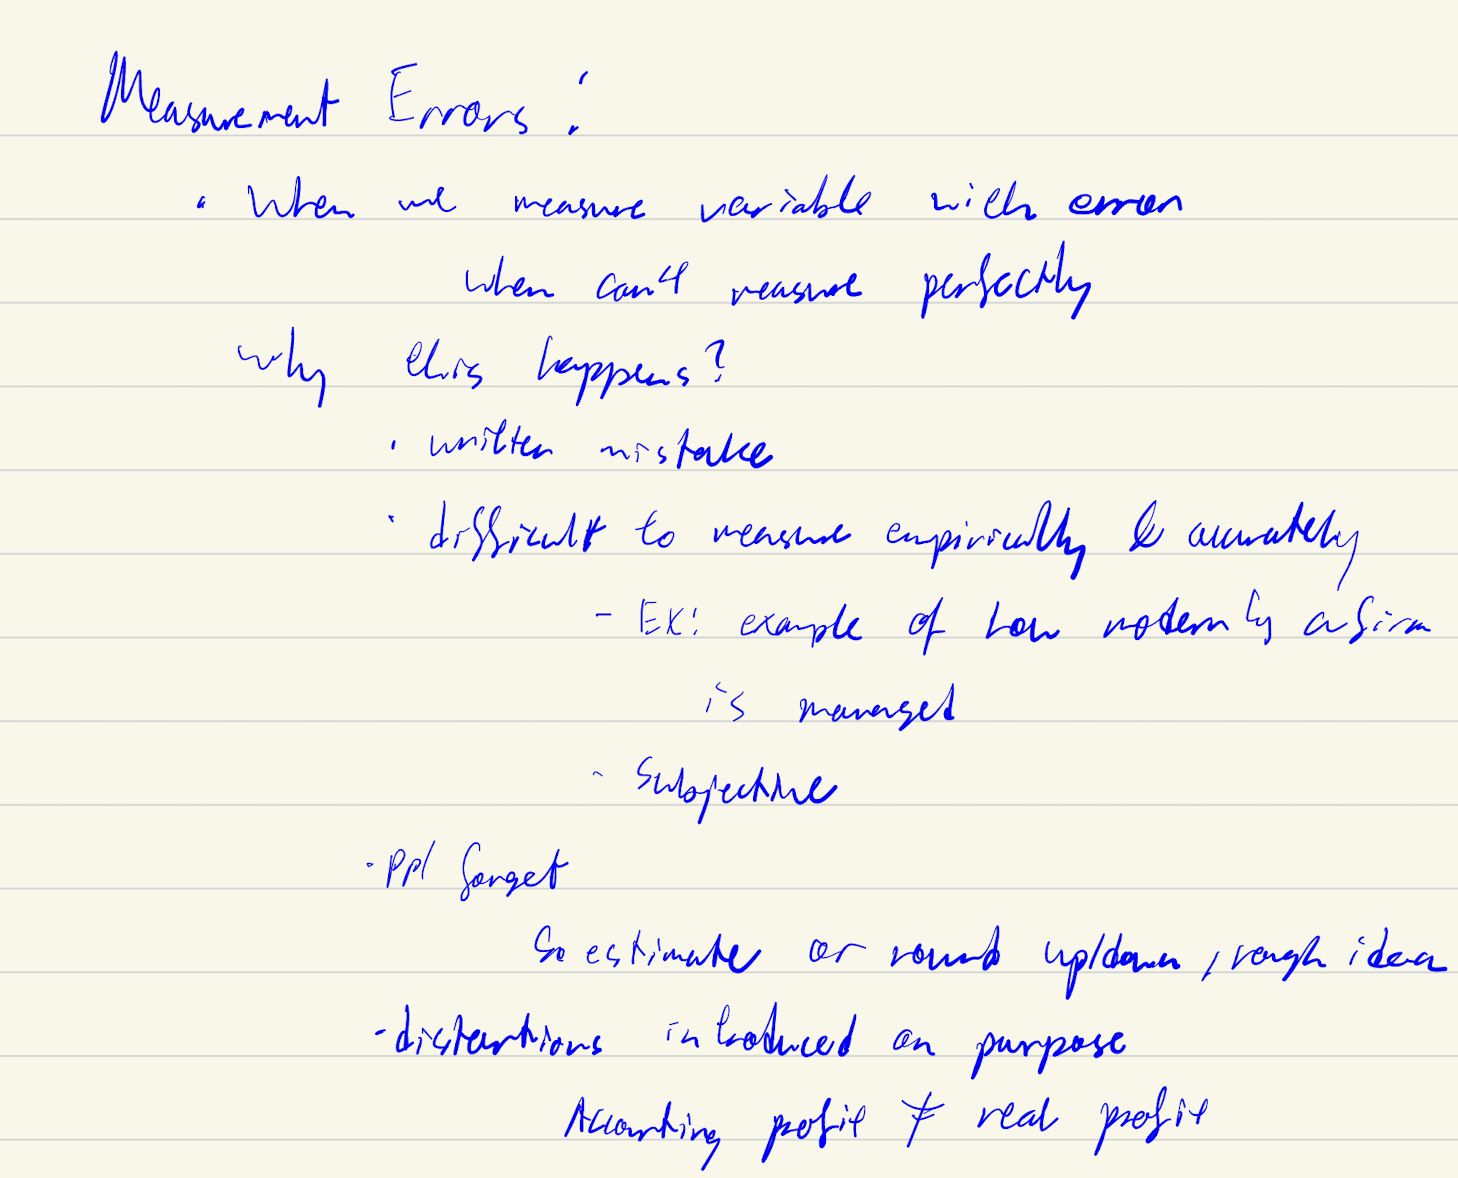
ME in dependent variable
if ME uncorrrelated with idp variables → it will be like its part of the error term. Error term + ME = v
Also the SE errror we get is an upper bound of the SE we get without the ME, so t-statistics becomes lower bound → so if still manage to reject despite deflated t-statistic we can be even more confident effect is real
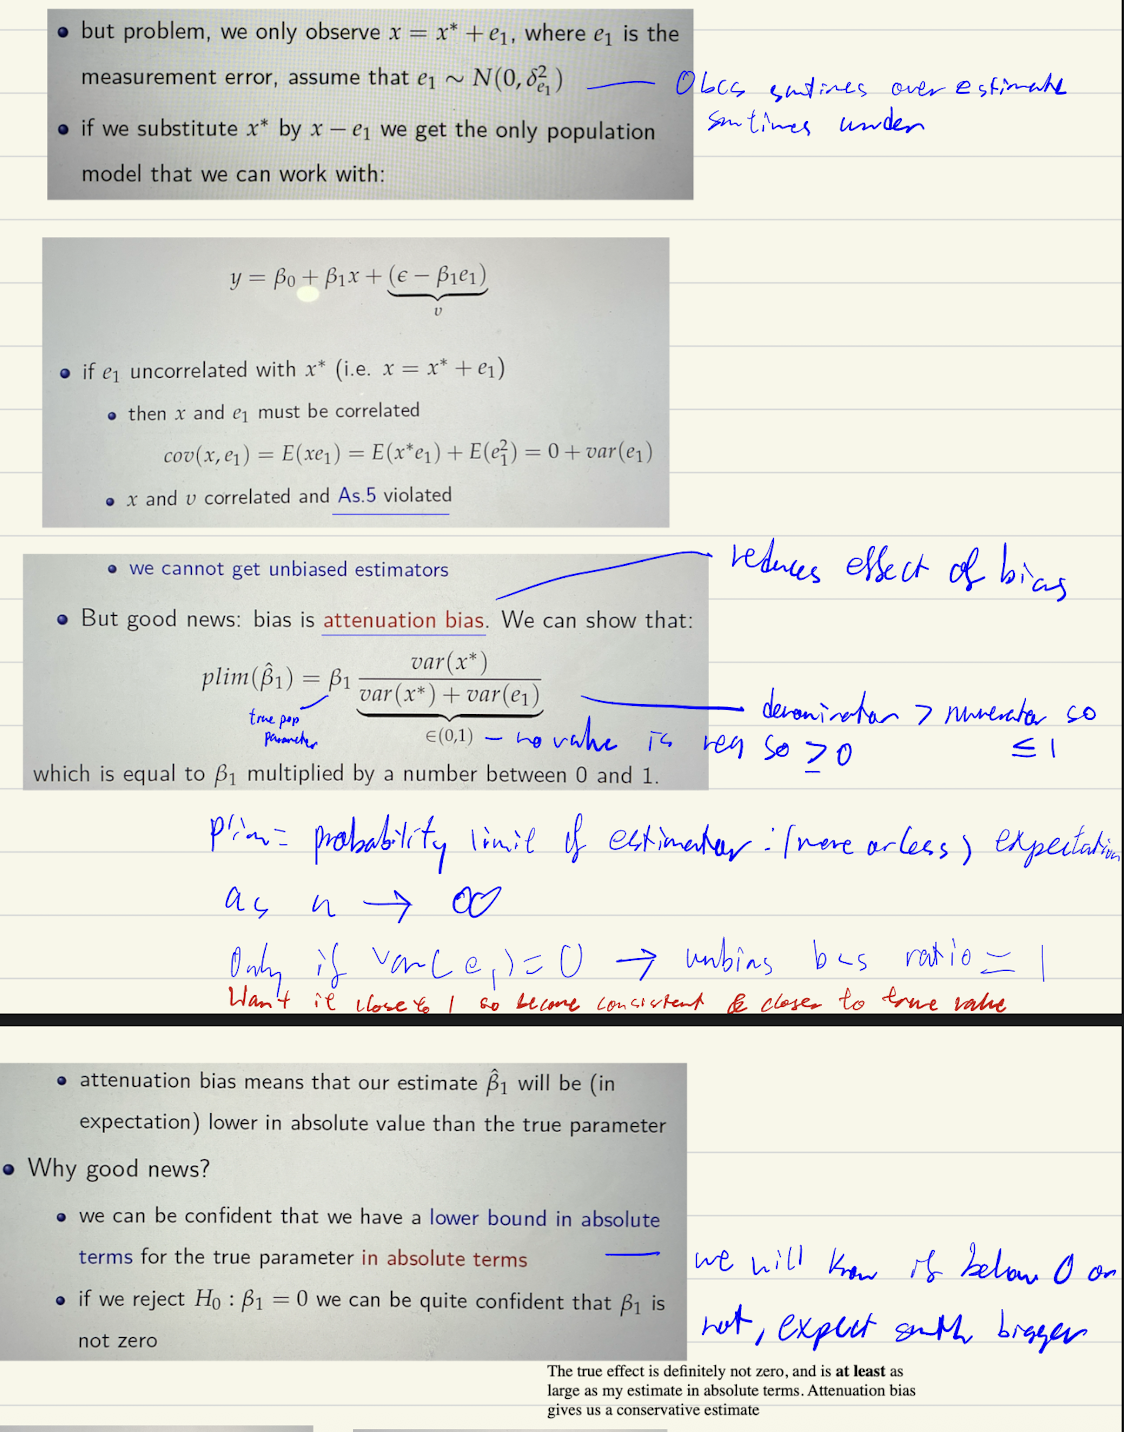
ME in independent variable
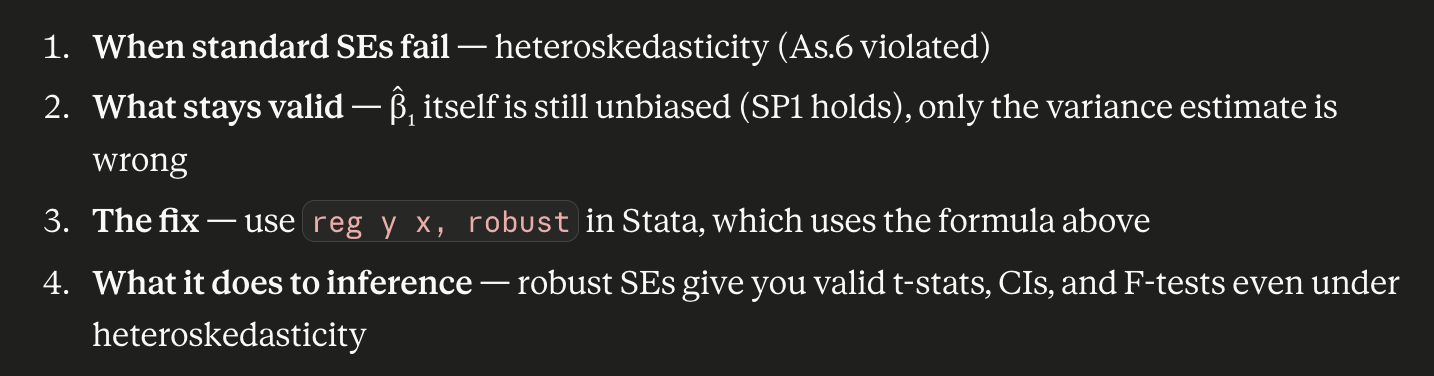
Why robust estimator of var (b1) is needed
Under homoskedasticity:
reg y xandreg y x, robustgive similar SEsUnder heteroskedasticity: regular SEs are wrong (they assume one σ²), but robust SEs are still valid (they let each observation have its own variance)
conditional on us having large observationsget robust SE by rooting the robust variance
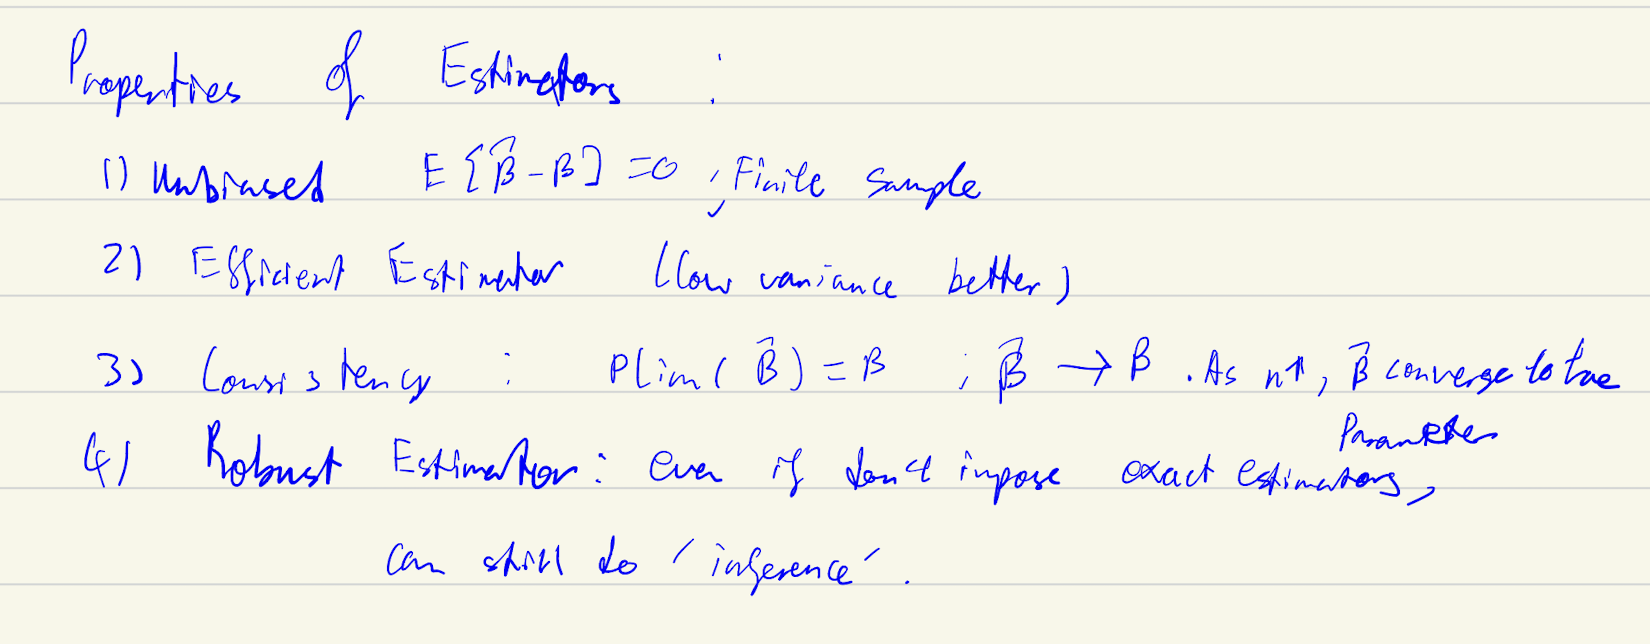
Properties of good estimators
Limitations of OLS
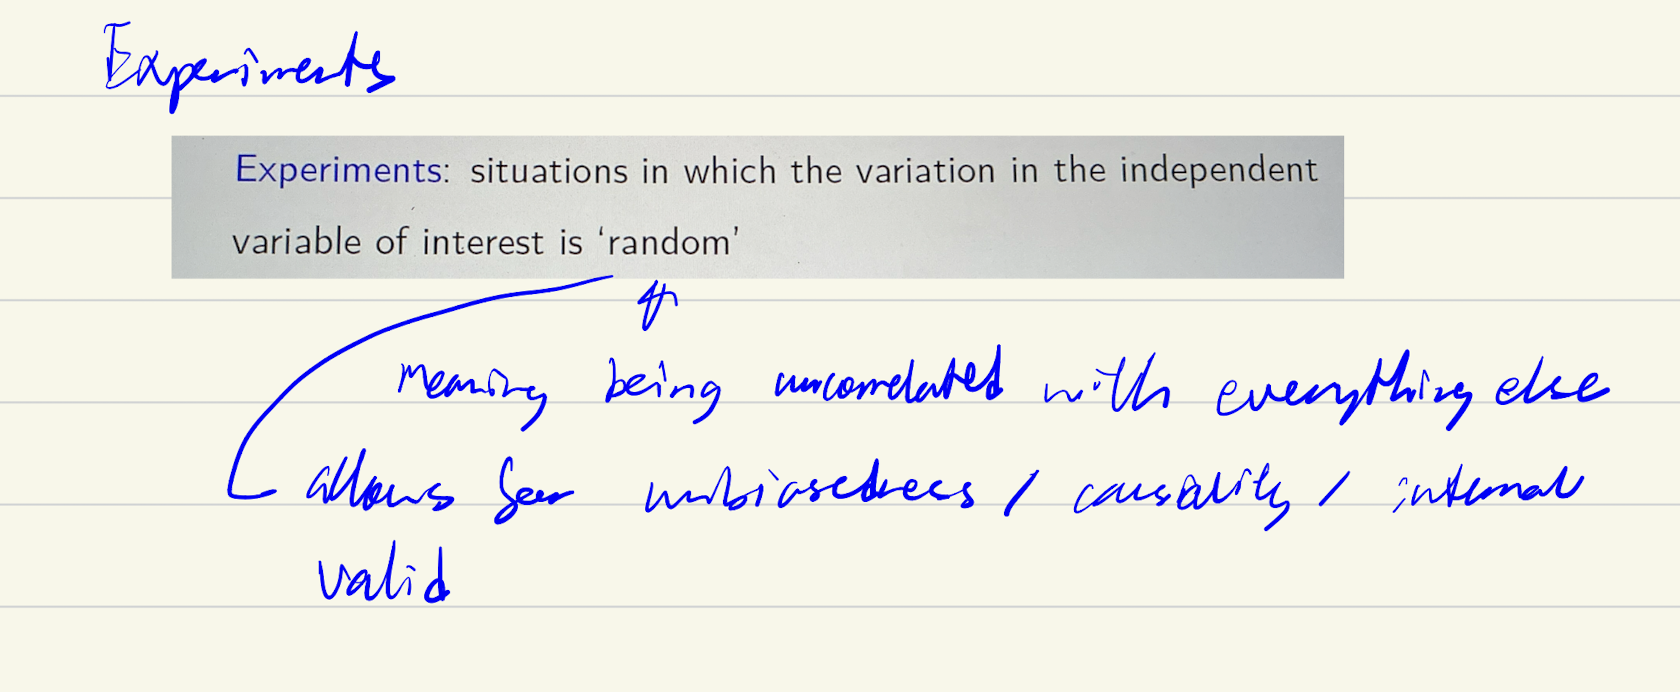
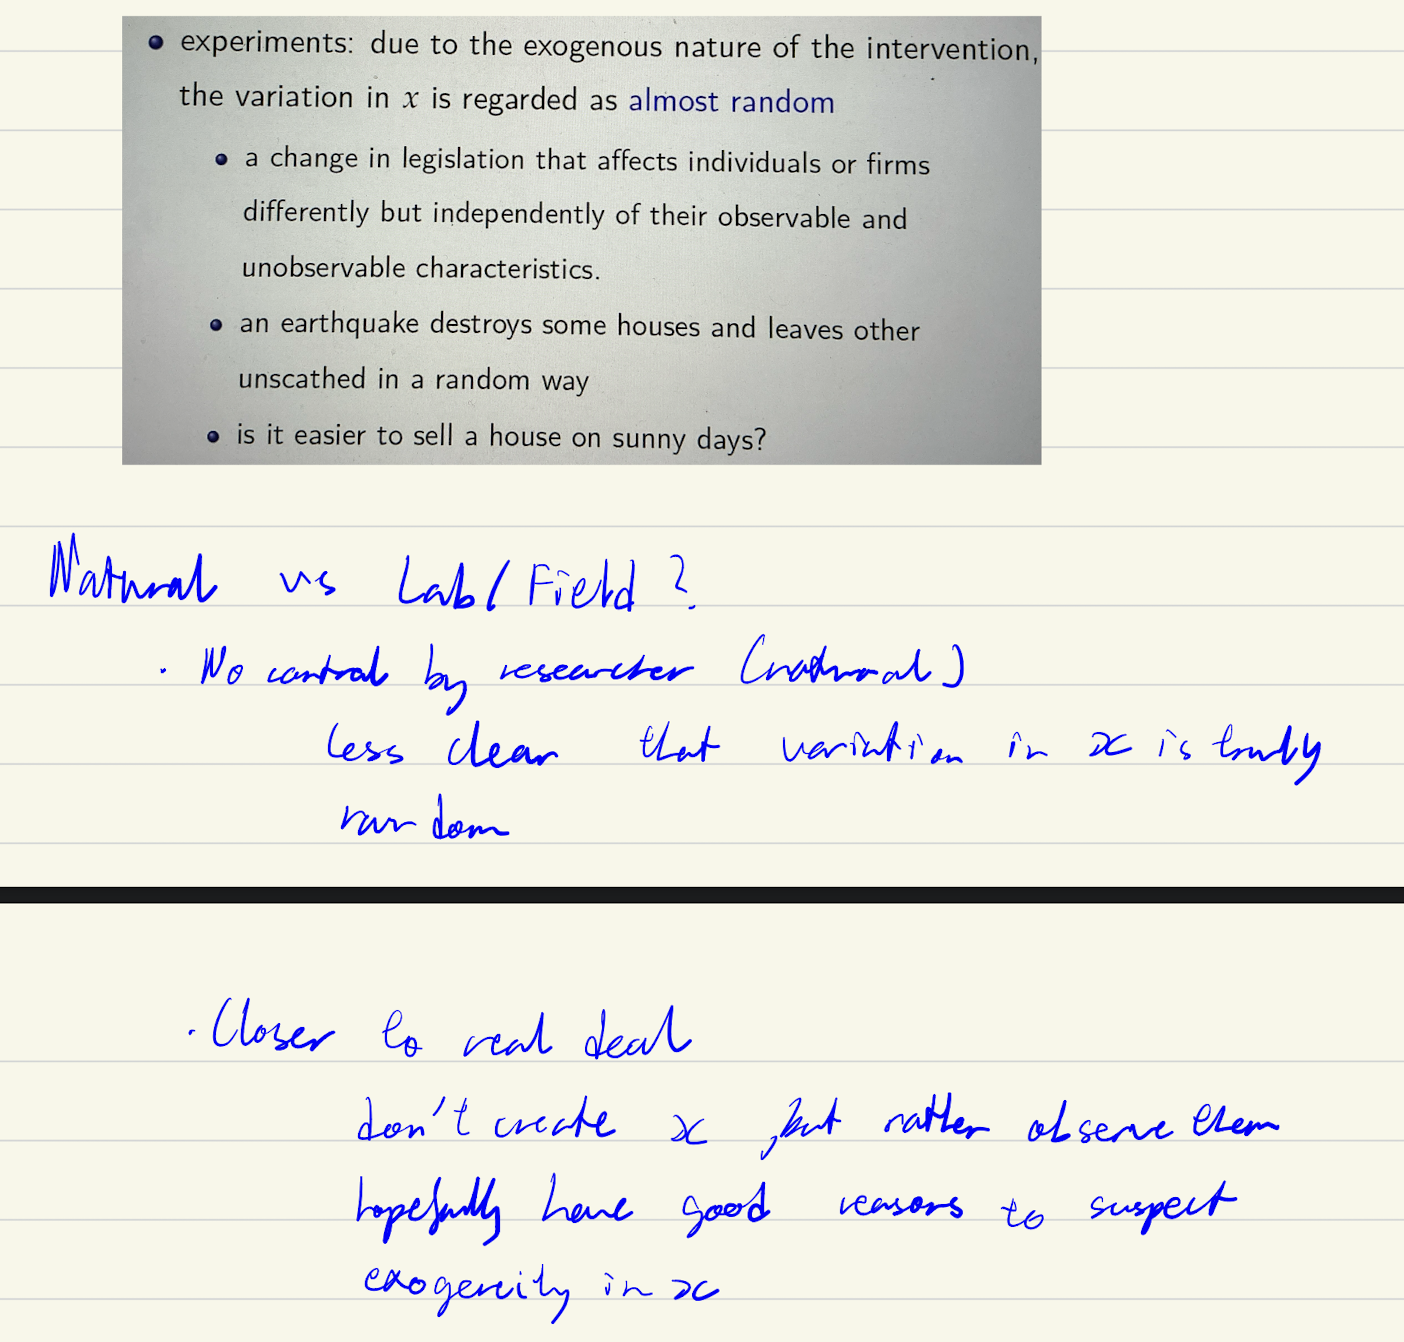
Experiments/experimental data, types
Lab: Artificially allocate chosen level of x, bring indiv to controlled environment
natural: when x is created naturally by some external event
Field: go to real world, interact w indiv in their real environment, also artificially assign chosen level of x
Implications of experiements
Labs could be usefult to:
- Generate hypothesis for field experiments
- when don’t hv any other evidence
- to identify general patterns
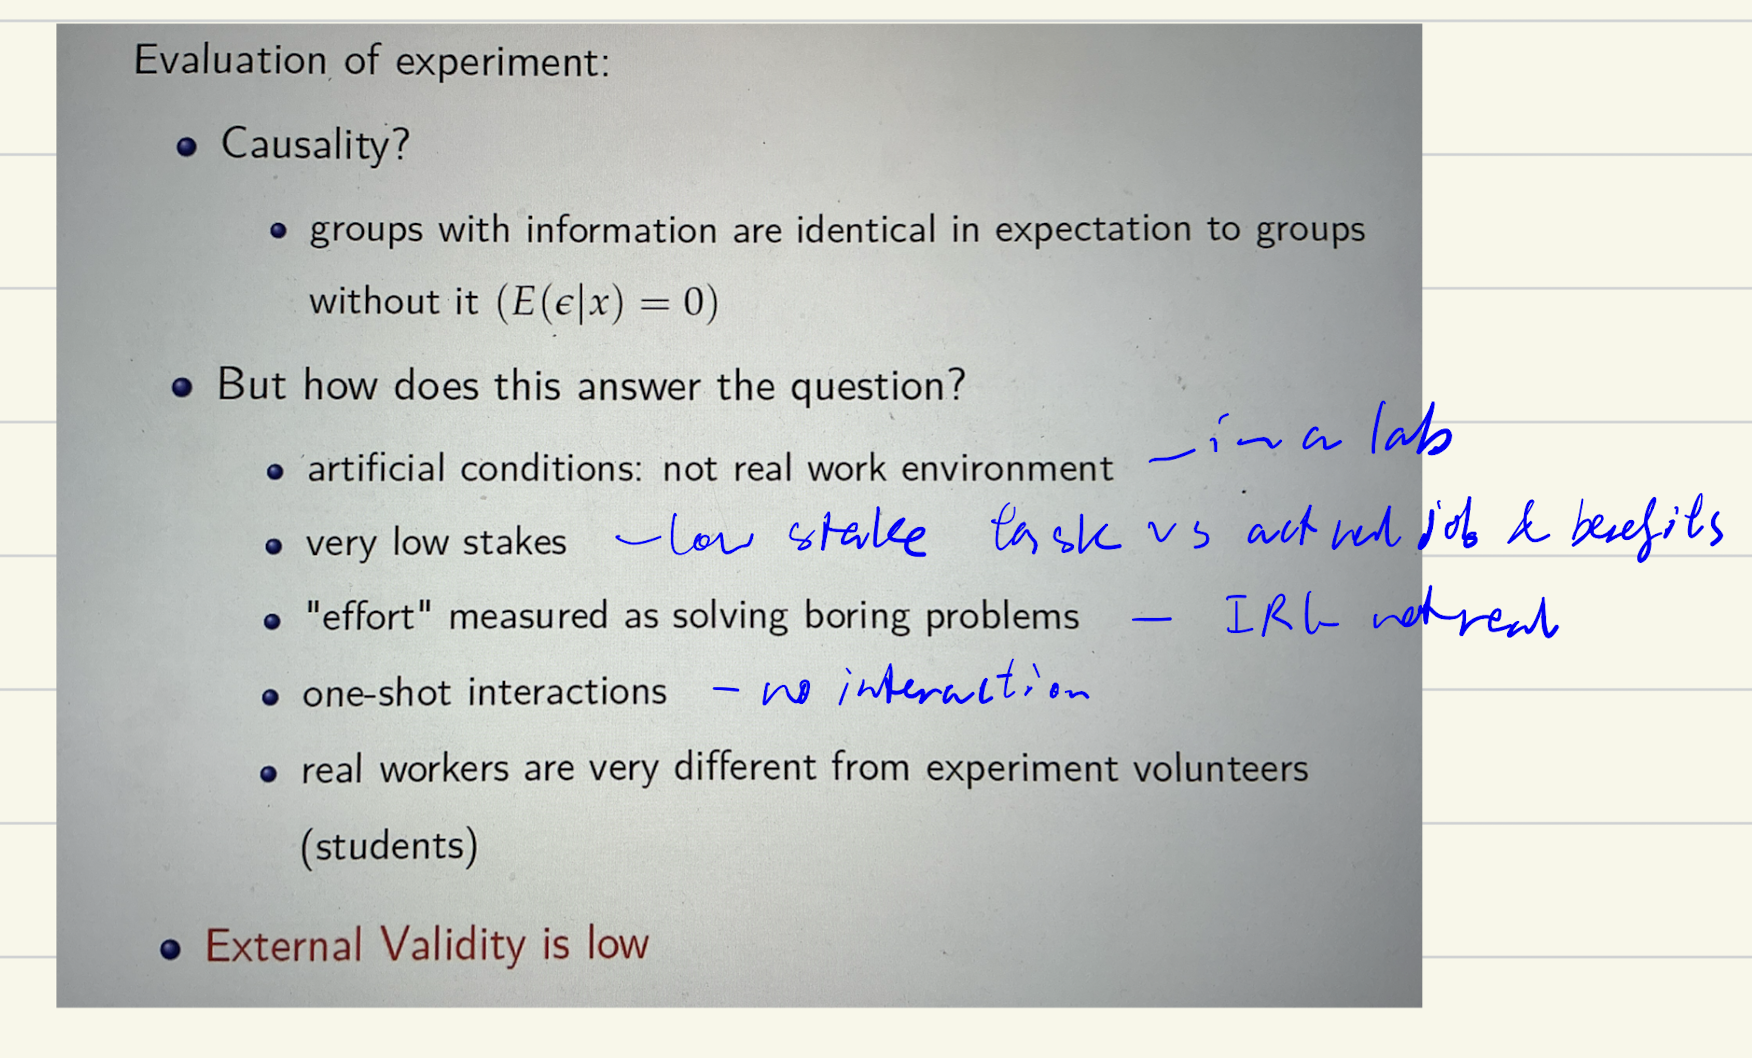
External vs internal validity trade off
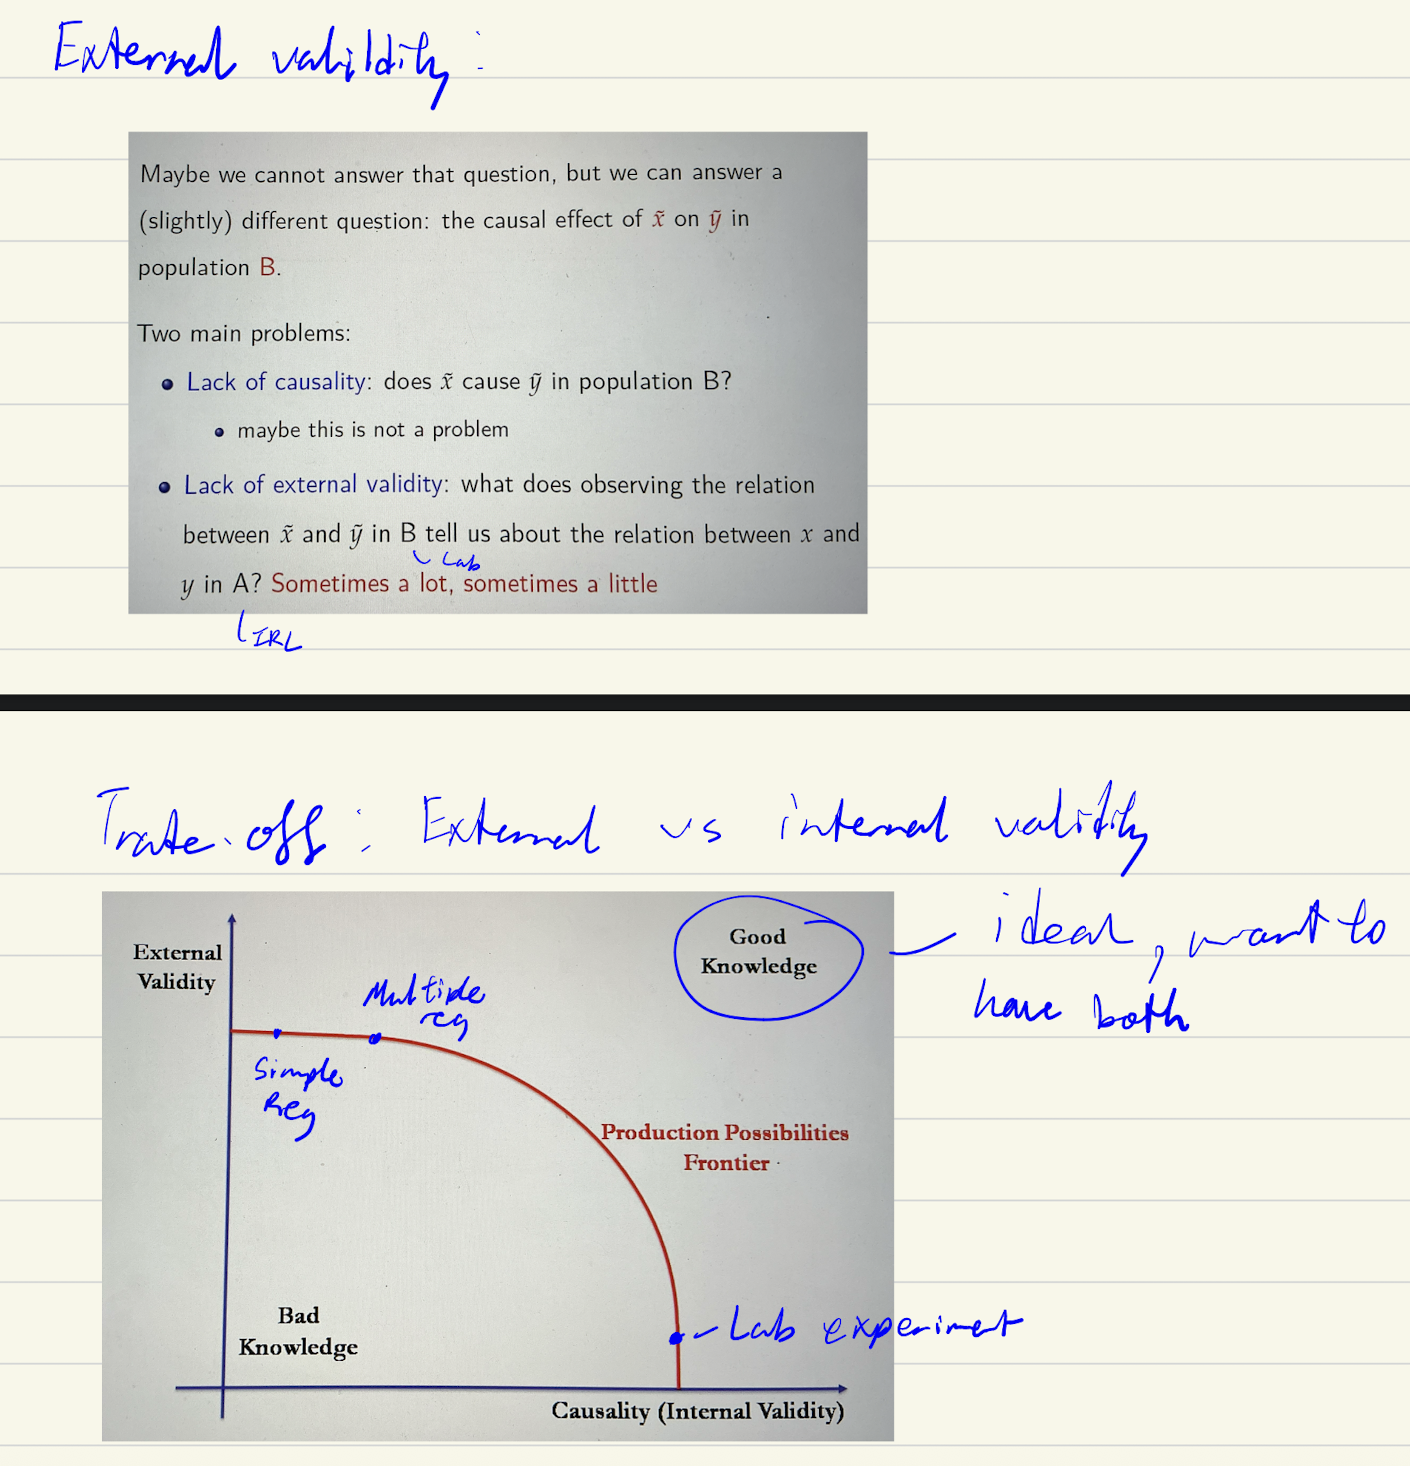
Field vs labs

Natural vs field/labs
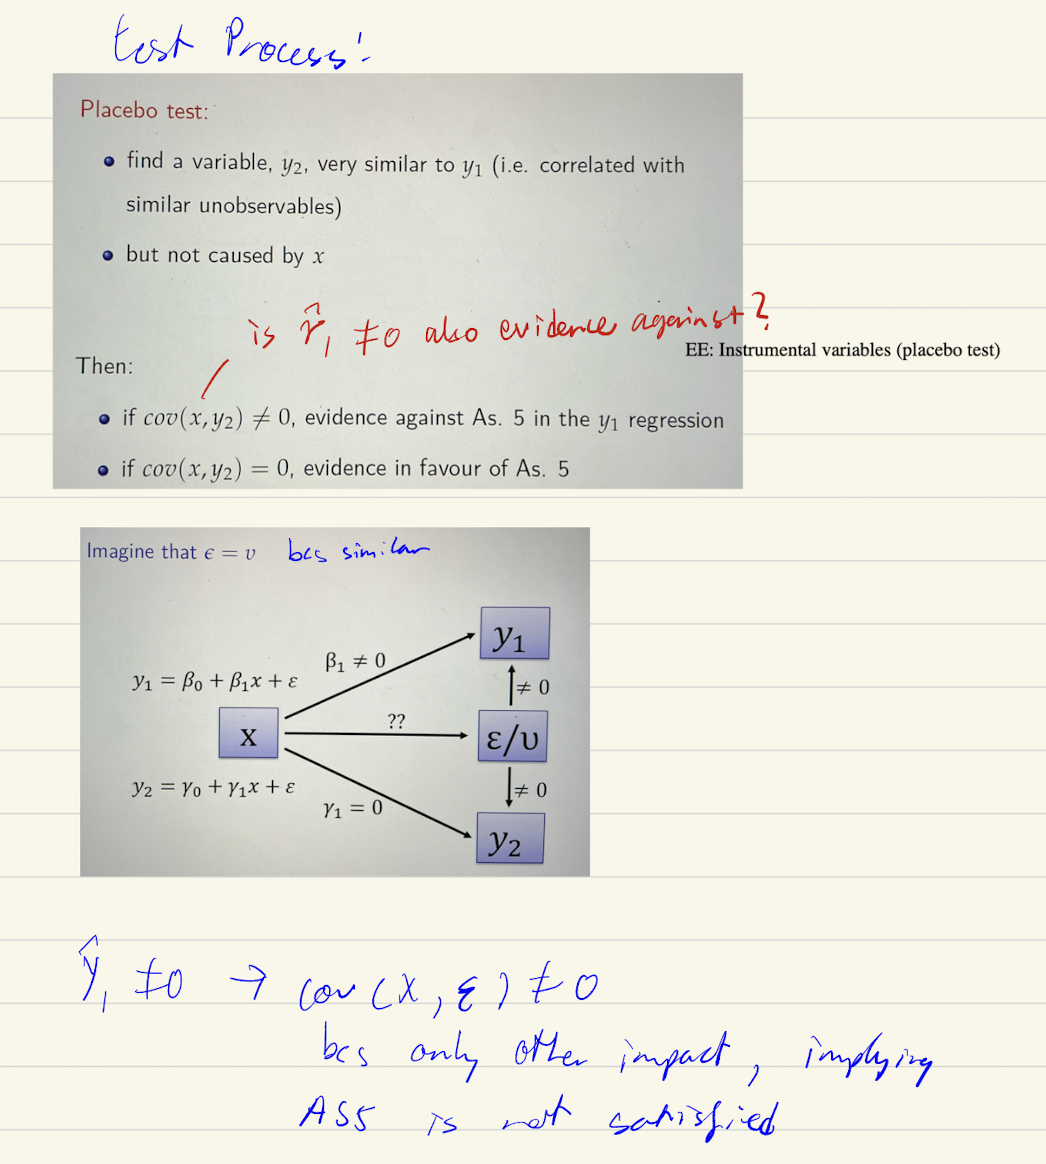
How to test if AS5 valid in natural experiment
1st evidence: Potential correlation with controls -If x₁ is correlated with stuff we can see (other observable variables x₂, x₃, etc.), then it's plausible x₁ is also correlated with stuff we can't see (the error term). since we can’t find the cov(x, error term) as we can’t observe the error term. suggestive evidence
2nd evidence: Placebo Test
Though AS5 can never be properly tested, if we do a natural experiment it. better be the case that: it is uncorrelated with controls and uncorrelated with placebo dependent variables
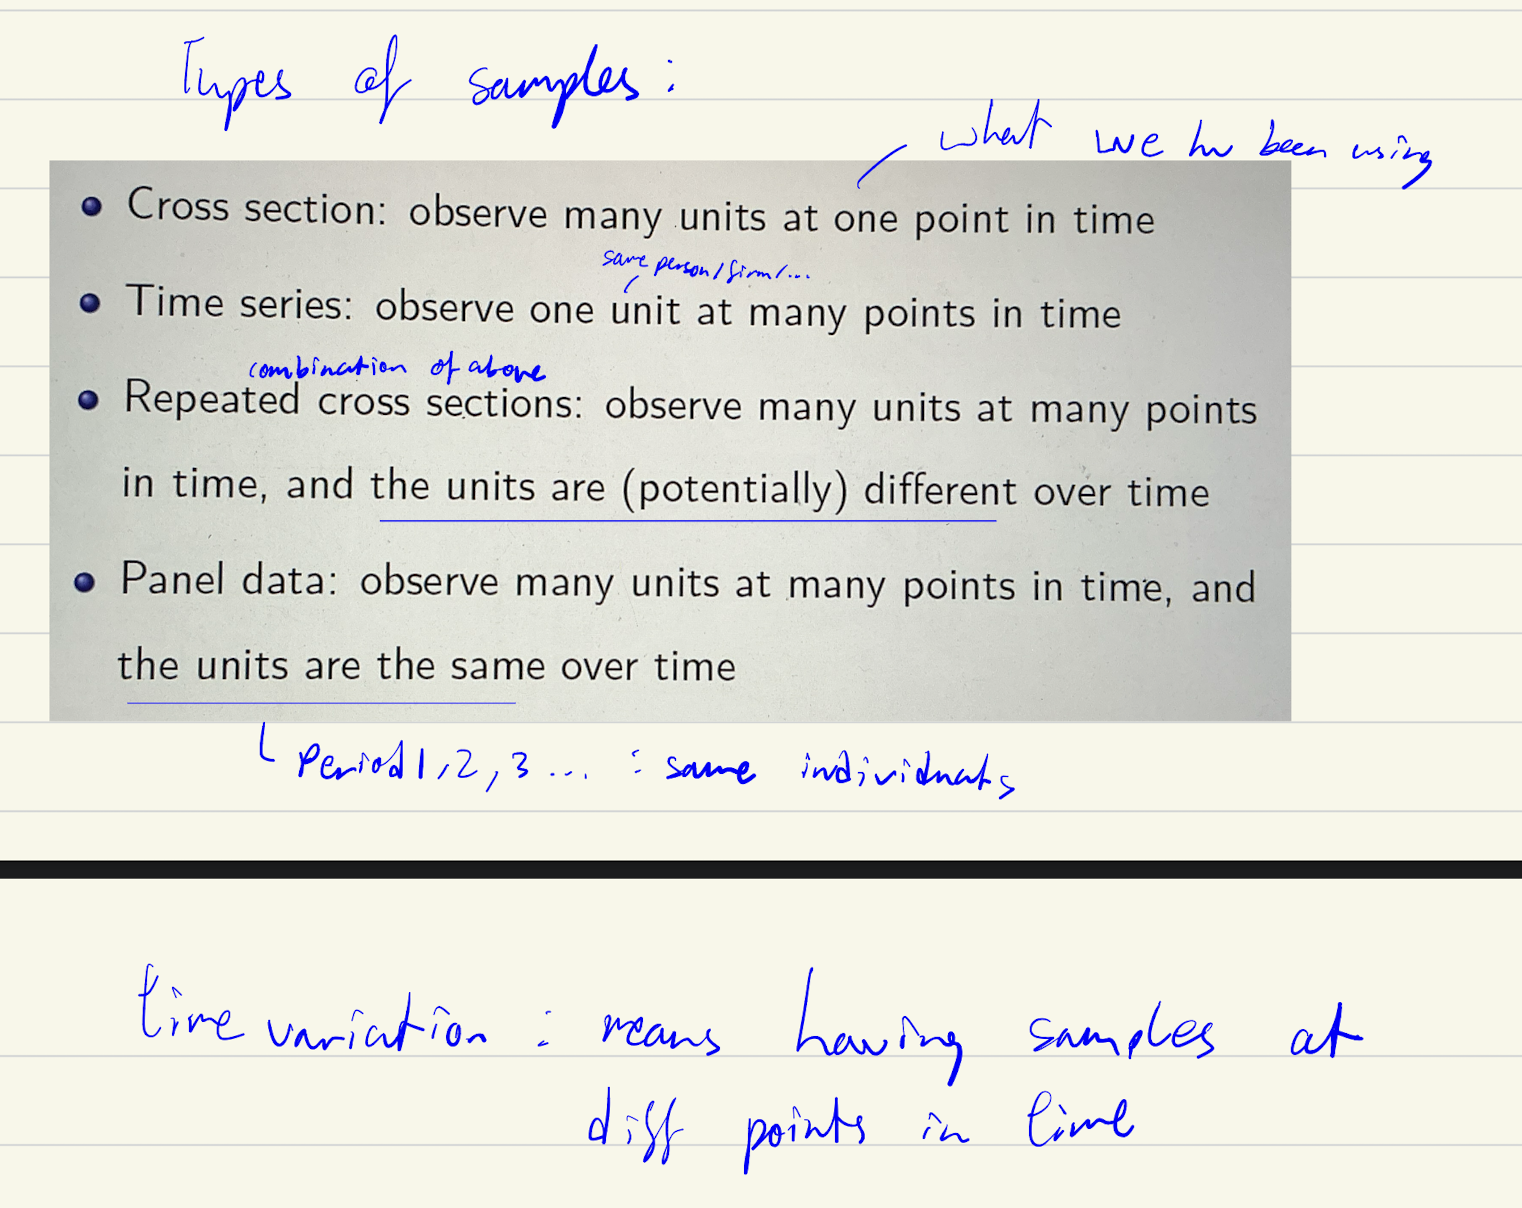
4 types of samples
Running a F test vs time series regression
.
Assumption of first difference estimator
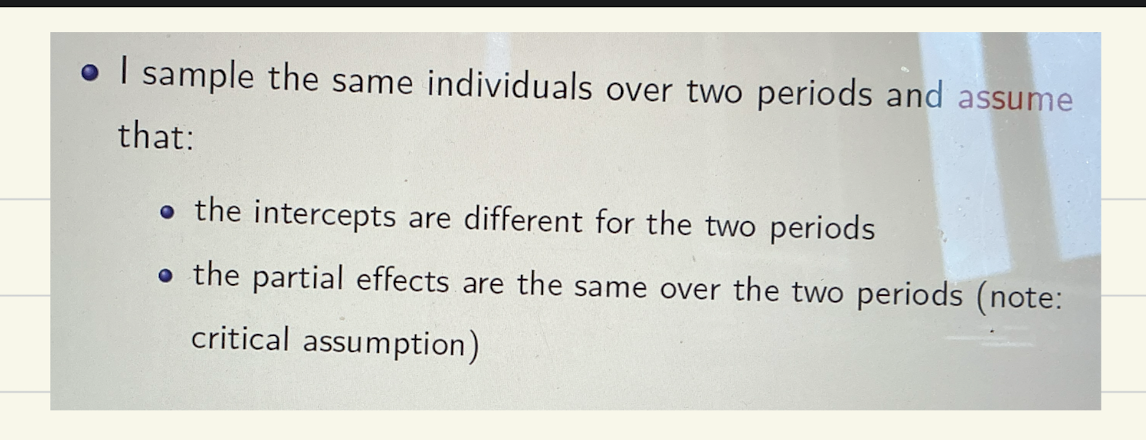
Fixed effect estimator (setup/problem)
.
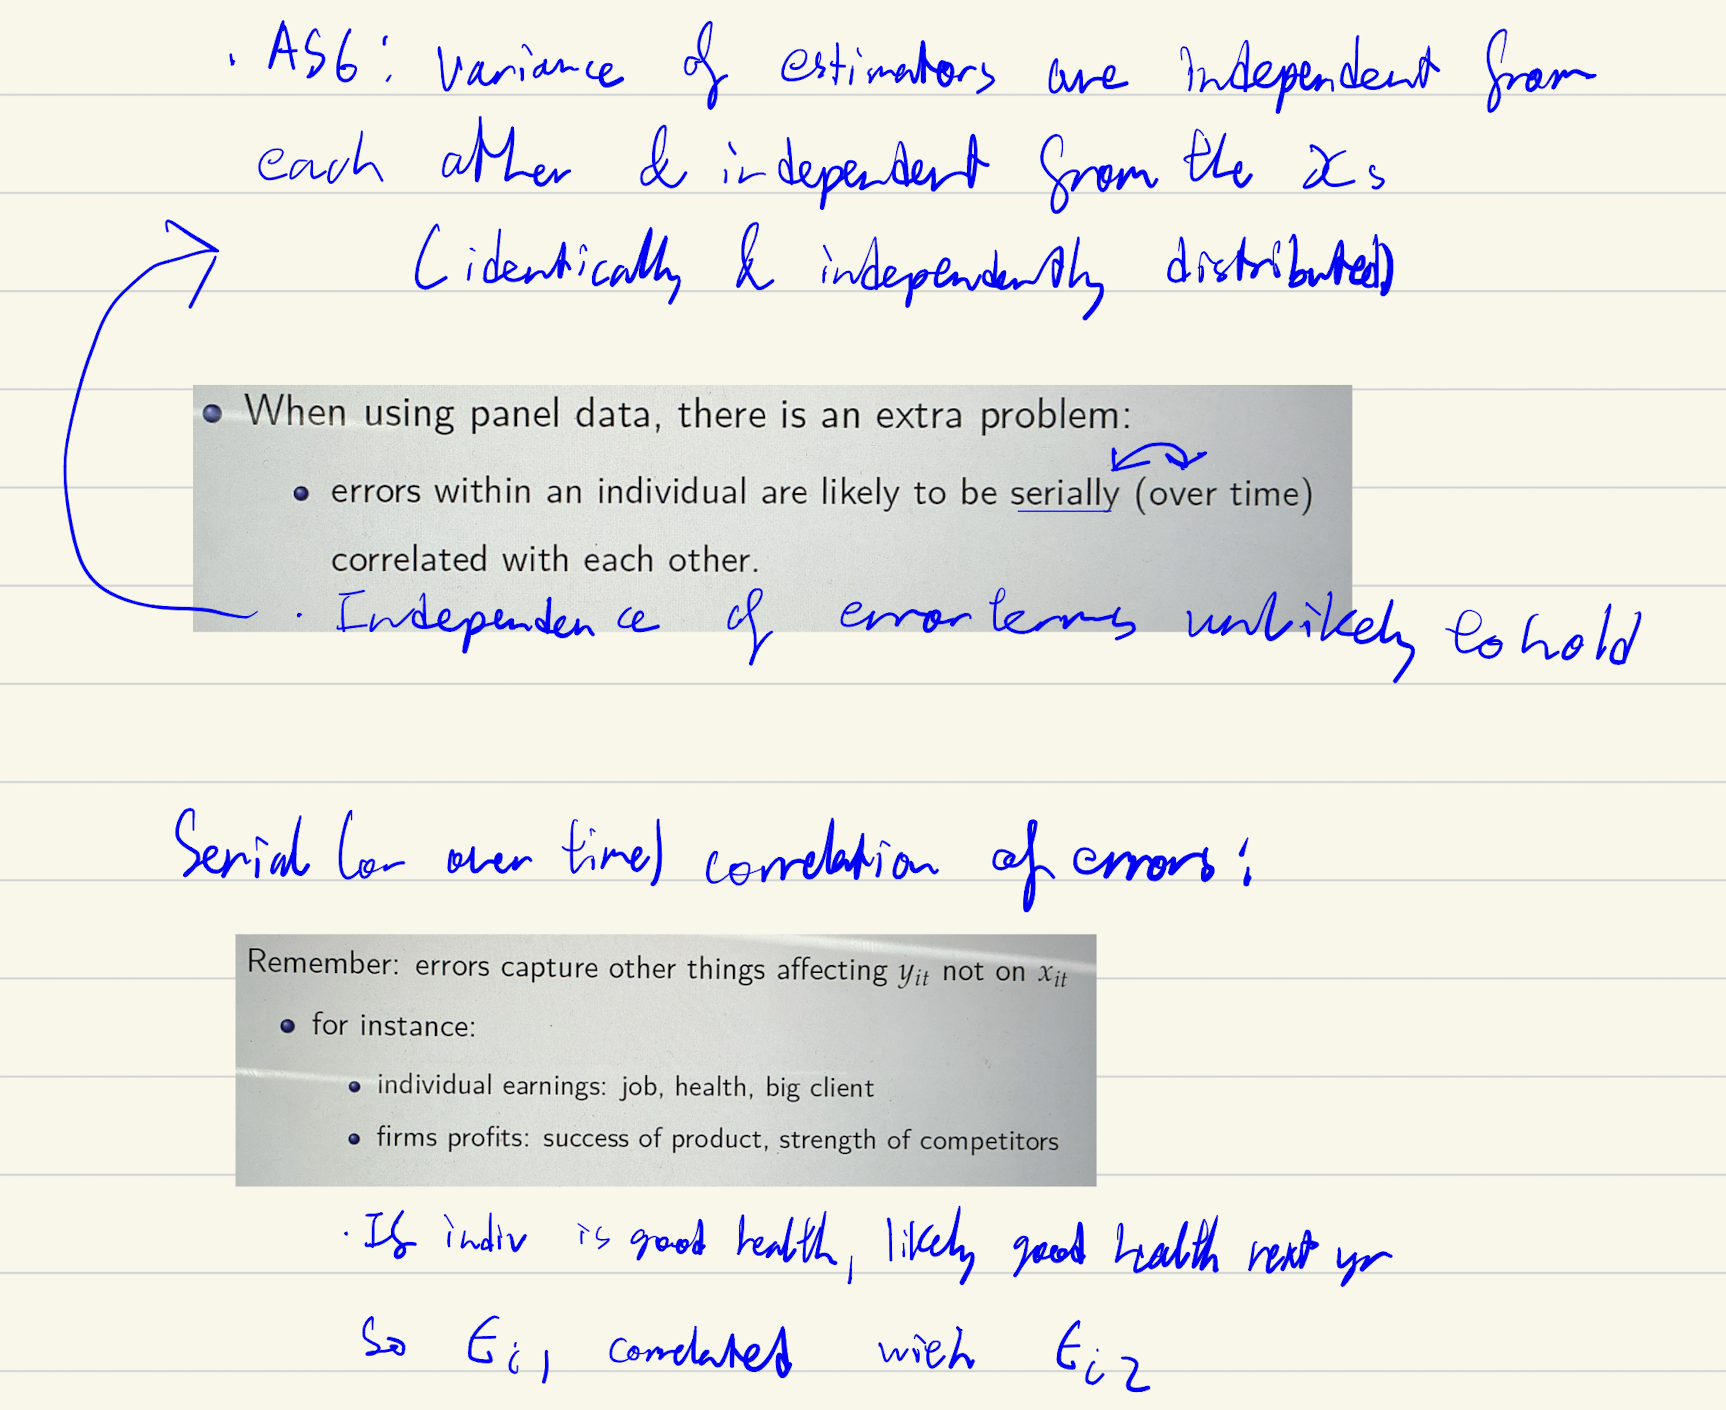
Problem of panel data
This is why need to cluster SE, it takes into account the serial correlation
Absorb stata
absorbs the differences in individuals for fixed effects estimator
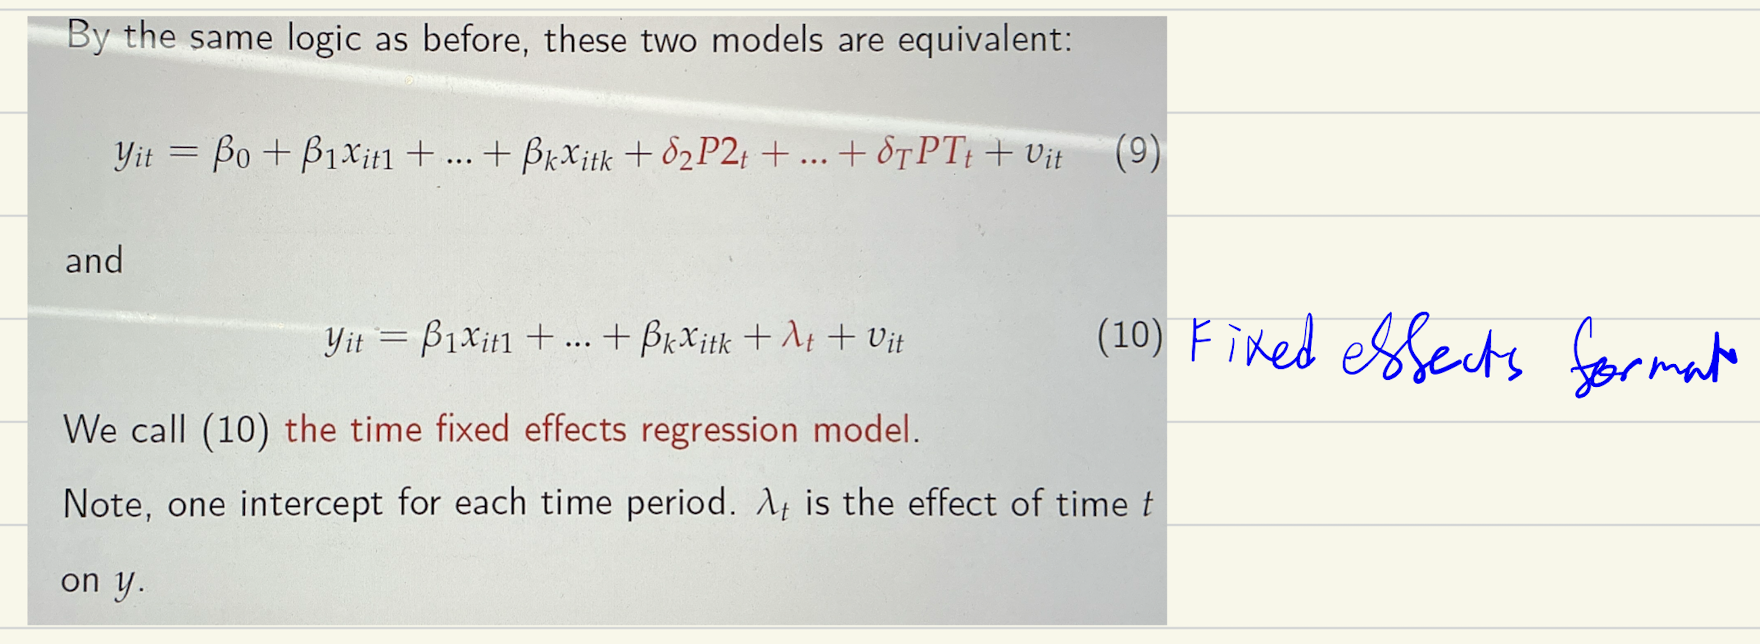
Time fixed effects regression model
i. varname stata
Yes — i.varname is Stata shorthand for "create a full set of dummy variables from this categorical variable, automatically dropping one as the base category."
Individual vs time FE, what they do, and how to tell how they impact
Individual FEs absorb time-invariant unobservables (ability, taste, location)
Time FEs absorb period-specific shocks affecting everyone (recessions, regulation, market trends)
Adding either can move coefficients in either direction — to predict the direction, apply OVB logic: sign(omitted variable's effect on y) × sign(its correlation with x of interest)
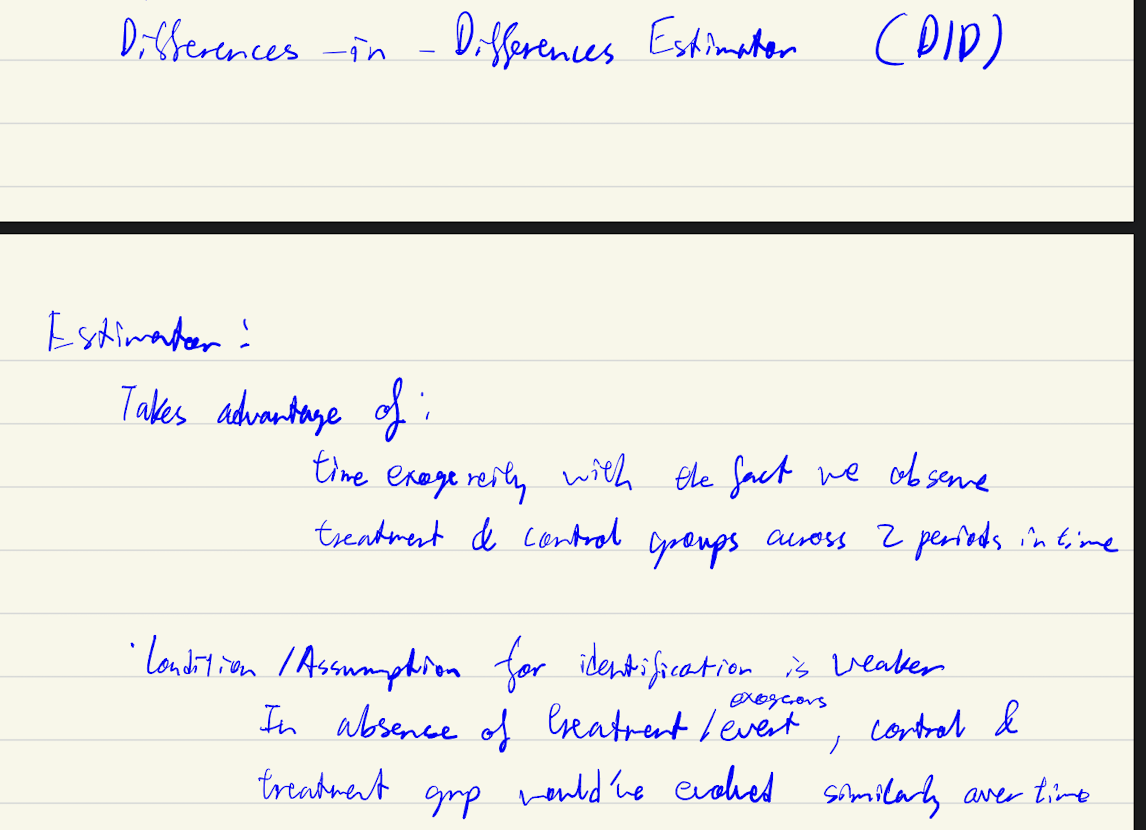
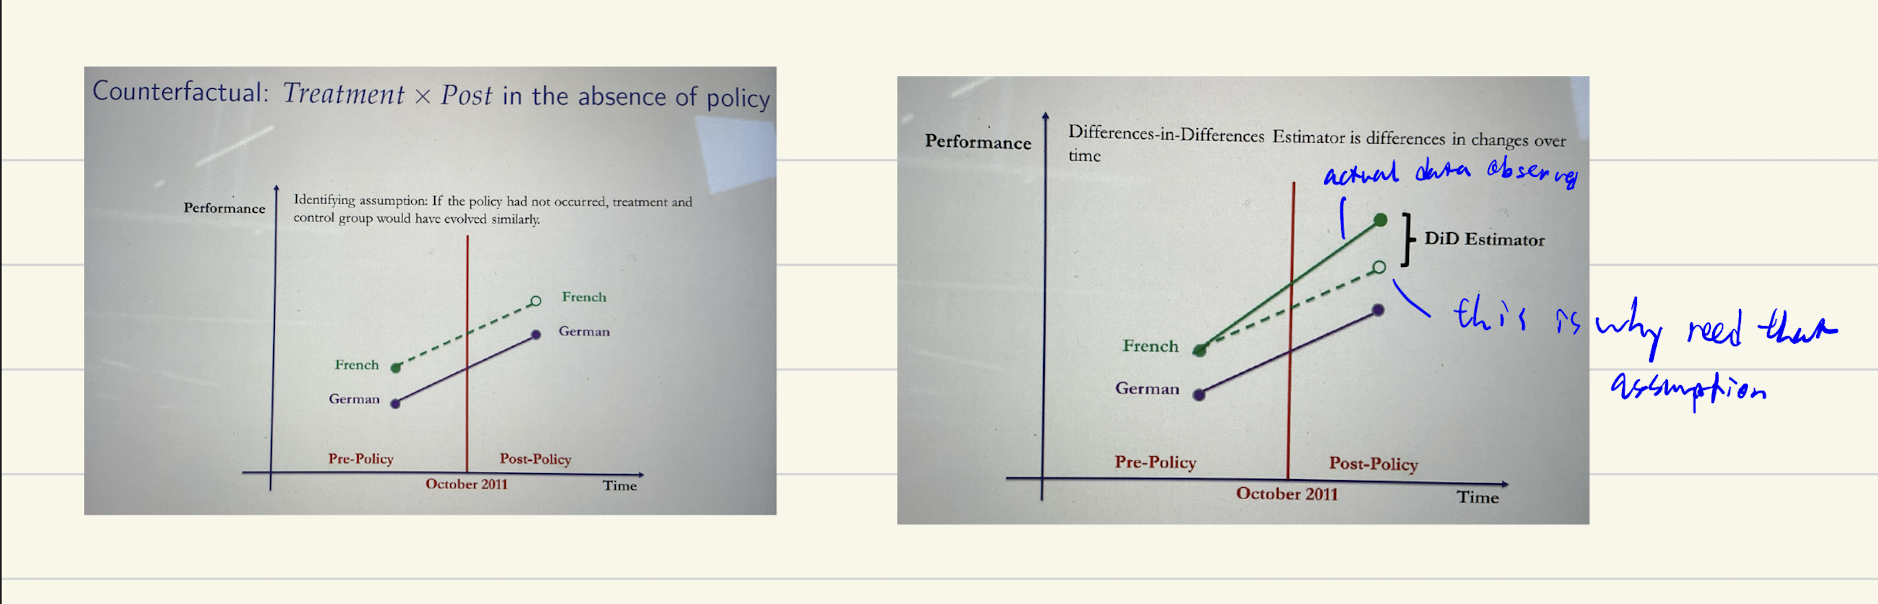
assumptions of DID estimator
DID graph
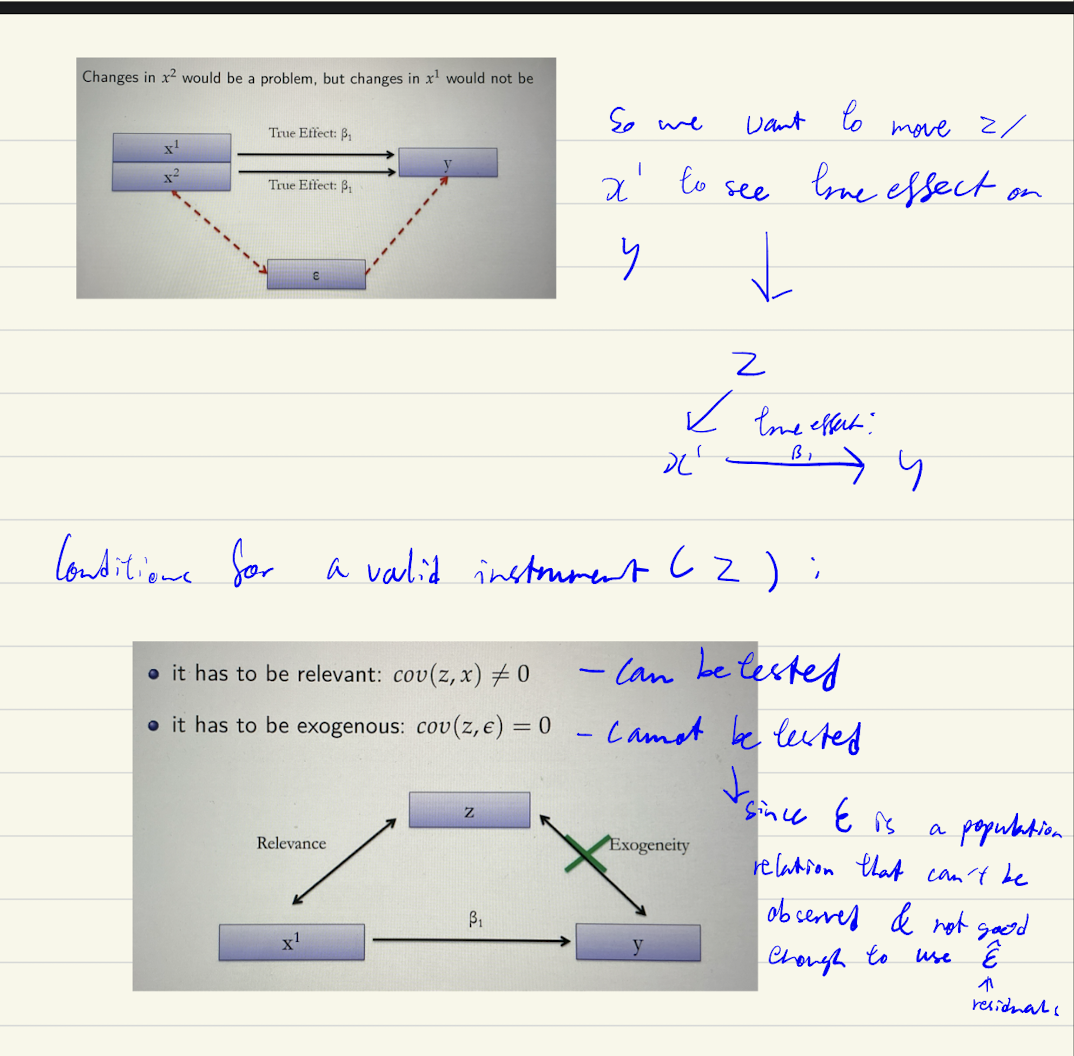
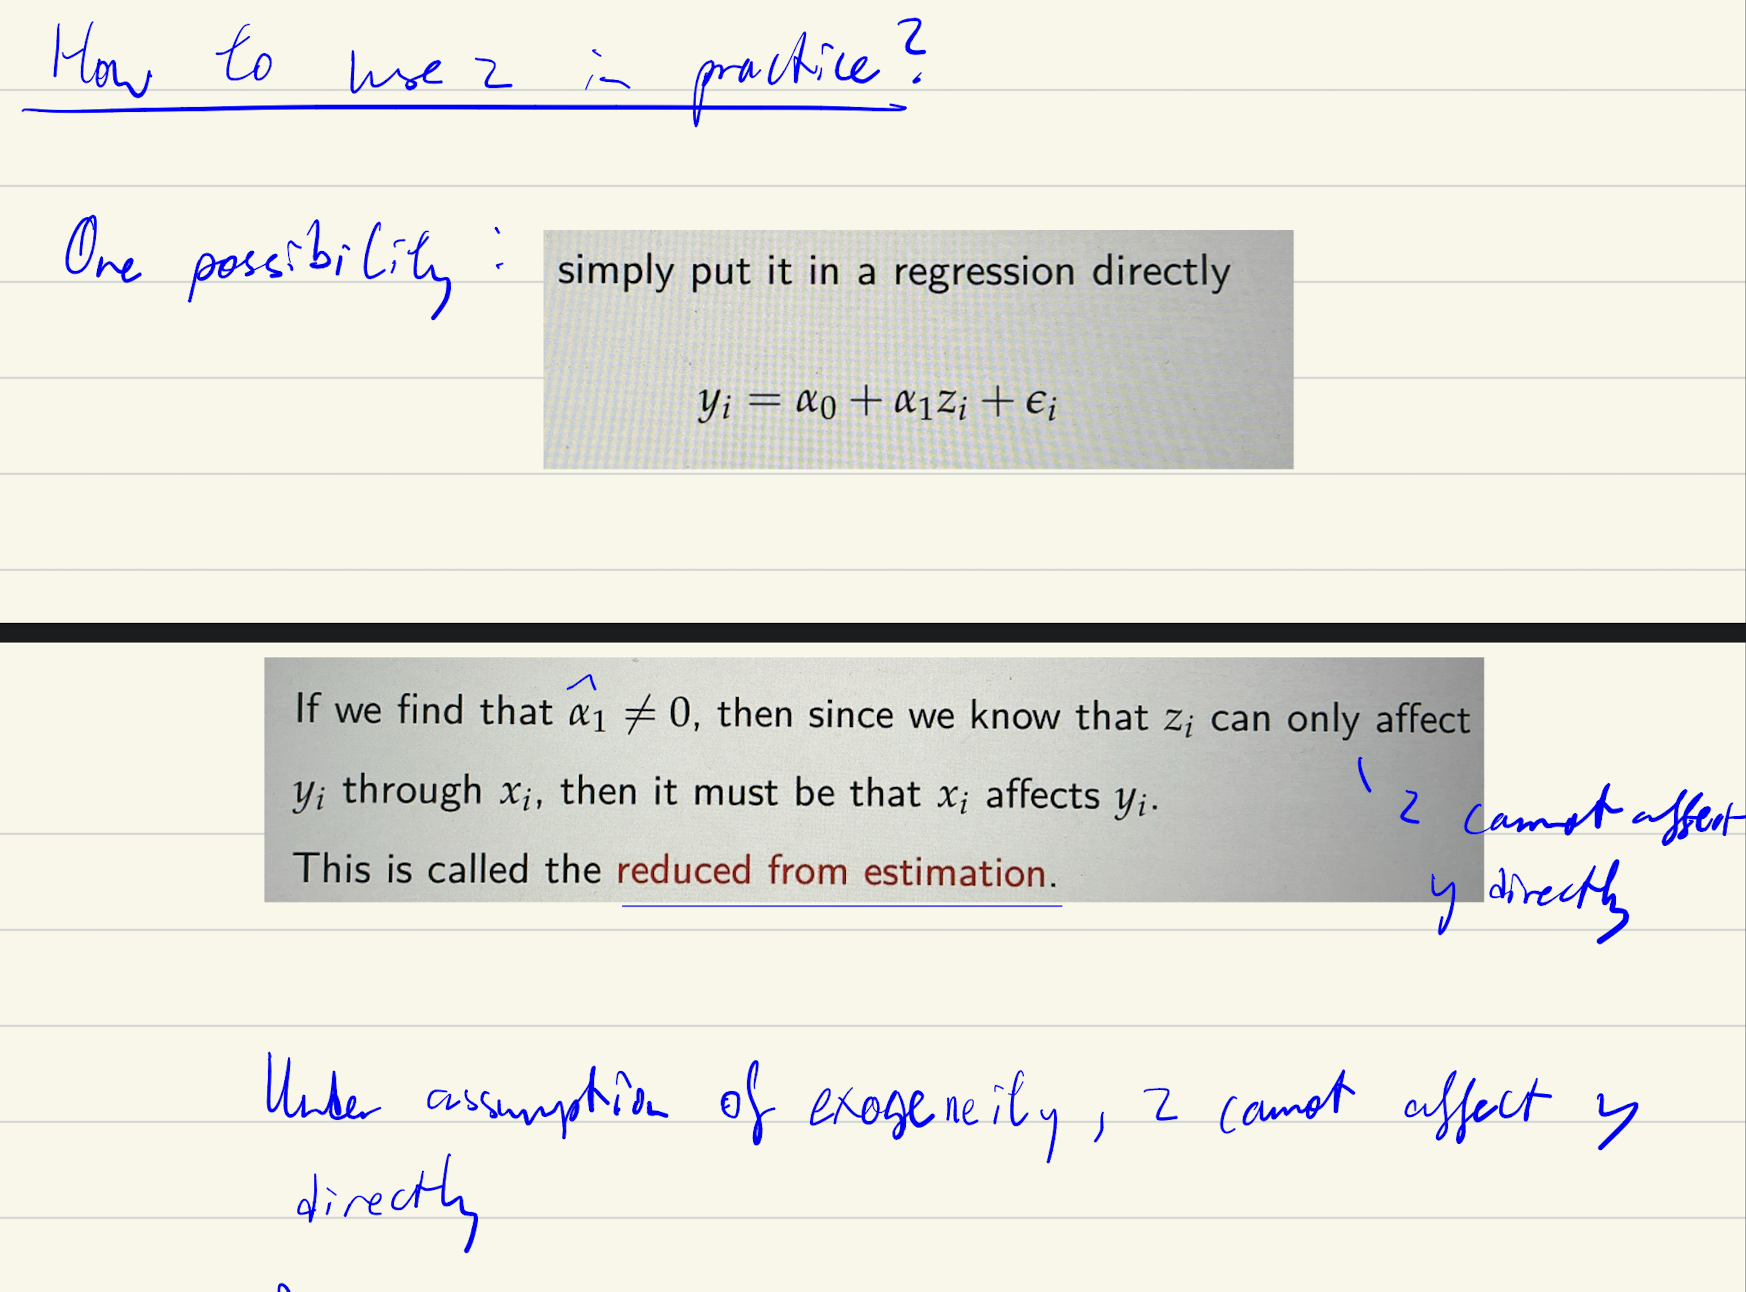
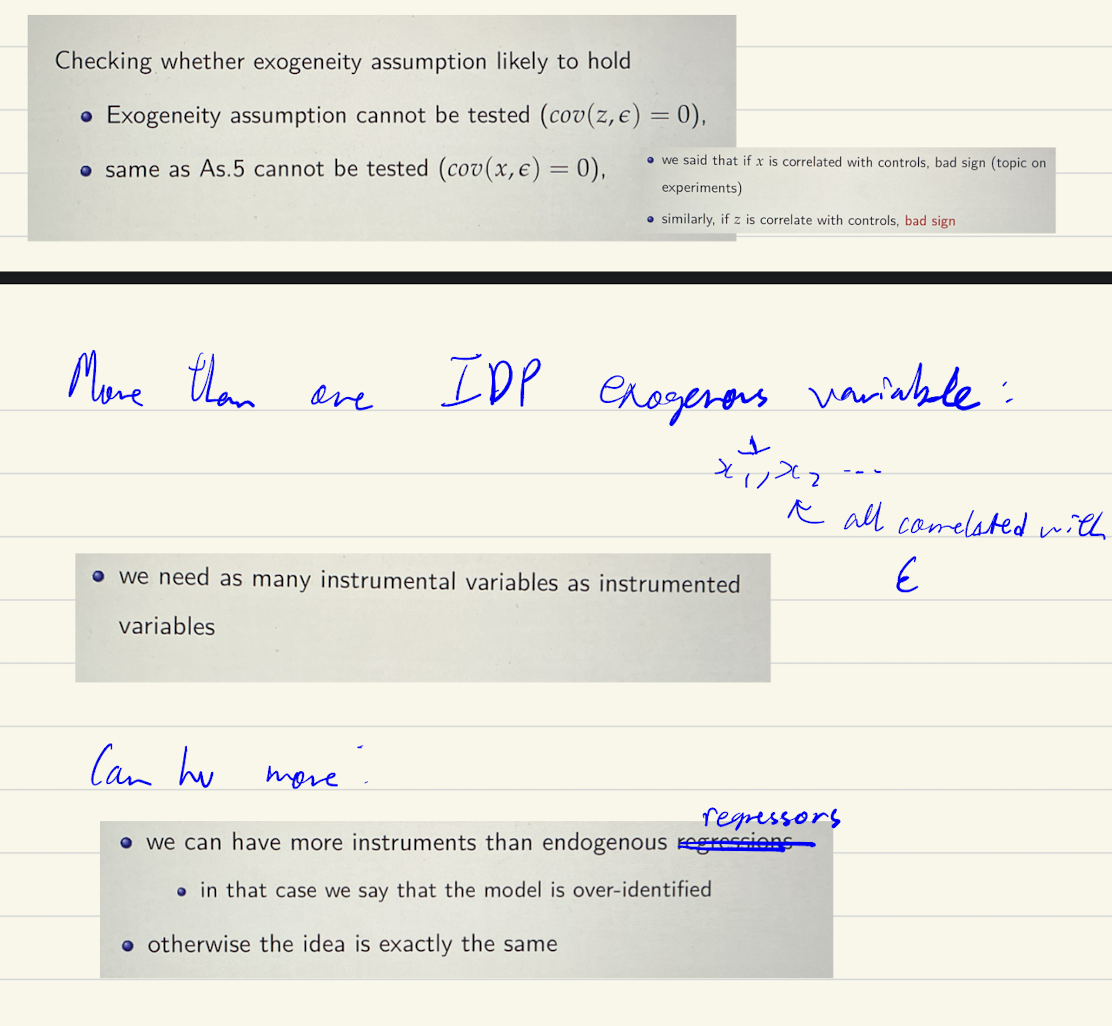
Instrumental variables (conditions for a valid instrument)
Change z → changes x’ → changes y
Can be tested with F test
Reduced form estimation
2 Stage Least Squares
First stage: Run x on z → estimated x is the fitted values (Part of x correlated w z) → Est(Vi) = residuals = Xi - Fitted values (est(Xi)). Shld also include controls when running - but too advance
Second stage: Run y on fitted values → find estimates
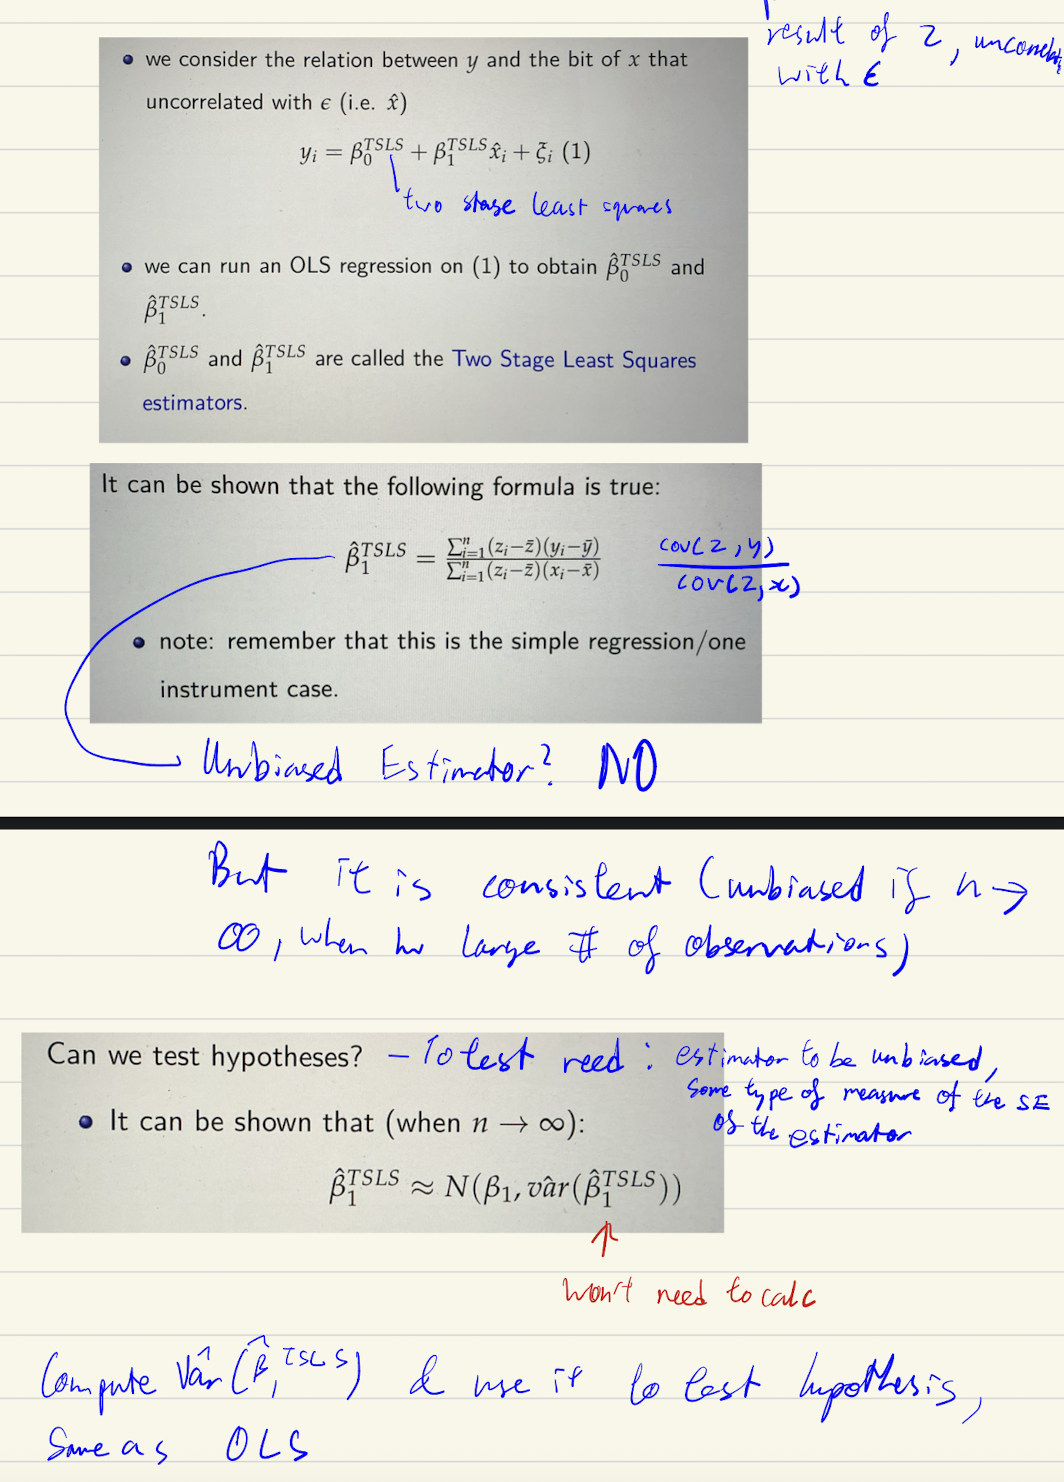
Number of instruments needed
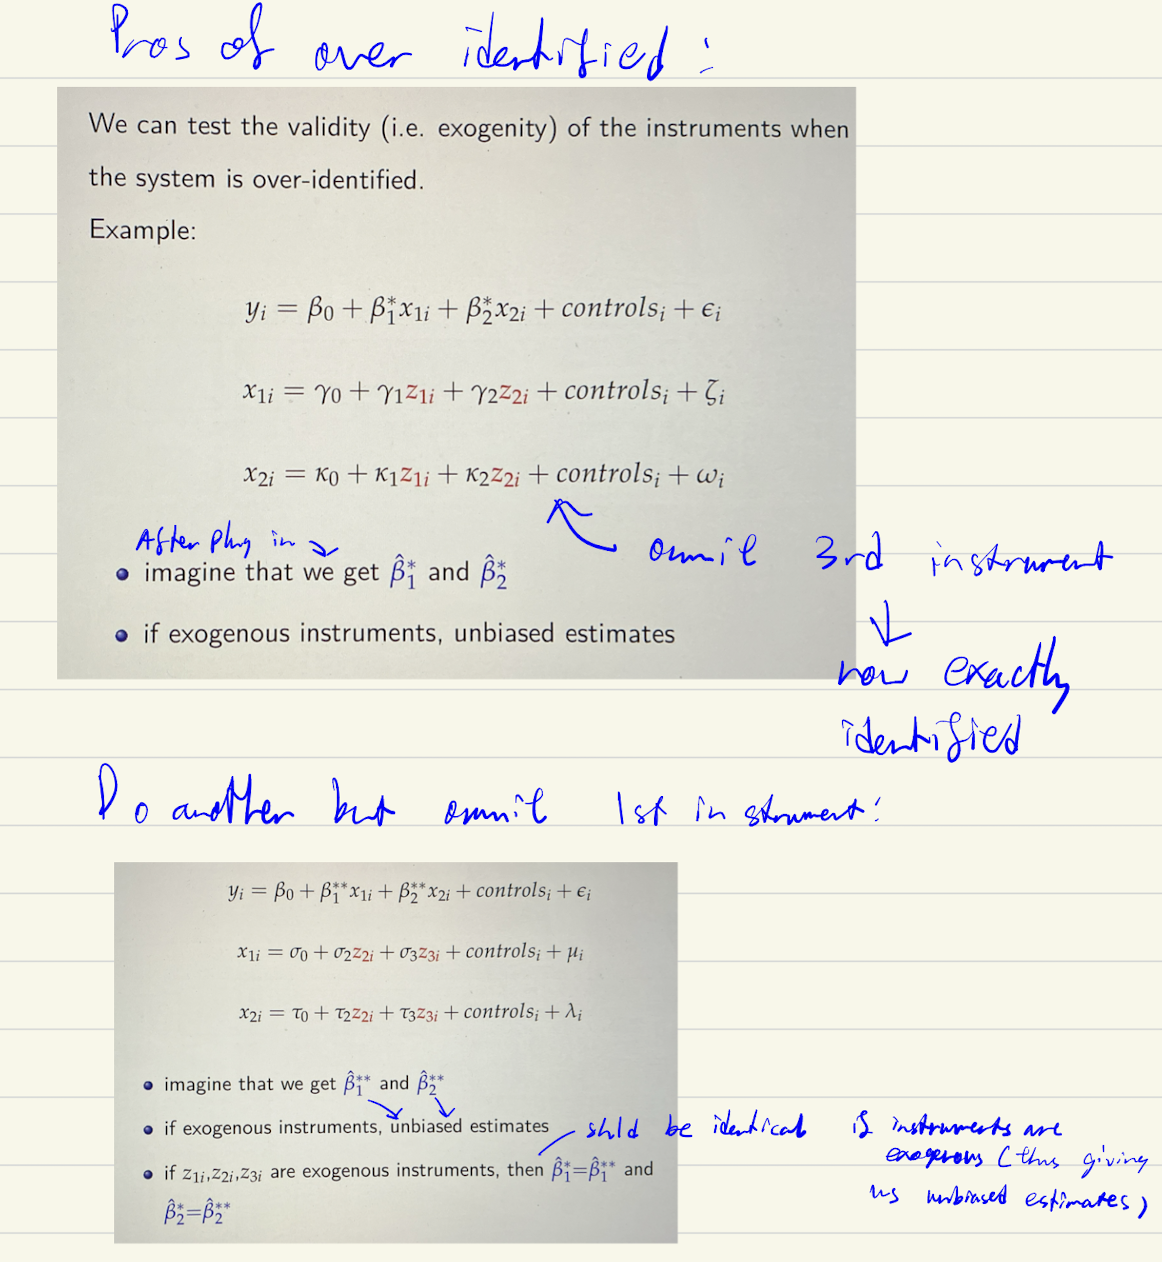
Pros of over identification
ME of IDP in panel data