RC6 - Risk messages II (keyterms, mp + scenario questions)
0.0(0)
Studied by 1 personCard Sorting
1/31
There's no tags or description
Looks like no tags are added yet.
Last updated 2:57 PM on 5/29/26
Name | Mastery | Learn | Test | Matching | Spaced | Call with Kai |
|---|
No analytics yet
Send a link to your students to track their progress
32 Terms
1
New cards
What is probability?
A measure quantifying the uncertainty of an event, ranging from 0 (impossible) to 1 (certain)
2
New cards
What are the three faces of probability?
1. Frequency (relative frequency based on observation) 2. Physical design (propensity — constructed, e.g. a die) 3. Degrees of belief (subjective expert judgment)
3
New cards
What distinguishes frequency probability from degrees of belief?
Frequency is measured through observation in a reference class; degrees of belief are subjective judgments constructed using expertise, not measured
4
New cards
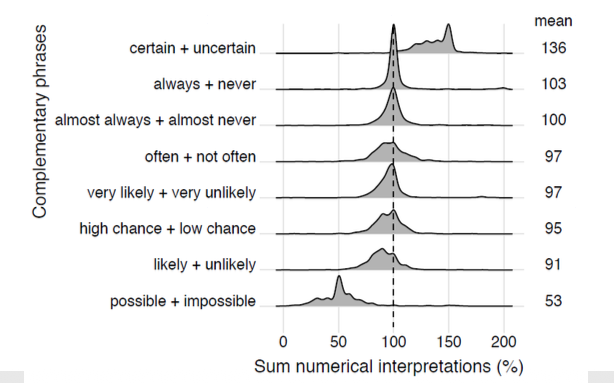
What is the main risk of using verbal probability phrases?
Large variability in numerical interpretations — the same word (e.g. "likely") means different percentages to different people (Willems et al., 2020)
5
New cards
What did Vromans et al. (2024) find about prosodic uncertainty cues?
Rising intonation increases variability in interpretations and pulls estimates toward the middle — high probabilities are estimated lower, low probabilities higher
6
New cards
Why is verbal-only communication of personalized risks problematic?
It consistently produces inaccurate risk interpretations; combining verbal phrases with numbers improves accuracy
7
New cards
What is a natural frequency?
An absolute count within a fixed reference group, e.g. "7 in 100 people" instead of "7%" — communicates risk without requiring probabilistic reasoning
8
New cards
Why are percentages problematic for communicating single-event probabilities?
The reference class is ambiguous (percentage of what?), events may not be repeatable, and the statement functions as a mere confidence expression rather than a true frequency
9
New cards
What is the 1-in-X problem?
Formats like "1 in 8" and "1 in 17" cannot be easily compared; use consistent denominators instead ("13 in 100" vs "6 in 100")
10
New cards
What is the difference between relative risk and absolute risk?
Relative risk expresses change as a ratio relative to baseline (psychologically inflates effects); absolute risk gives the actual probability of an event in a population
11
New cards
Explain why relative risk alone is misleading
A "100% increase in risk" sounds dramatic, but if baseline risk is 1 in 7,000, the absolute increase is only 1 in 7,000 — the same information looks very different
12
New cards
What is information evaluability?
The degree to which a patient can intuitively assess the meaning and severity of an isolated personalized risk figure ("is this good or bad?")
13
New cards
How does comparative data improve information evaluability?
By showing the population average alongside the personalized figure, patients can anchor their own number and assess whether it is high or low
14
New cards
What is the narrative bias effect?
When a vivid, emotional story causes a person to ignore or contradict the statistical facts — stories must be factually balanced with data to prevent this
15
New cards
Why are LLMs avoided in clinical risk communication?
They too frequently generate factual errors and medical hallucinations, which can be life-threatening in clinical contexts
16
New cards
What is lead-time bias?
The illusion that screening improves survival because diagnosis happens earlier — but the actual date of death does not change, only the time spent knowing about the disease
17
New cards
What is overdiagnosis?
Screening detects harmless abnormalities that would never have caused symptoms; adding these "healthy" patients to statistics artificially inflates survival rates
18
New cards
Why are five-year survival rates a misleading metric for screening quality?
They are distorted by lead-time bias and overdiagnosis — mortality rates are the only reliable indicator
19
New cards
What are mortality rates and why are they preferred?
Mortality rates measure actual deaths per population per period; unlike survival rates, they cannot be inflated by earlier diagnosis or overdiagnosis
20
New cards
What is statistical illiteracy?
The widespread inability to correctly interpret basic information about risks, uncertainty, and health statistics — present even among physicians and journalists
21
New cards
What is the illusion of certainty?
The false belief that medical tests are infallible and that medicine can provide absolute certainty, which impairs rational decision-making under uncertainty
22
New cards
What is conditional probability, and why is it problematic in medicine?
A probability given that another event has occurred (e.g., sensitivity). Physicians consistently misinterpret conditional probabilities, overestimating the chance that a positive test means actual disease
23
New cards
How do natural frequencies solve the conditional probability problem?
By converting abstract probabilities into raw counts (e.g., "of 1000 women, 10 have cancer, 9 test positive, 89 healthy women also test positive"), the correct answer becomes intuitively visible
24
New cards
What did Willems et al. (2020) find?
Large variability in how people numerically interpret verbal probability phrases; complementary pairs do not consistently add up to 100
25
New cards
What did the personalized cancer treatment paper conclude about communication format?
Natural frequencies + comparative data + factually balanced narratives significantly increase patient comprehension and support shared decision-making
26
New cards
What is latent class analysis in the context of cancer treatment?
A clustering model that identifies subgroups of patients with comparable quality-of-life patterns — simplifies communication of multidimensional outcomes
27
New cards
What is indication bias?
In observational medical data, physicians prescribe treatments based on patient characteristics, not randomly — this makes treatment comparisons unreliable without causal correction
28
New cards
What is survivorship bias in medical prediction?
Models trained only on patients who survived the initial treatment produce distorted estimates — long-term quality of life data is missing for those who did not survive
29
New cards
What is causal inference and when is it needed?
A set of techniques (e.g., inverse propensity weighting) used to estimate true treatment effects from observational data where random assignment was not possible
30
New cards
What is shared decision-making?
A process where physician and patient together weigh medical statistics and personal preferences to decide on the optimal treatment strategy
31
New cards
Explain why natural frequencies are better than percentages for communicating medical risk
Percentages lack a clear reference class and require probabilistic reasoning humans are poor at; natural frequencies express absolute counts in a fixed group, matching how people naturally think in outcomes
32
New cards
Under what conditions is verbal-only risk communication especially harmful?
When communicating personalized treatment risks — words alone produce systematically inaccurate perceptions; verbal + numerical combined is required