Statistics Chapter 2
1/19
There's no tags or description
Looks like no tags are added yet.
Name | Mastery | Learn | Test | Matching | Spaced | Call with Kai |
|---|
No analytics yet
Send a link to your students to track their progress
20 Terms
equation for area of pie chart and total frequency
area of pie chart = total frequency
how to draw a pie chart
total frequency
calculate angle for each frequency (360/frequency)
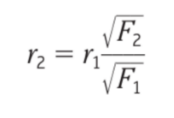
how to work out radius in comparative pie charts?
what is the purpose of population pyramids?
shows distribution of ages in a population, in numbers or proportion/percentages
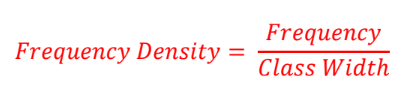
how to calculate frequency density?
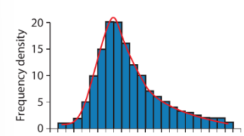
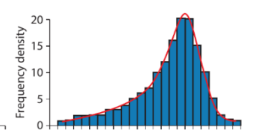
what does a positive skew look like?
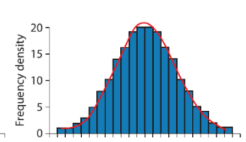
what does a symmetrical (no skew) look like?
what does a negative skew look like?
what are types of misleading diagrams?
3D charts distort diagram parts- difficult to read values.
colours make parts of diagram stand out more when not significant
Lines too thick- difficult to read
what axes and scales can be misleading?
Scales that do not start at zero.
Missing values on scales.
Axes unevenly scaled.
Axes not labelled.
Not using a key.
what is a two-way table?
information in two categories and has two variables so it is bivariate data
what is the function of tables?
gives exact values
does not show trends
what is the function of a bar chart?
for categorical and discrete data
shows trends
what is the function of a line graph
time series
shows trends
best when presenting 5+ data points
what is the function of histograms?
continuous data
proportions area to frequency
does not show frequency
what is the function of a pie chart?
shows proportions
summarises results
no accurate values
equation for calculating lower quartile?
n/4
equation for calculating upper quartile
3n/4
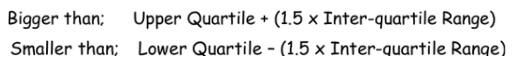
what is an outlier?