ATI TEAS MATH
1/158
There's no tags or description
Looks like no tags are added yet.
Name | Mastery | Learn | Test | Matching | Spaced | Call with Kai |
|---|
No analytics yet
Send a link to your students to track their progress
159 Terms
finding the percentage
% = p (part)/ w (whole)
finding the part
p (part) = w (whole) x %
finding the whole
w (whole) = p (part) / %
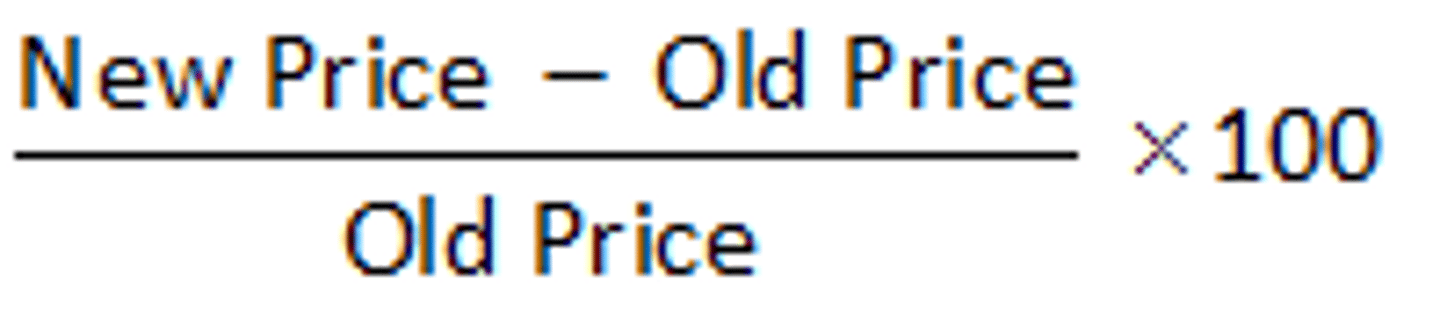
percent increase
percent increase = new amount - original amount / original amount x 100
mean
found by adding all numbers in a set together and dividing that by the number of the numbers in a set
median
arrange numbers from least to greatest and then find the middle number; when there are an even amount of numbers in a set, find the average (mean) of those two numbers
mode
arrange numbers from least to greatest, then find the number (s) that occurs the most often
range
subtract the smallest number from the highest number in a set
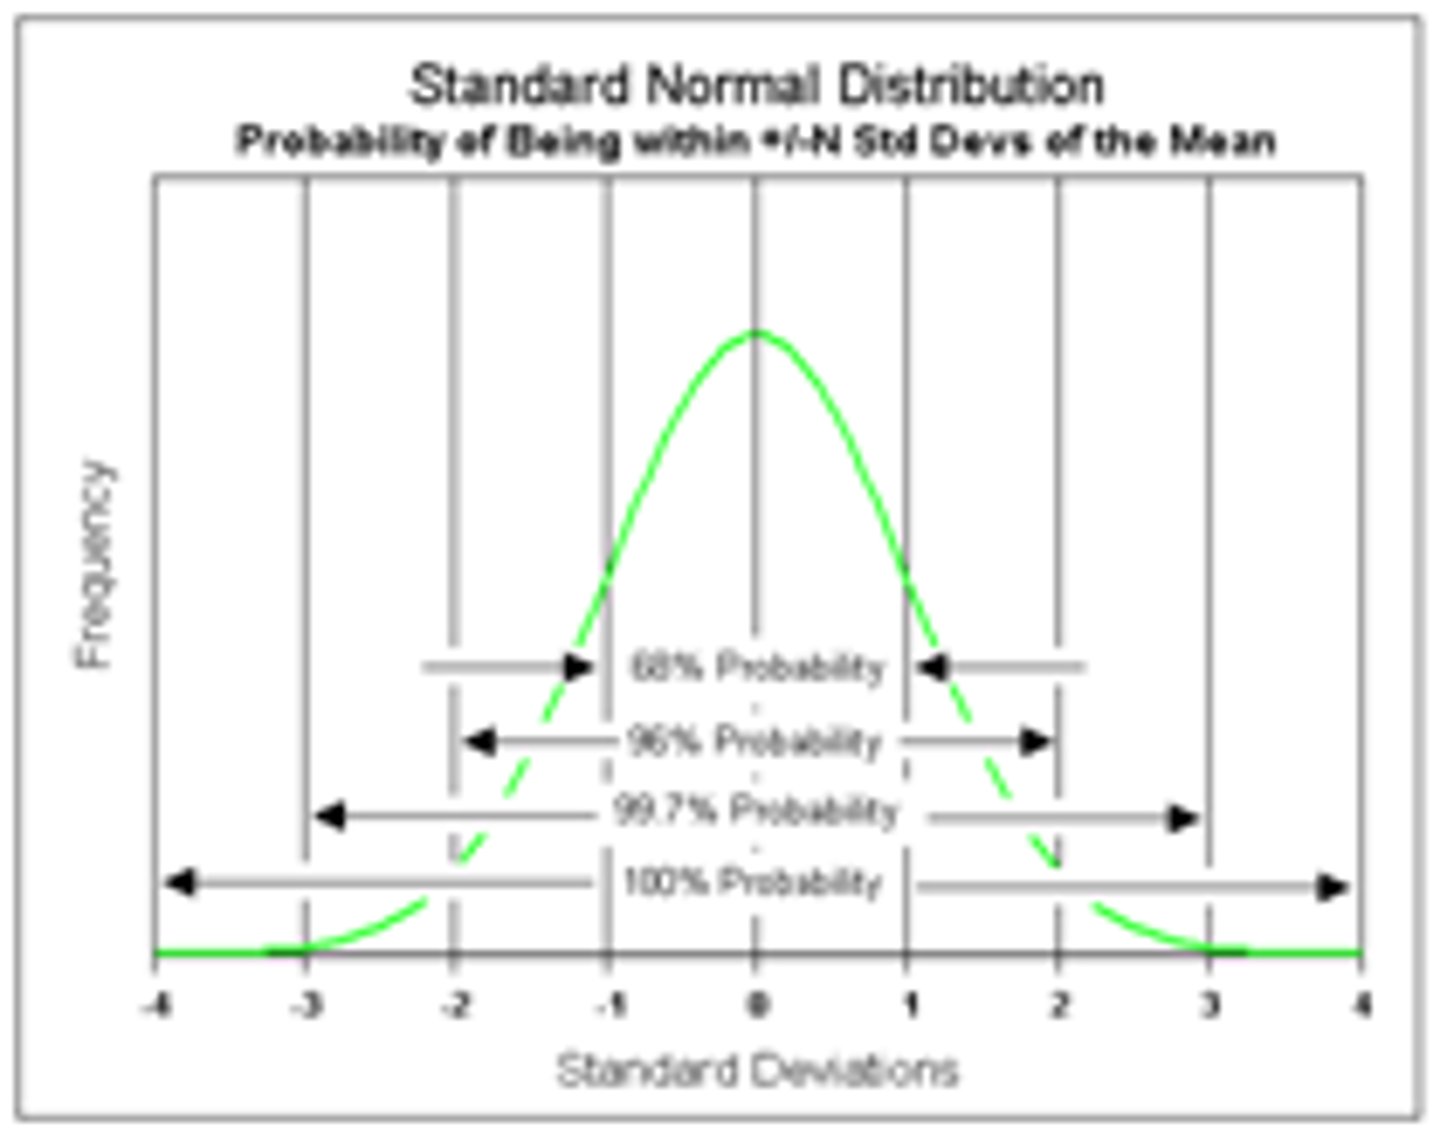
standard deviation
a measure of variability that describes the average distance of every score from the mean
low standard deviation
data is tightly clustered around the mean
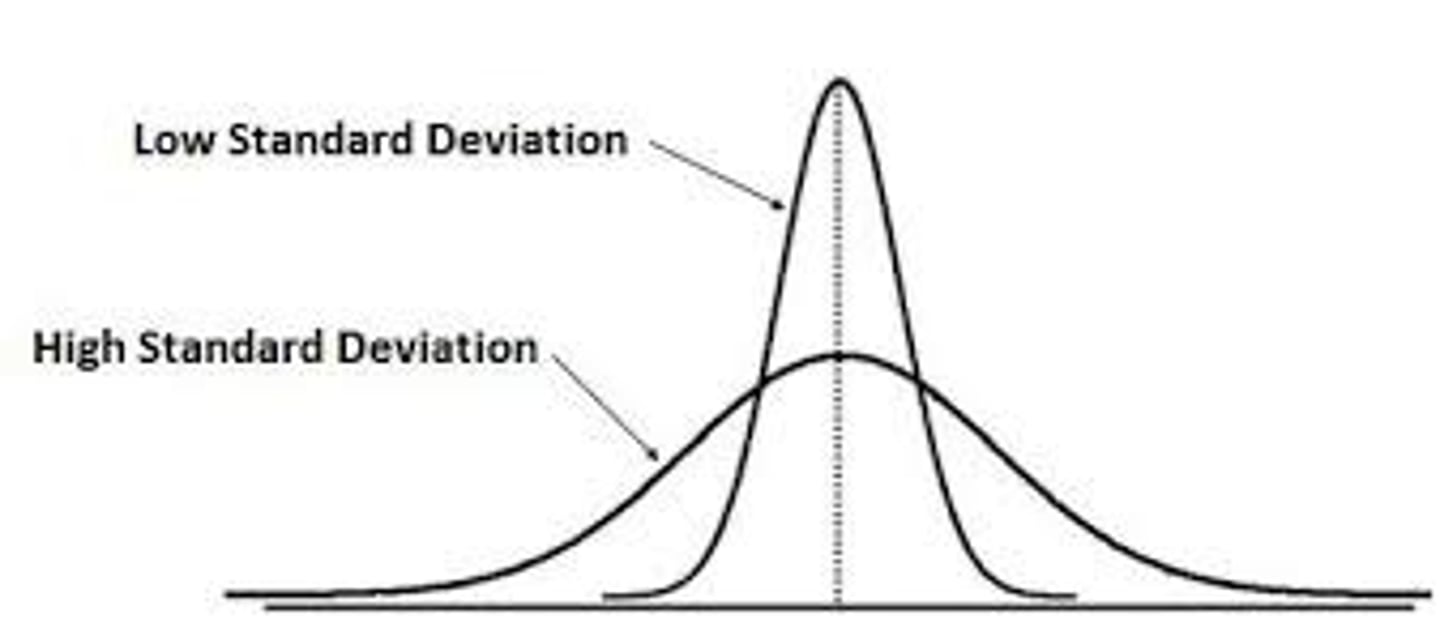
high standard deviation
data is loosely spread over a range of values

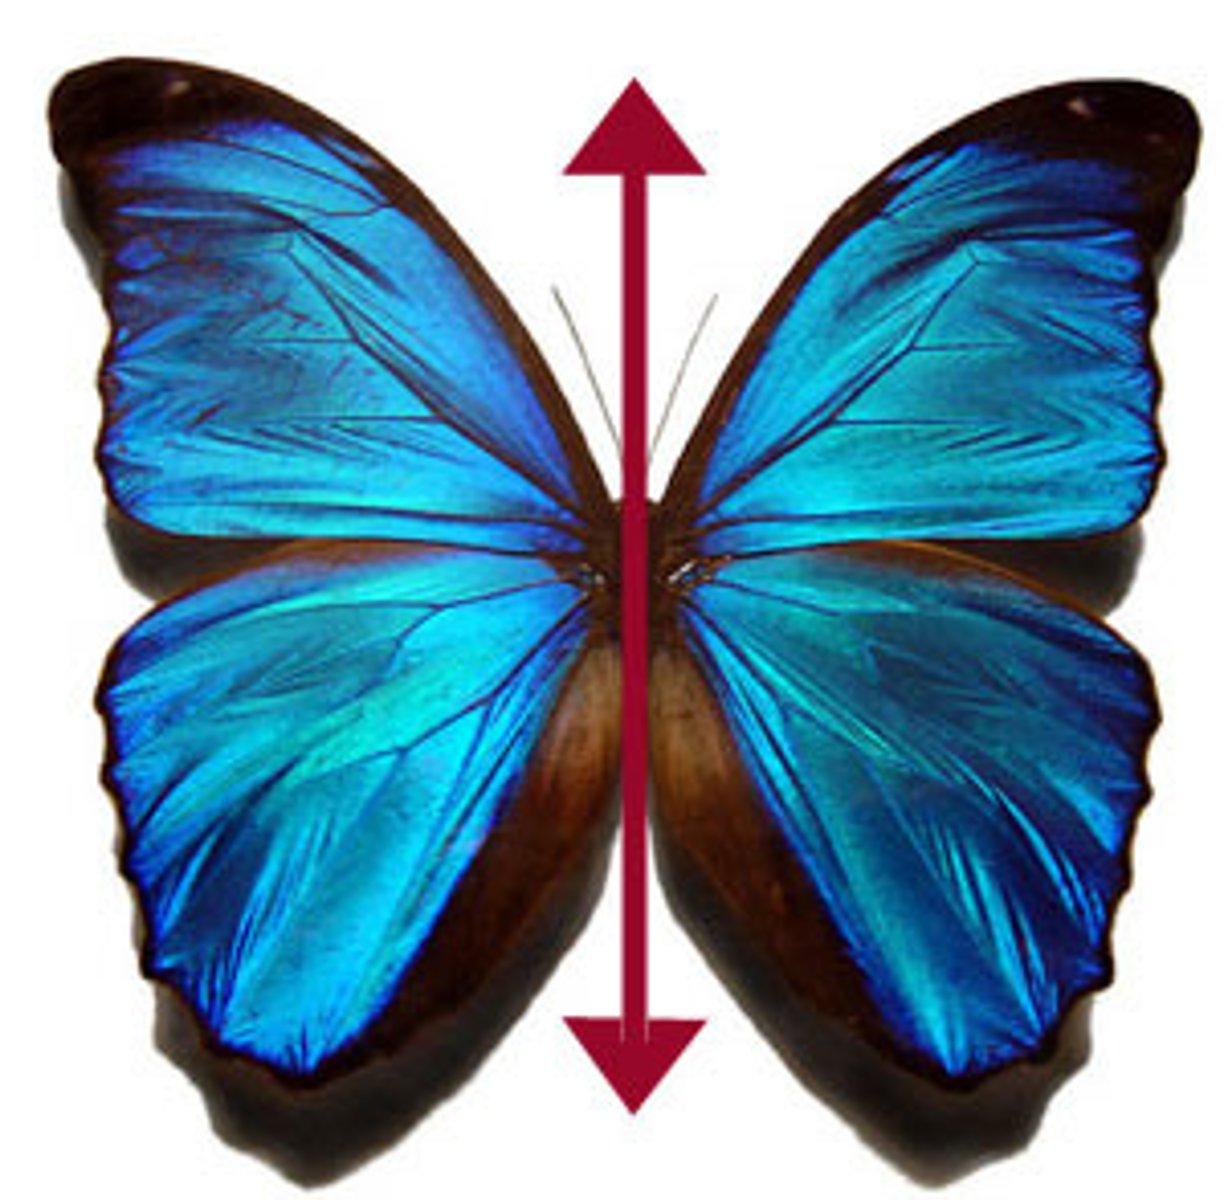
symmetry
data is equally distributed on either side of a line or point
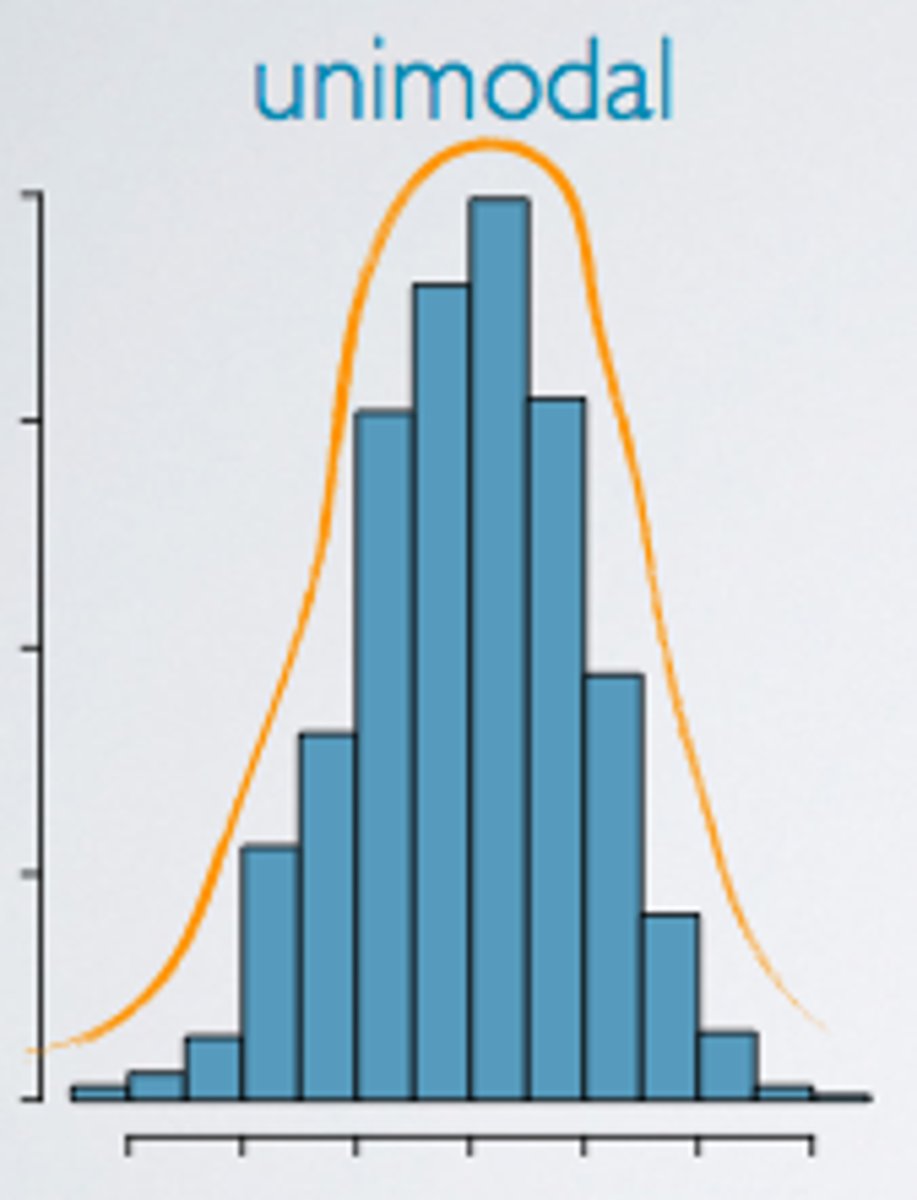
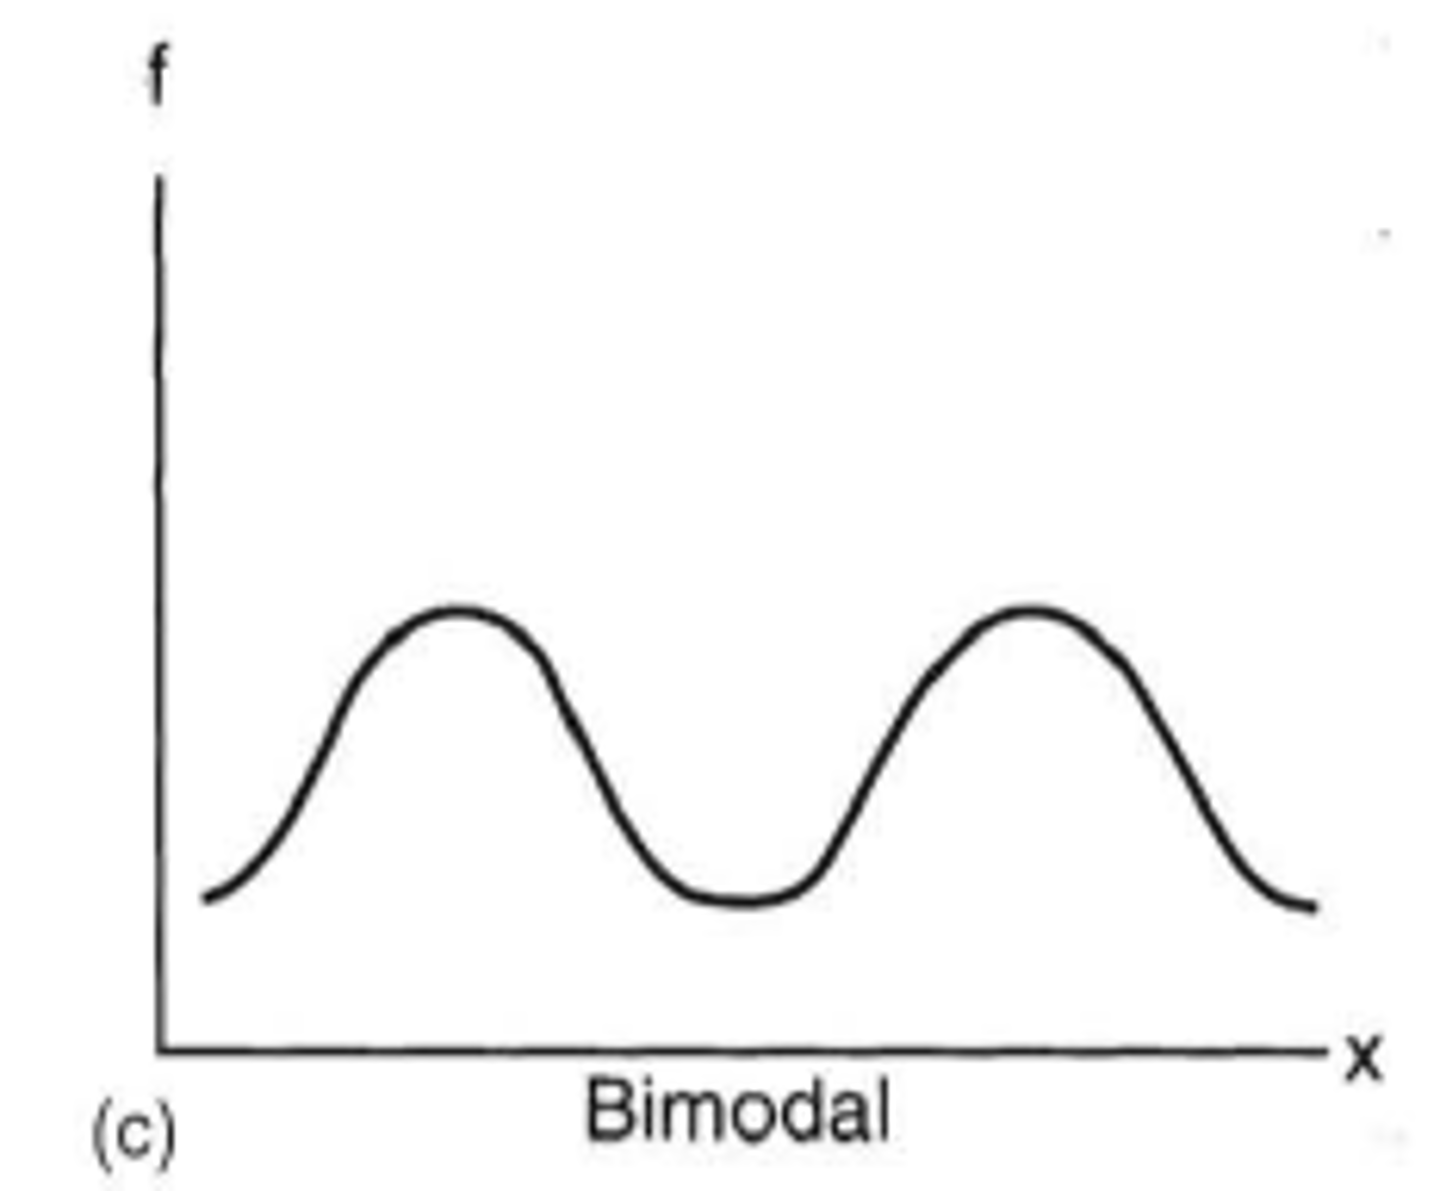
number of peaks
when data has multiple local maxima or minima; data can be bimodal (two peaks), unimodal (one peak), or multimodal (more and two peaks)
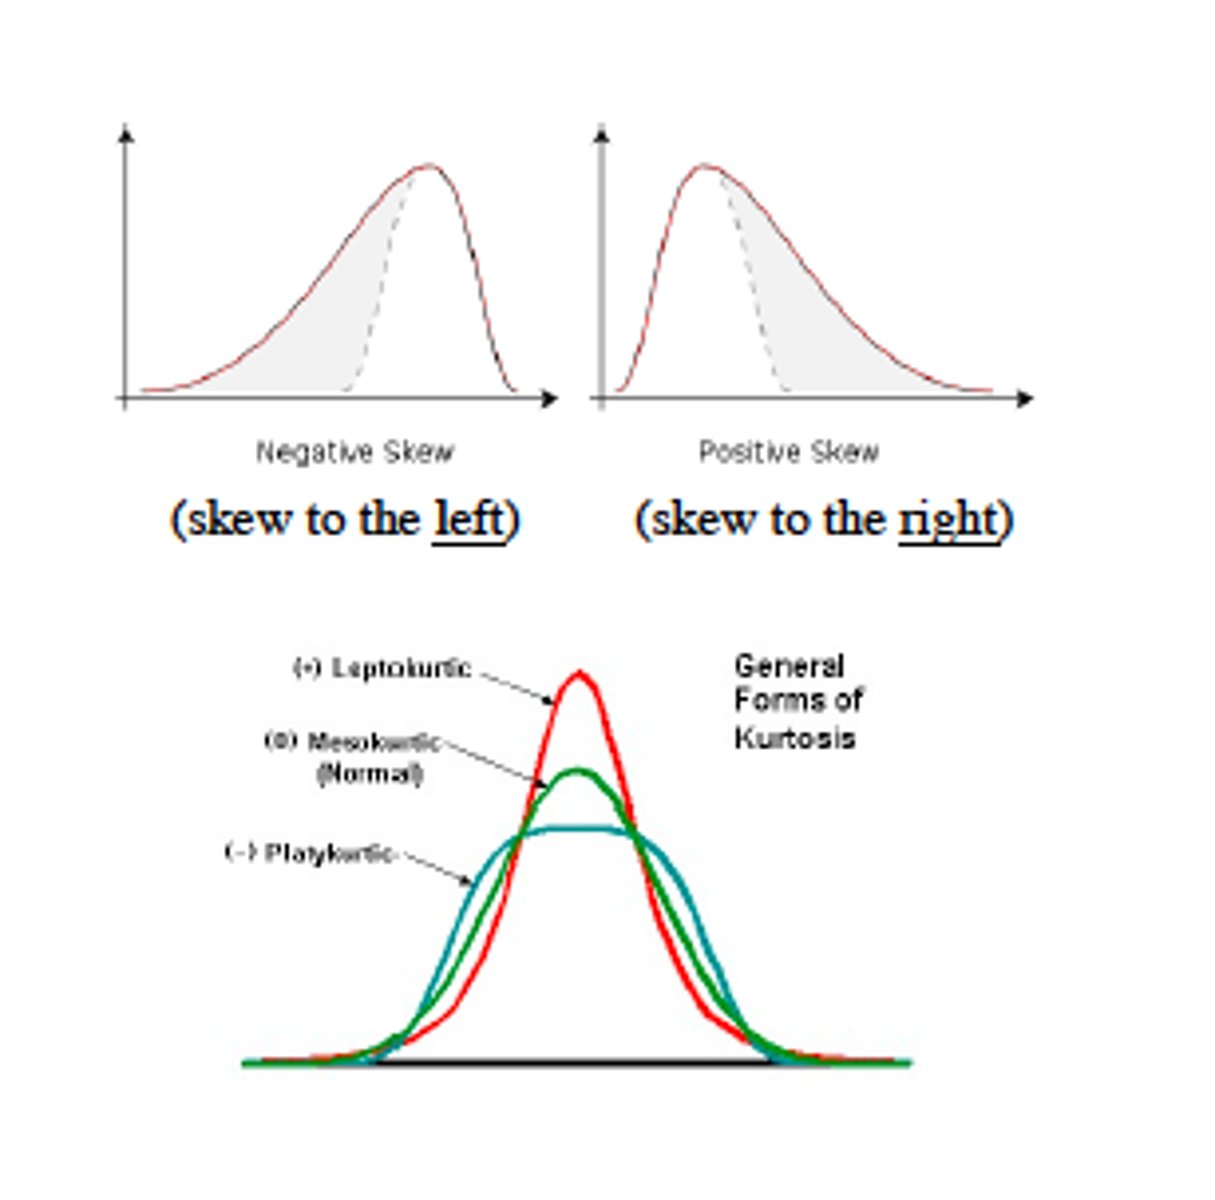
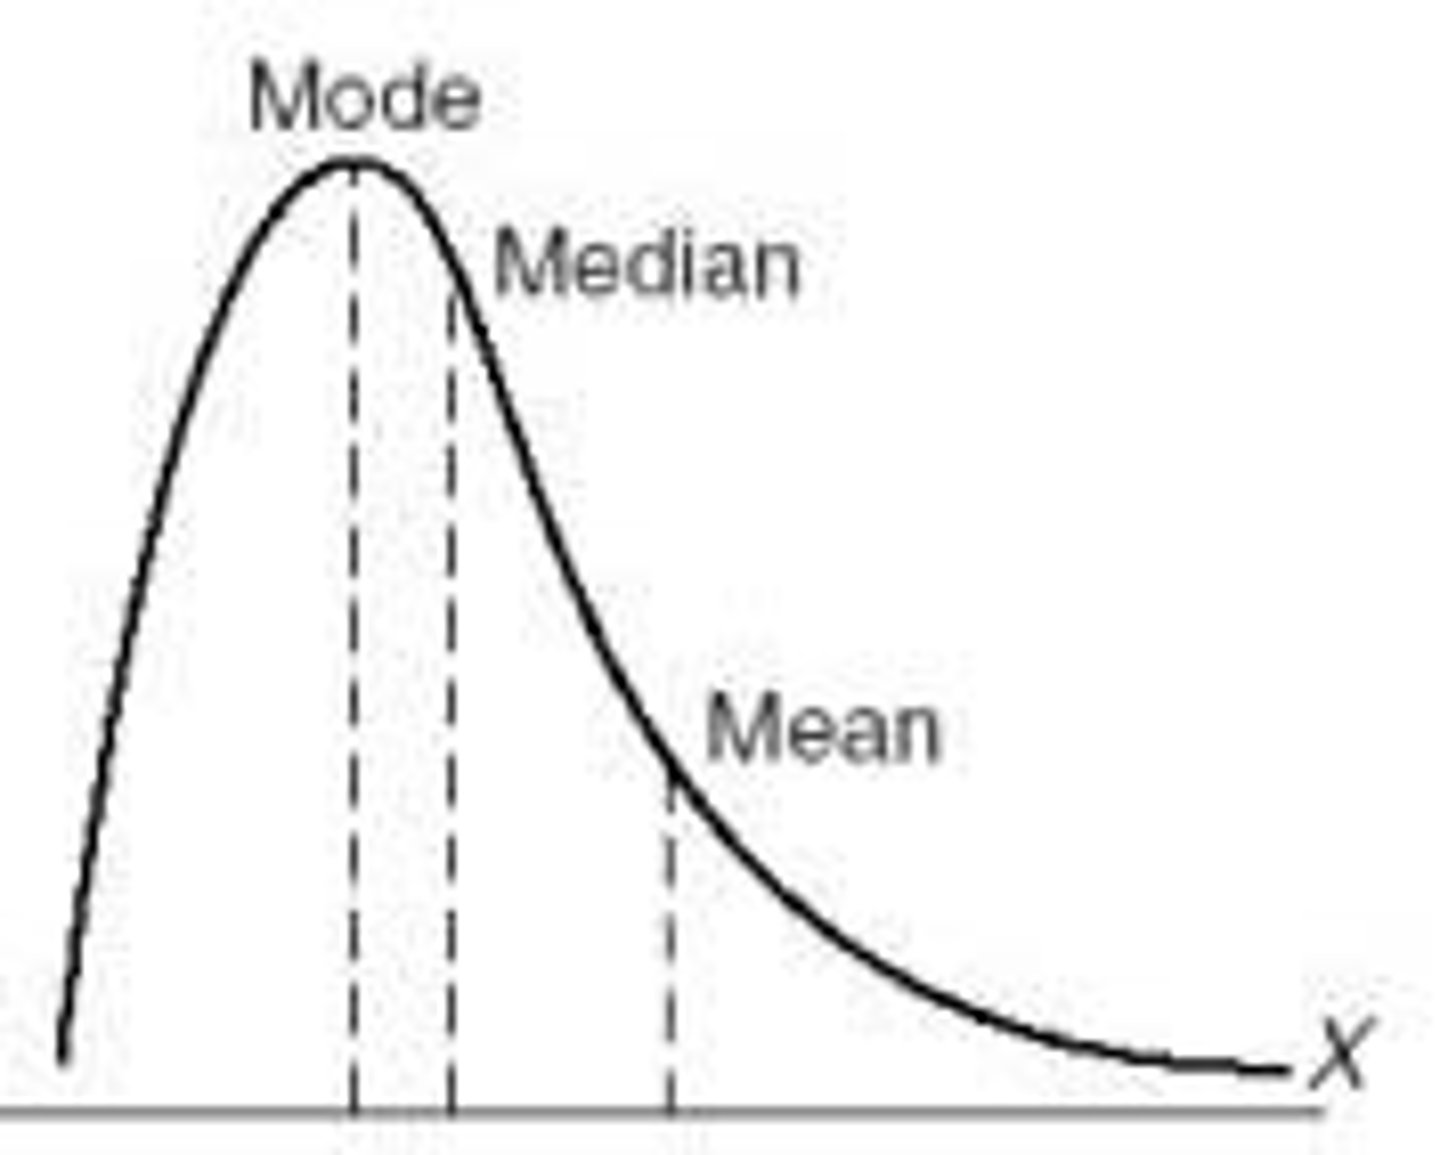
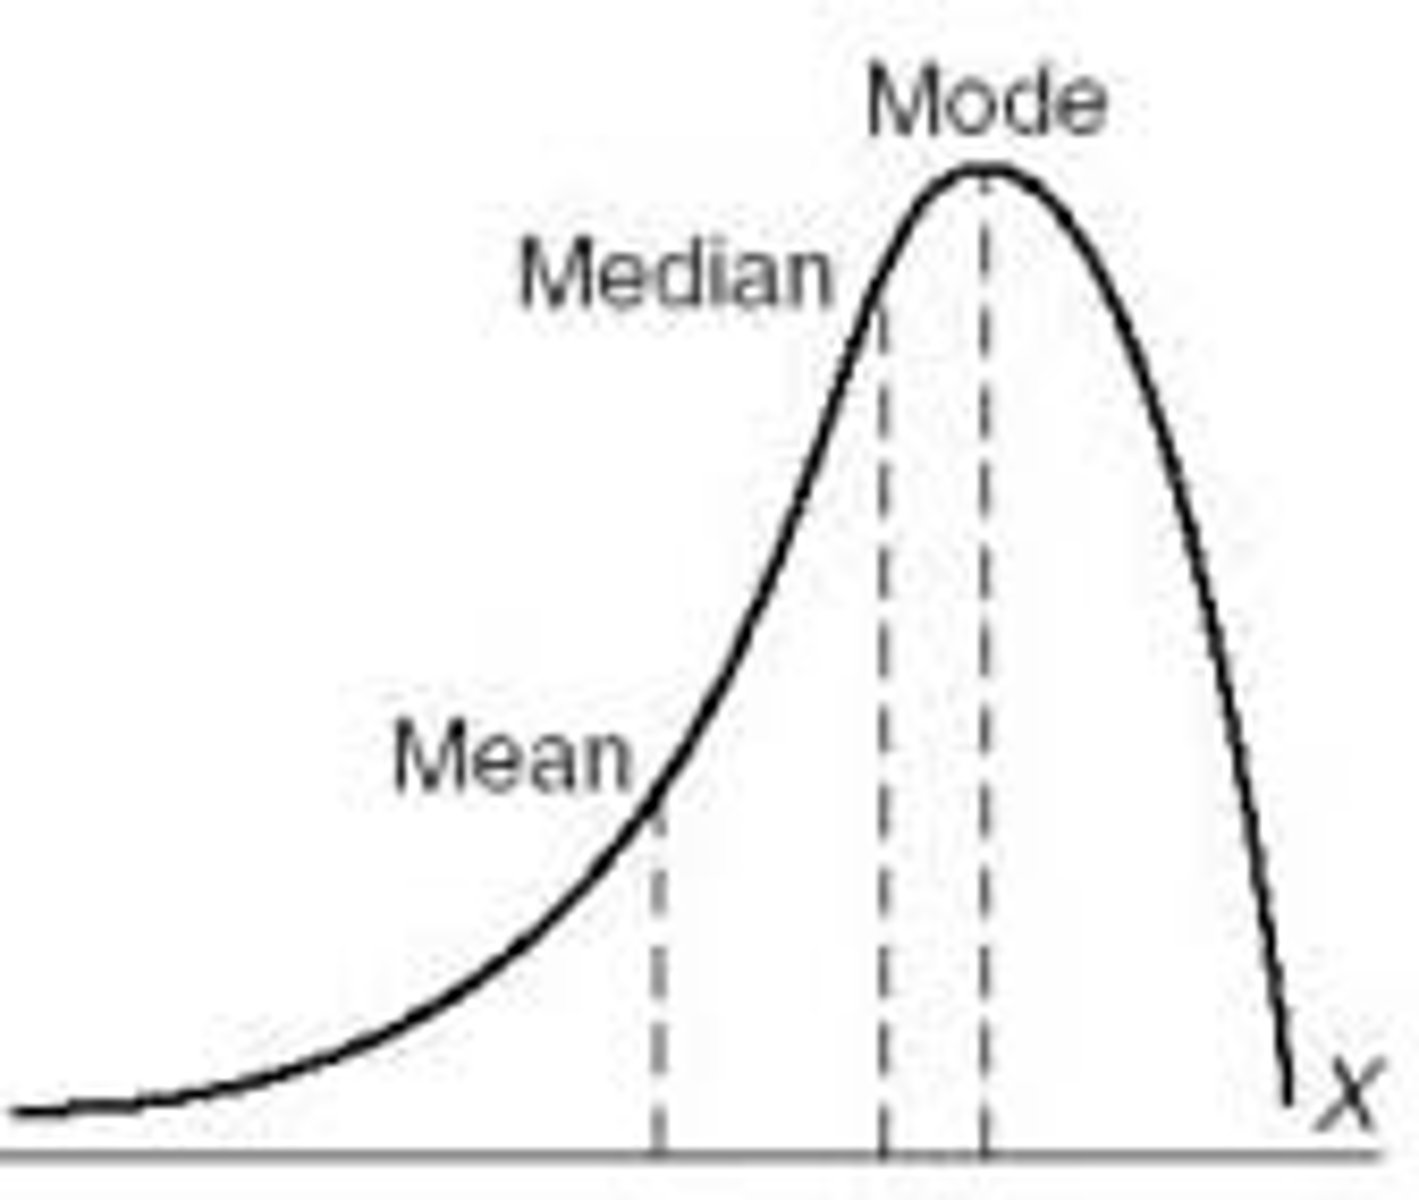
skewness
when data is not equally distributed on either side of a line or point
uniform data
When the frequency of each value of a variable in a graph is evenly spread out across the values of all variables.
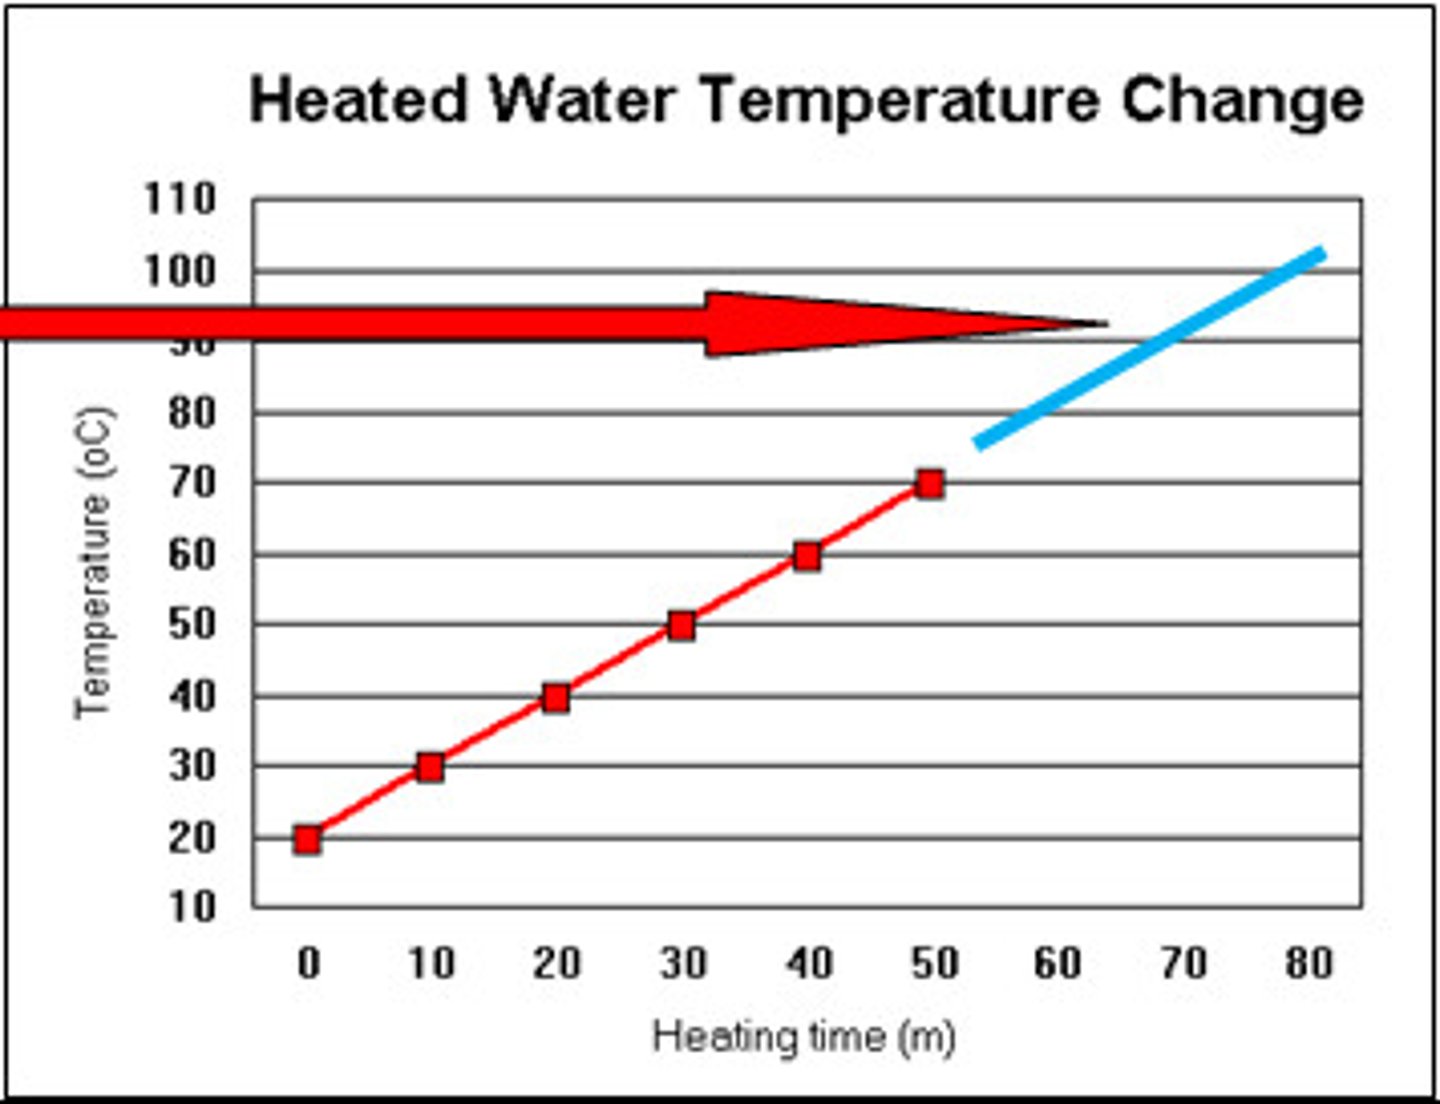
types of trends
linear, exponential, and quadratic
direction of trends
positive (increasing), negative (negative), no change (flat)
rate of change
describes how a quantity is changing over time
linear trend
a straight line (line of best fit) can be drawn through the data
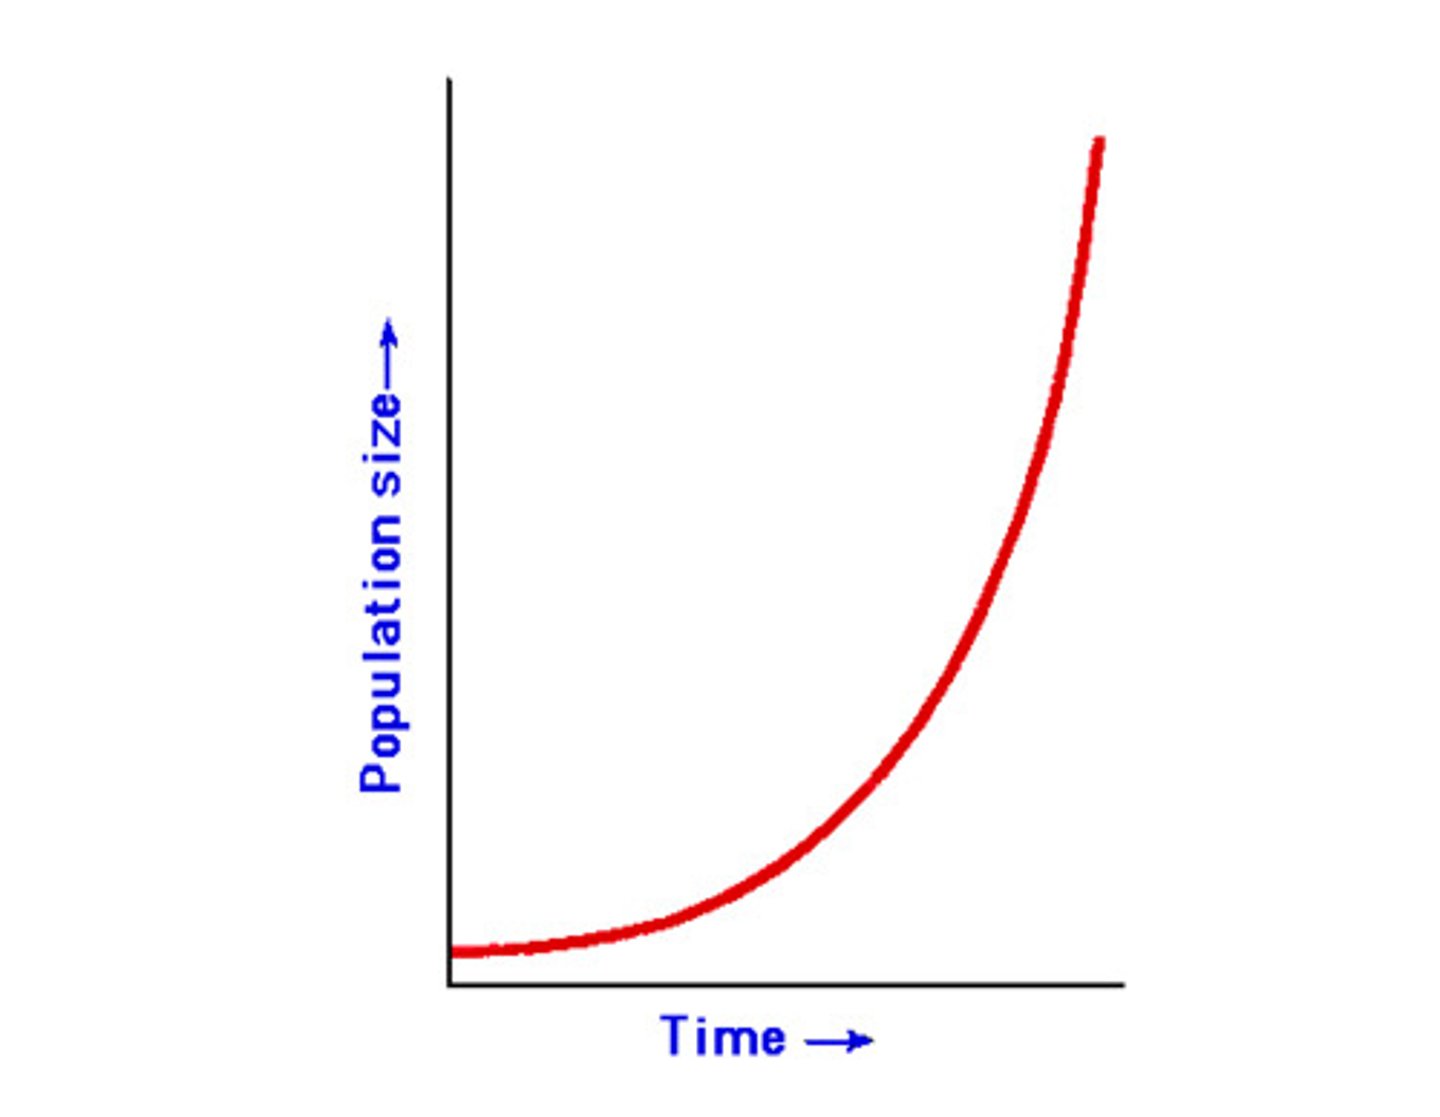
exponential trend
A trend with a constant growth rate; curved line
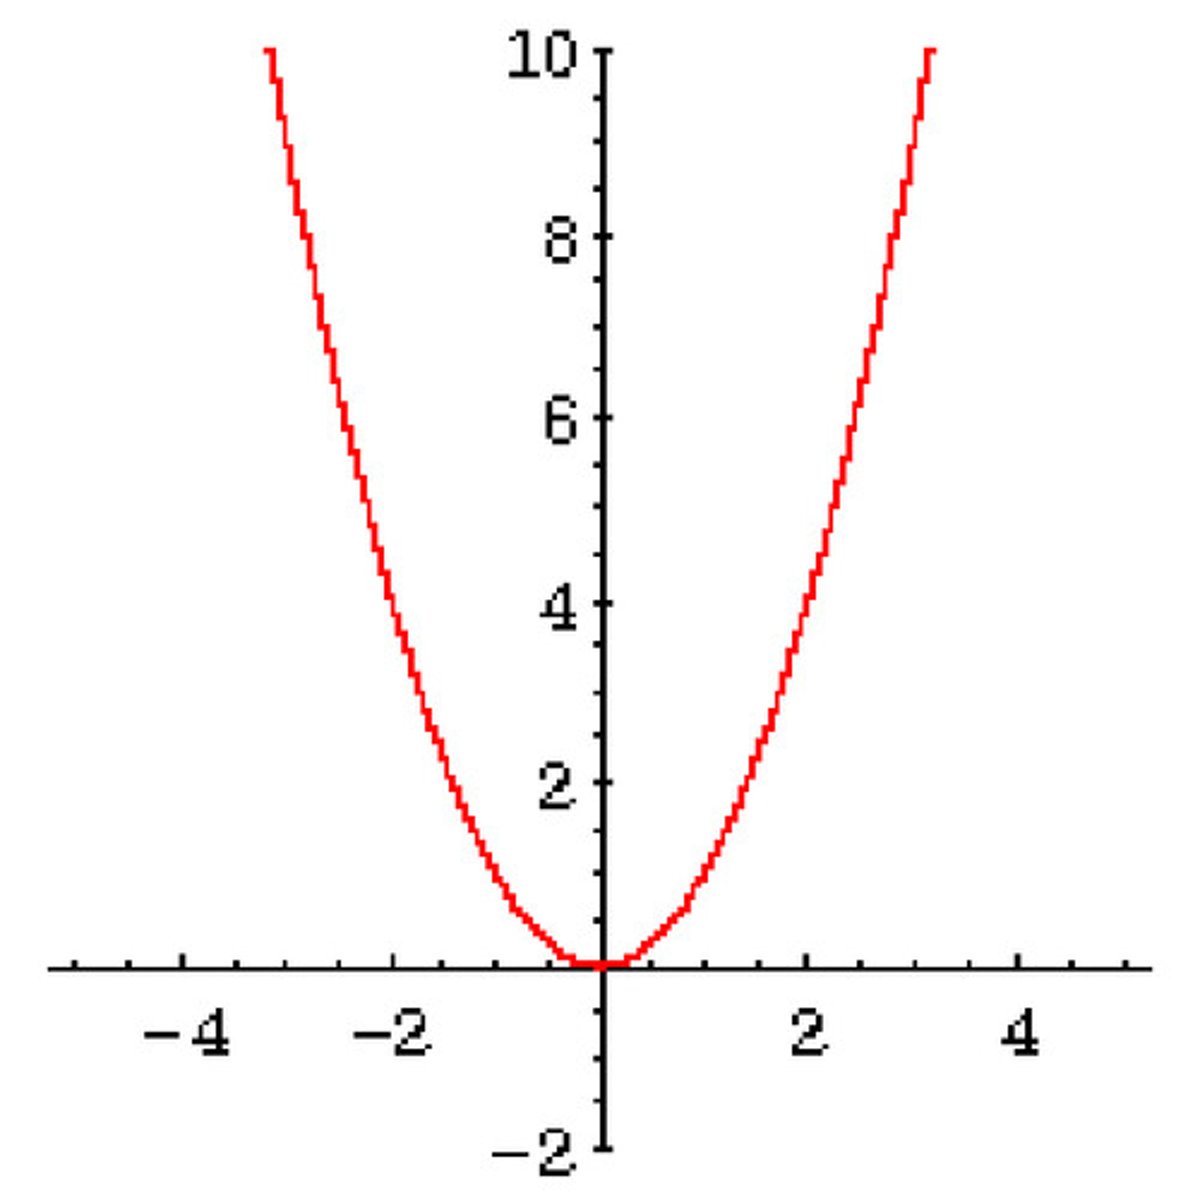
quadratic trend
increase in change but then stabilizes and decreases
probability
likelihood that a particular event will occur; formula - p(event) = (number of desired outcomes) / (total outcomes)
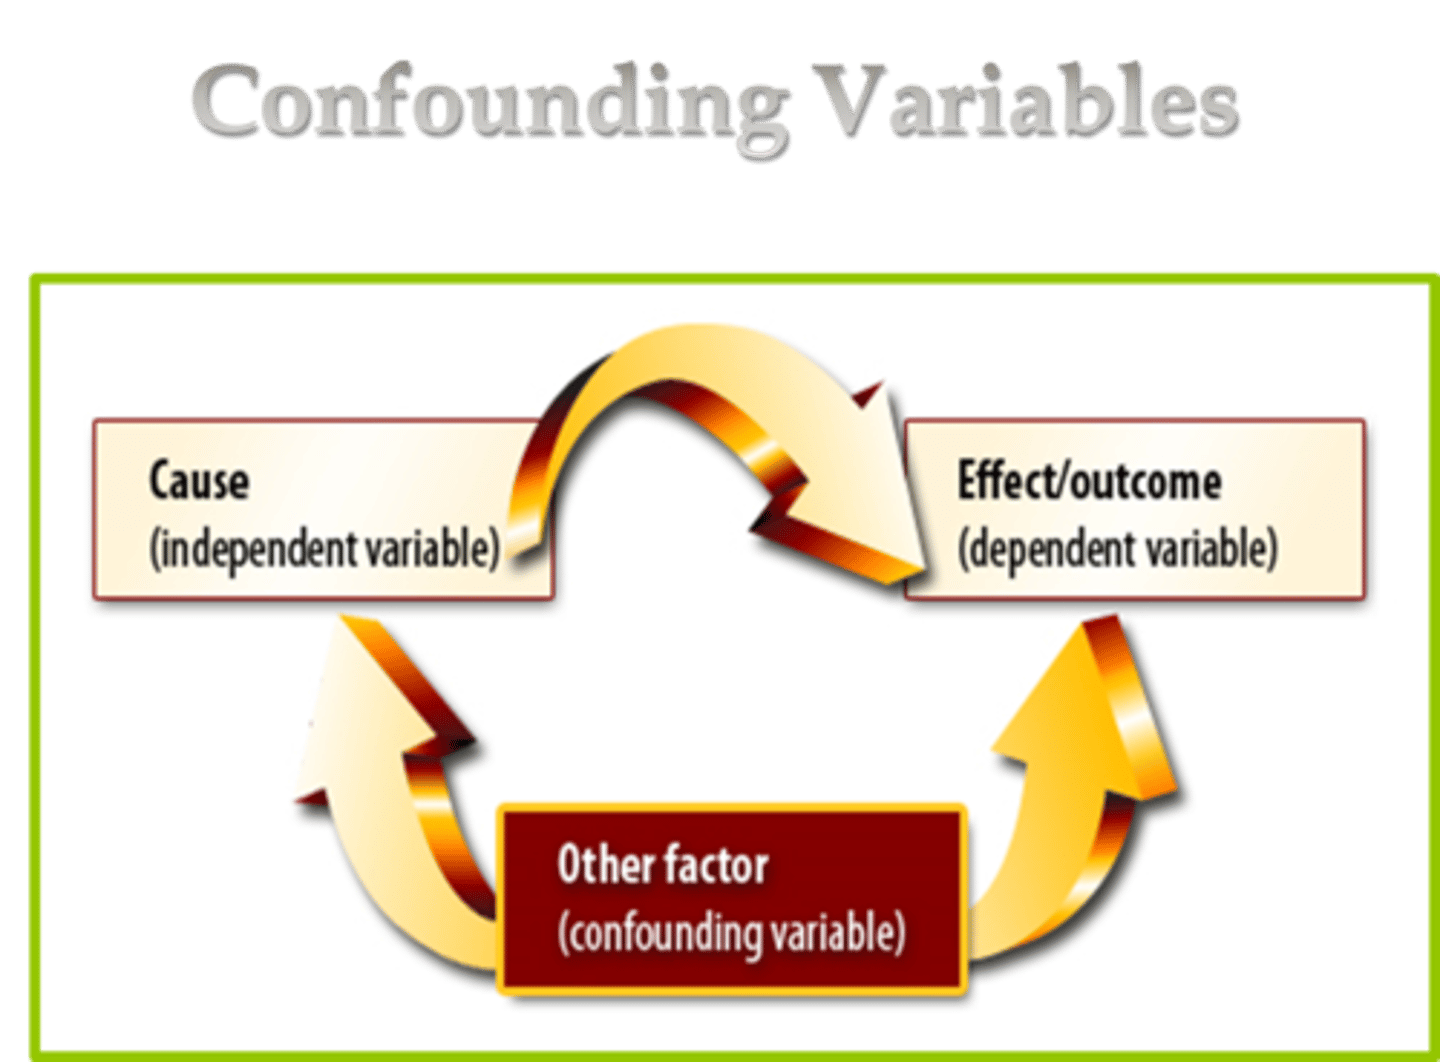
dependent variable
a variable (often denoted by y ) whose value depends on that of another.
independent variable
a variable (often denoted by x ) whose variation does not depend on that of another.
positive correlation
A correlation where as one variable increases, the other also increases, or as one decreases so does the other. Both variables move in the same direction.
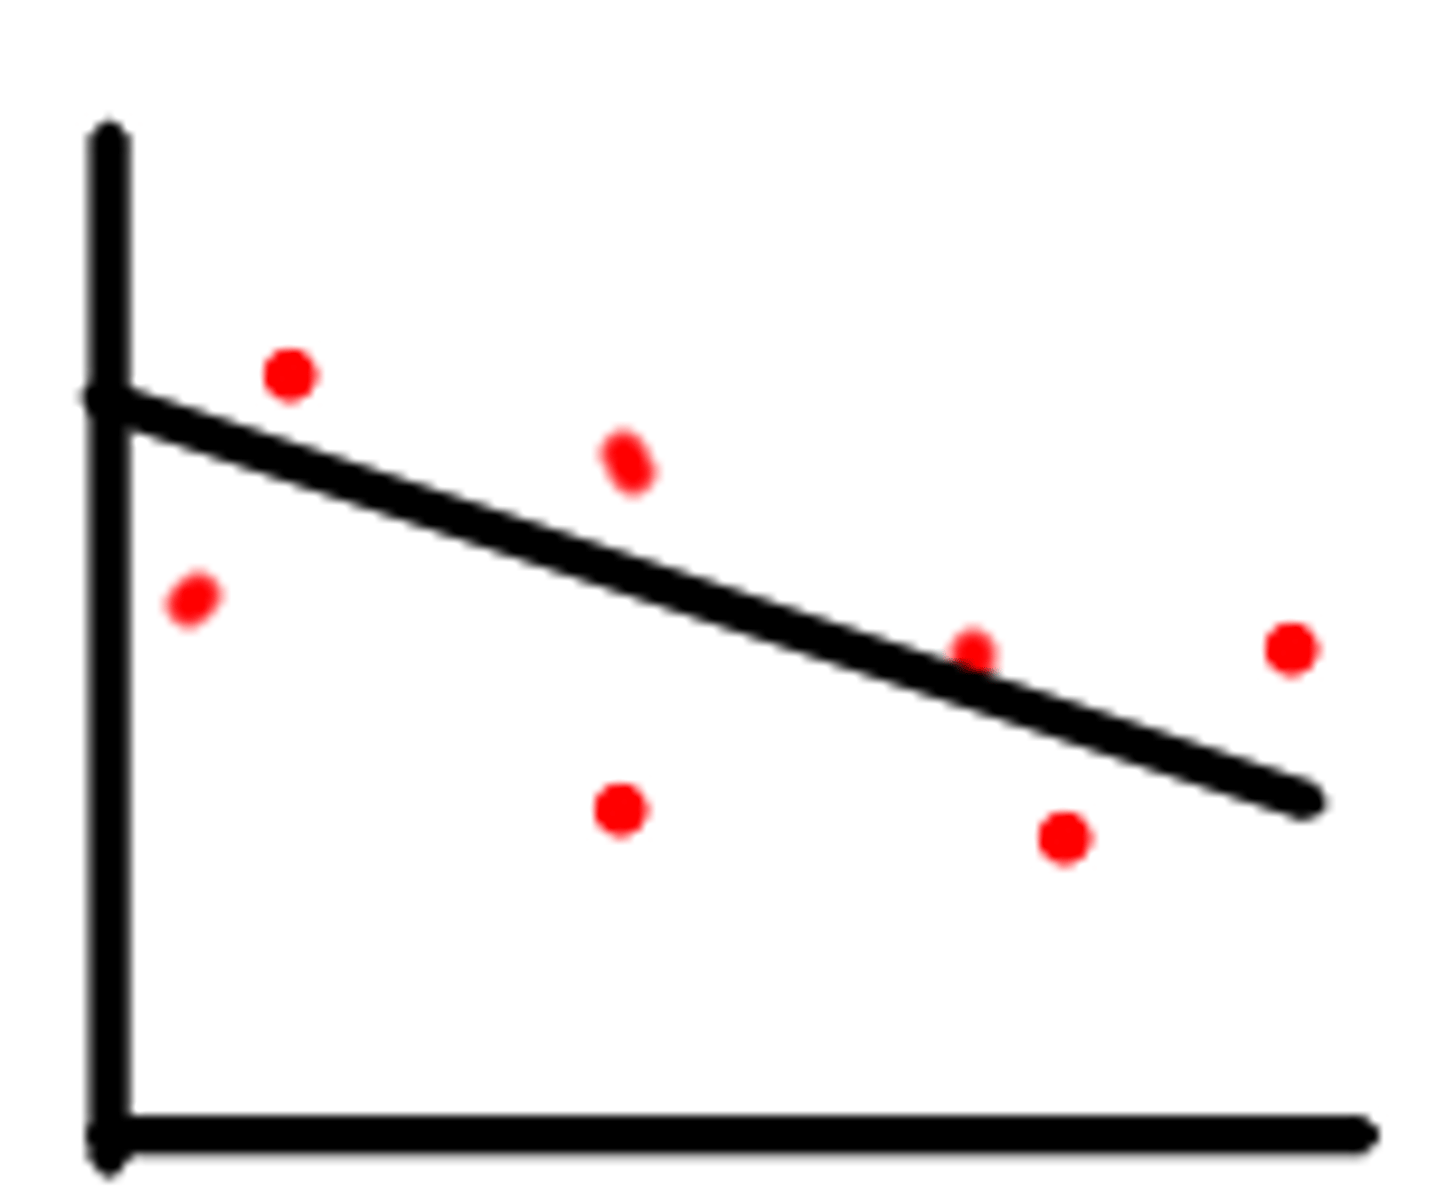
negative correlation
as one variable increases, the other decreases
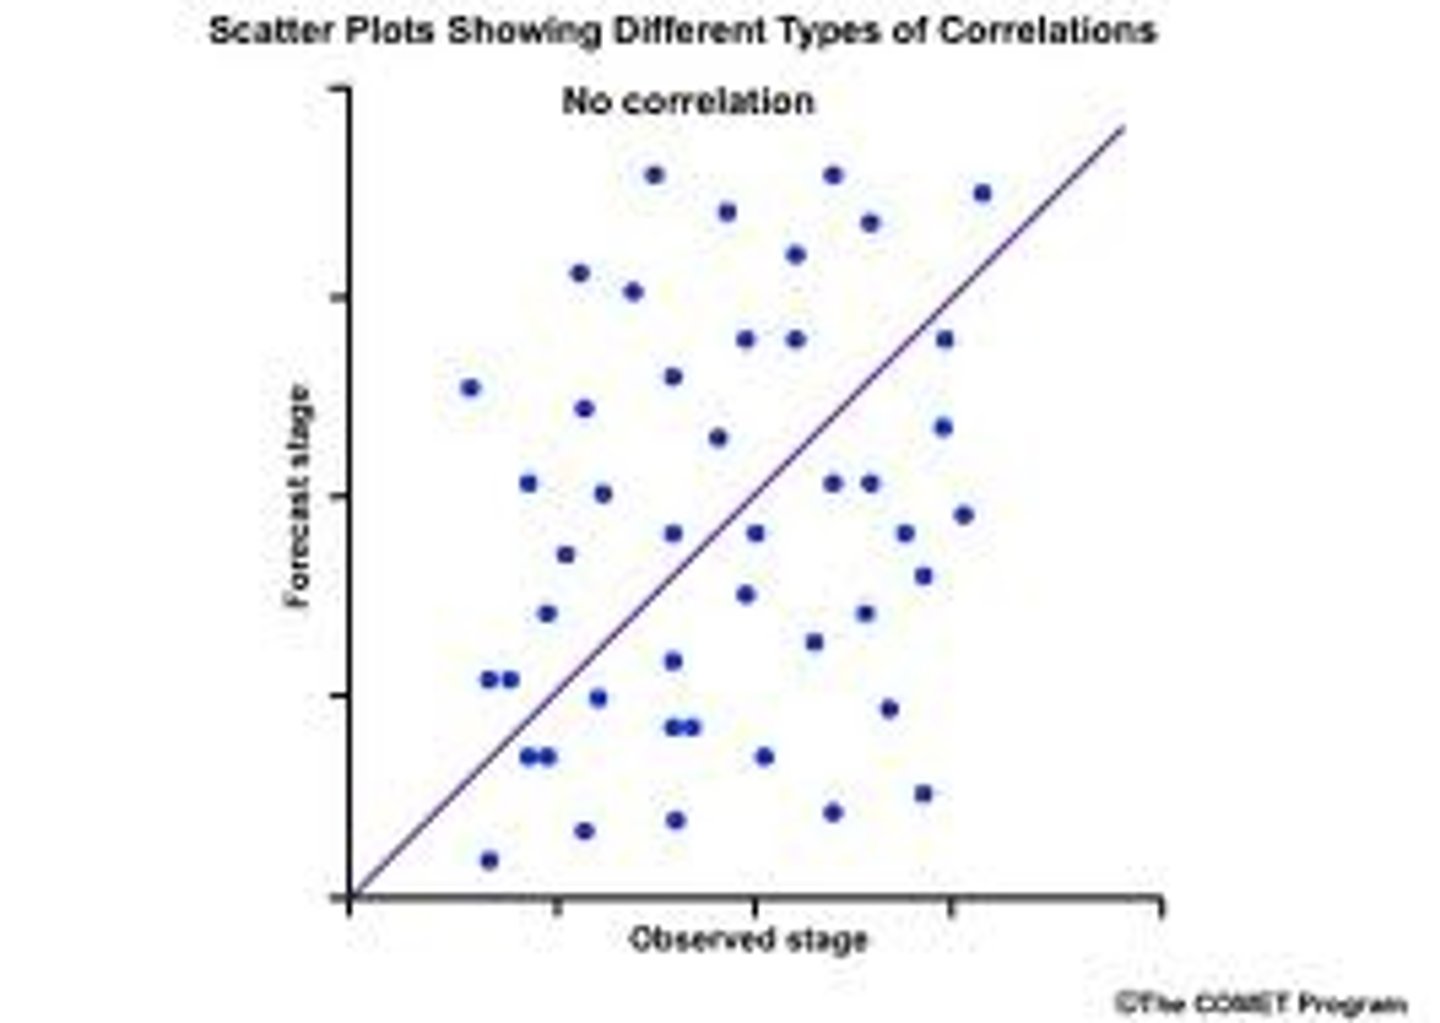
no correlation
There is no relationship between data sets.
direct relationship
a relationship in which one variable increases with an increase in another variable; y=mx
inverse relationship
a relationship in which one variable decreases when another variable increases; y=m/x
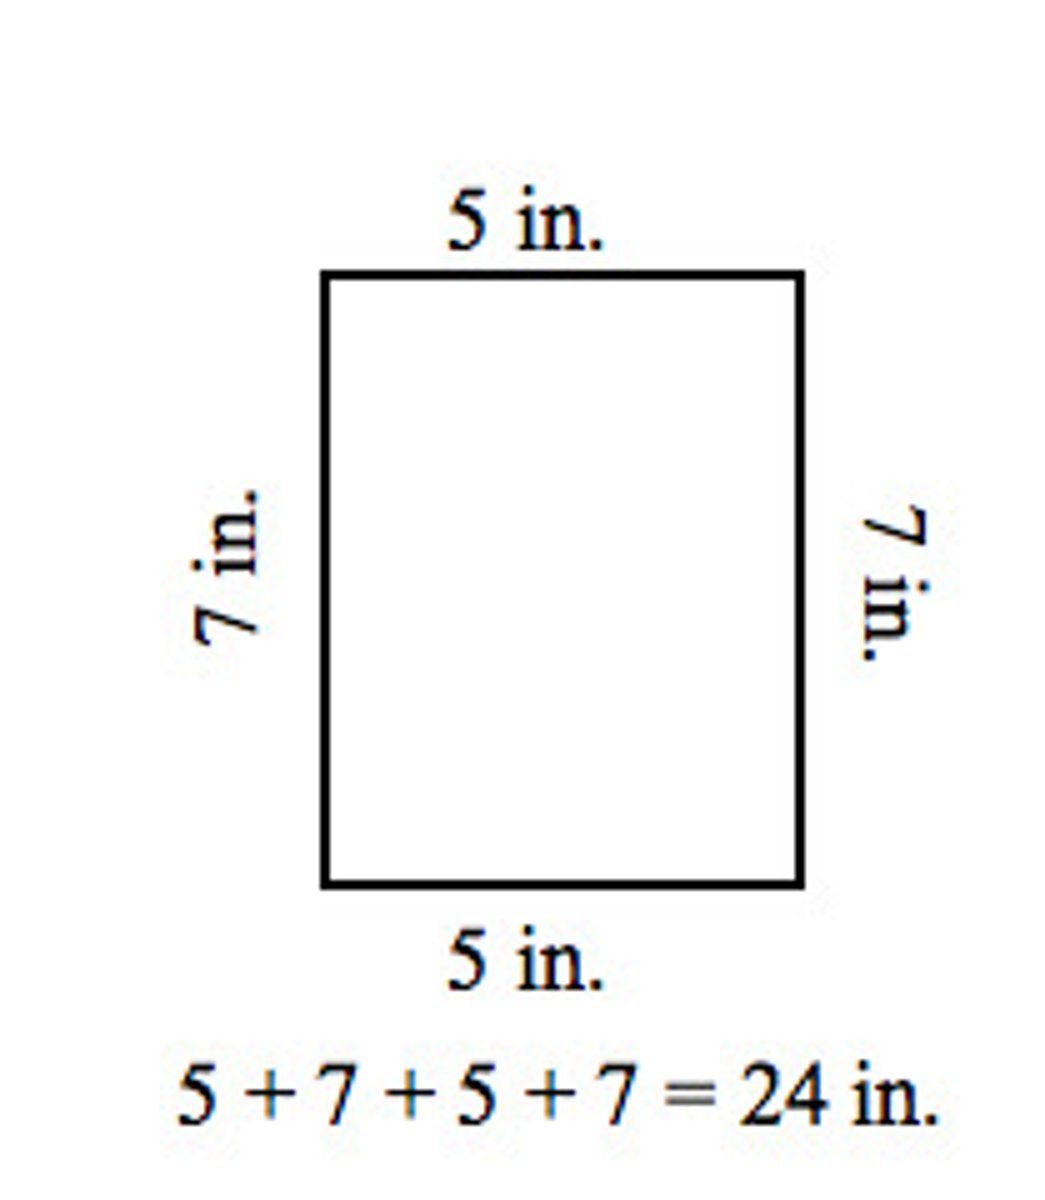
perimeter
p=s+s+s.... (s= side)
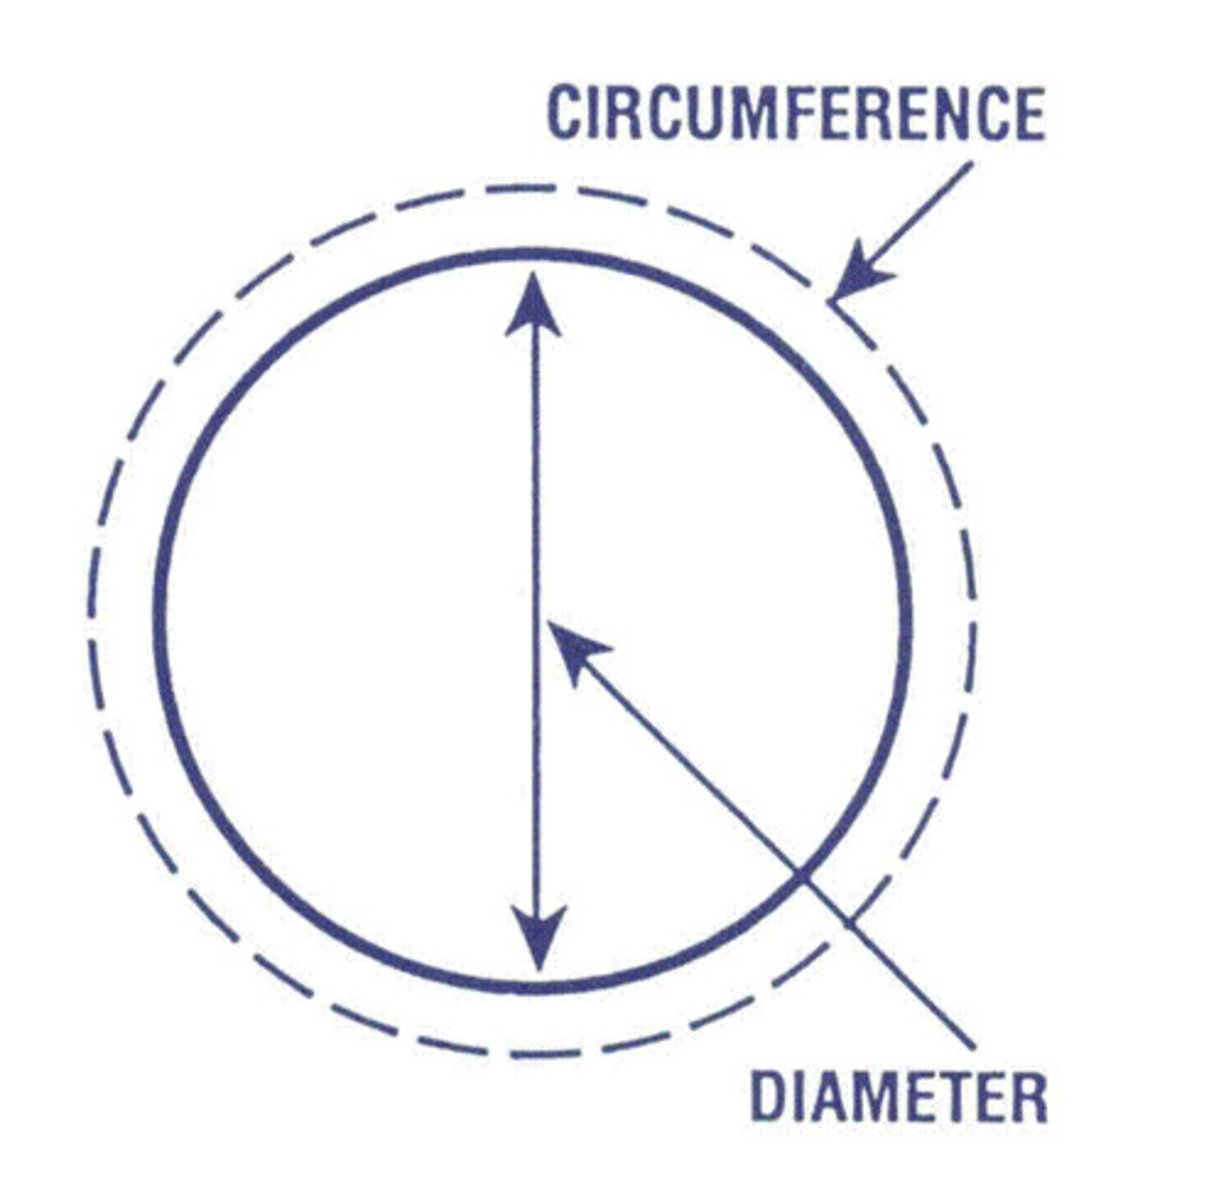
circumference
c=πd (d= diameter)
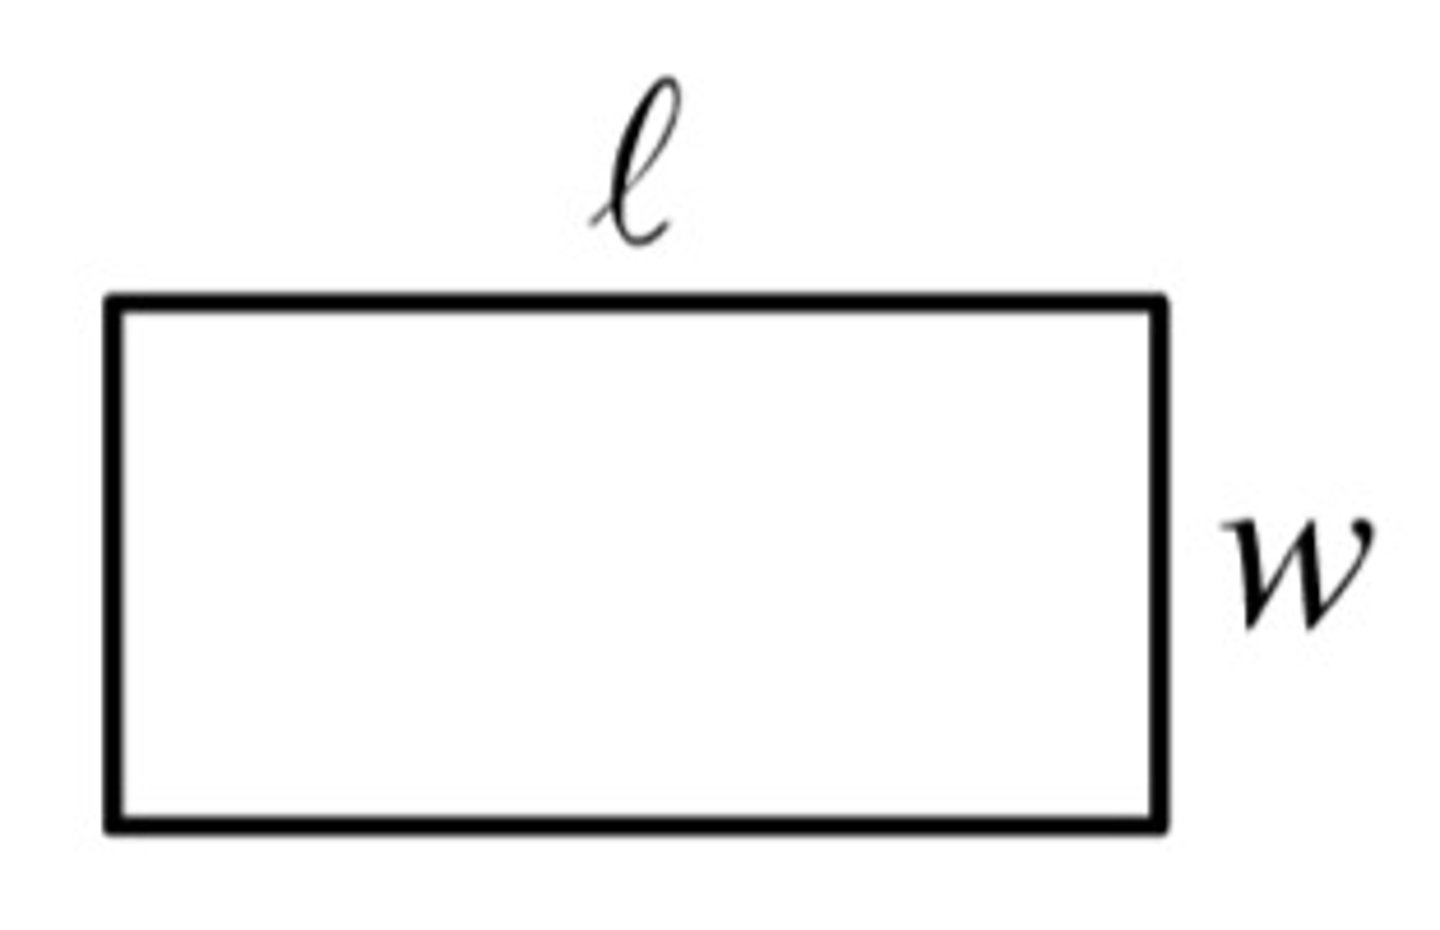
area of a rectangle
A=lw (l=length ; w=width)
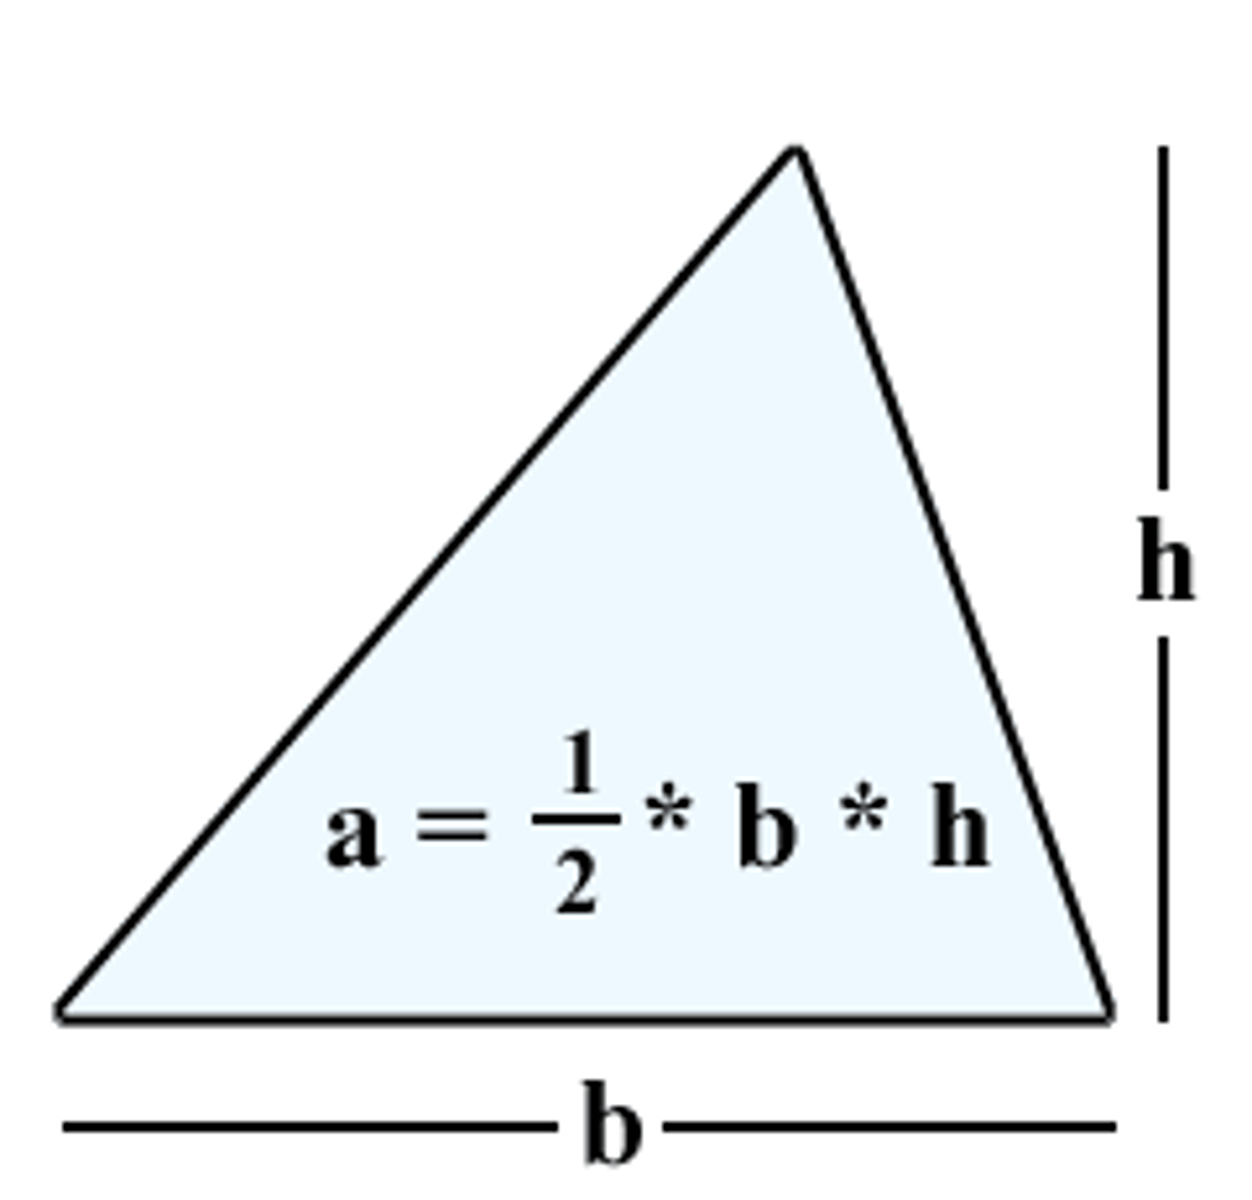
area of a triangle
A=1/2bh (b=base ; h=height)
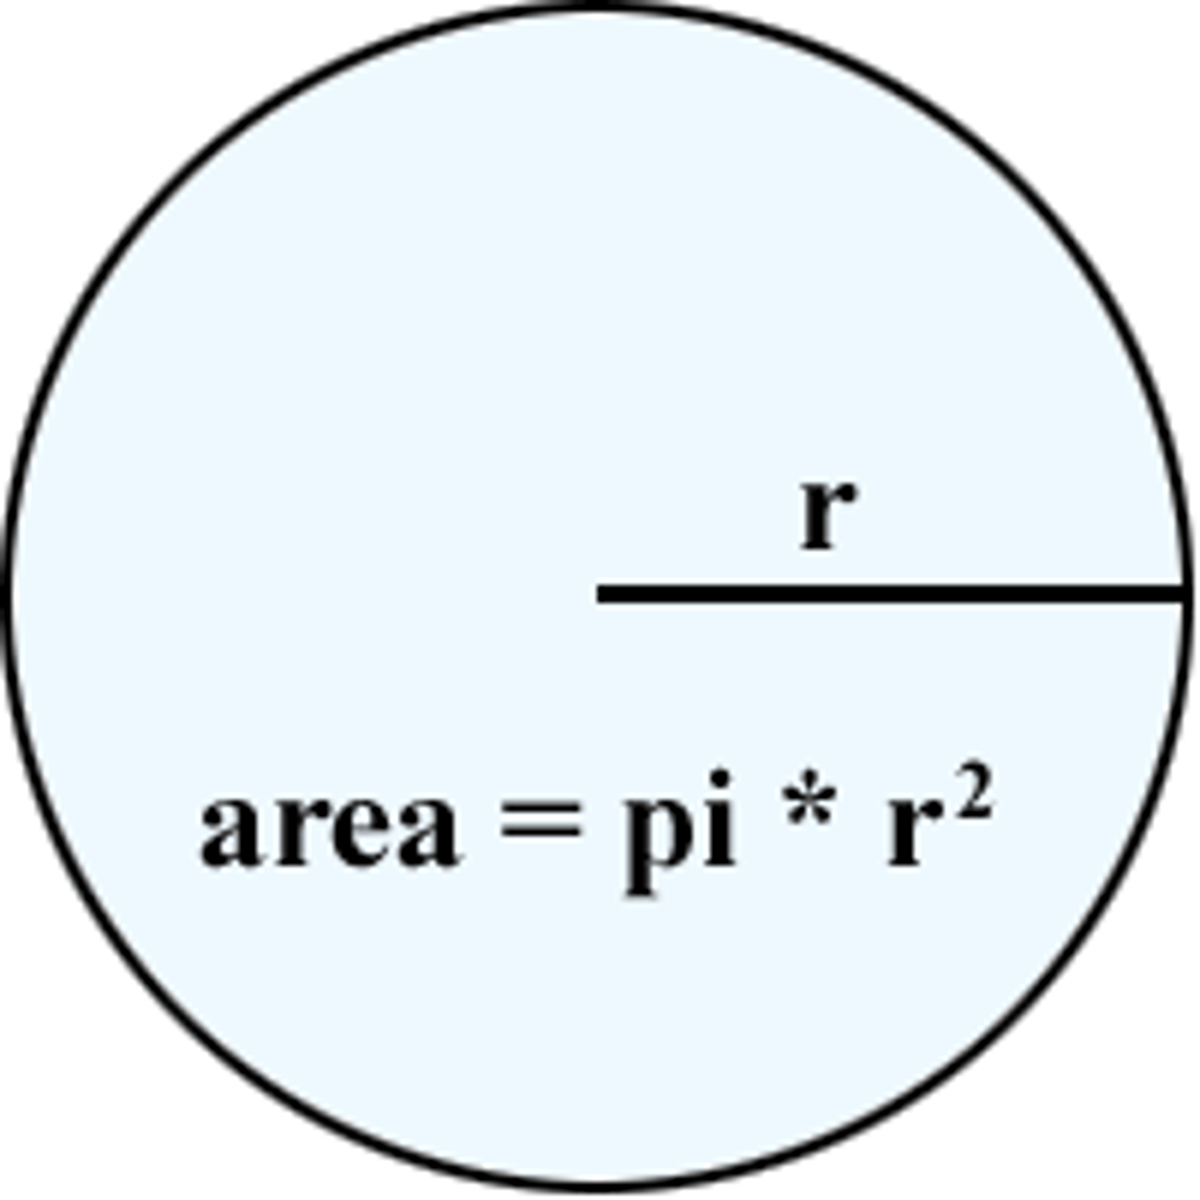
area of a circle
A=πr² (r=radius)
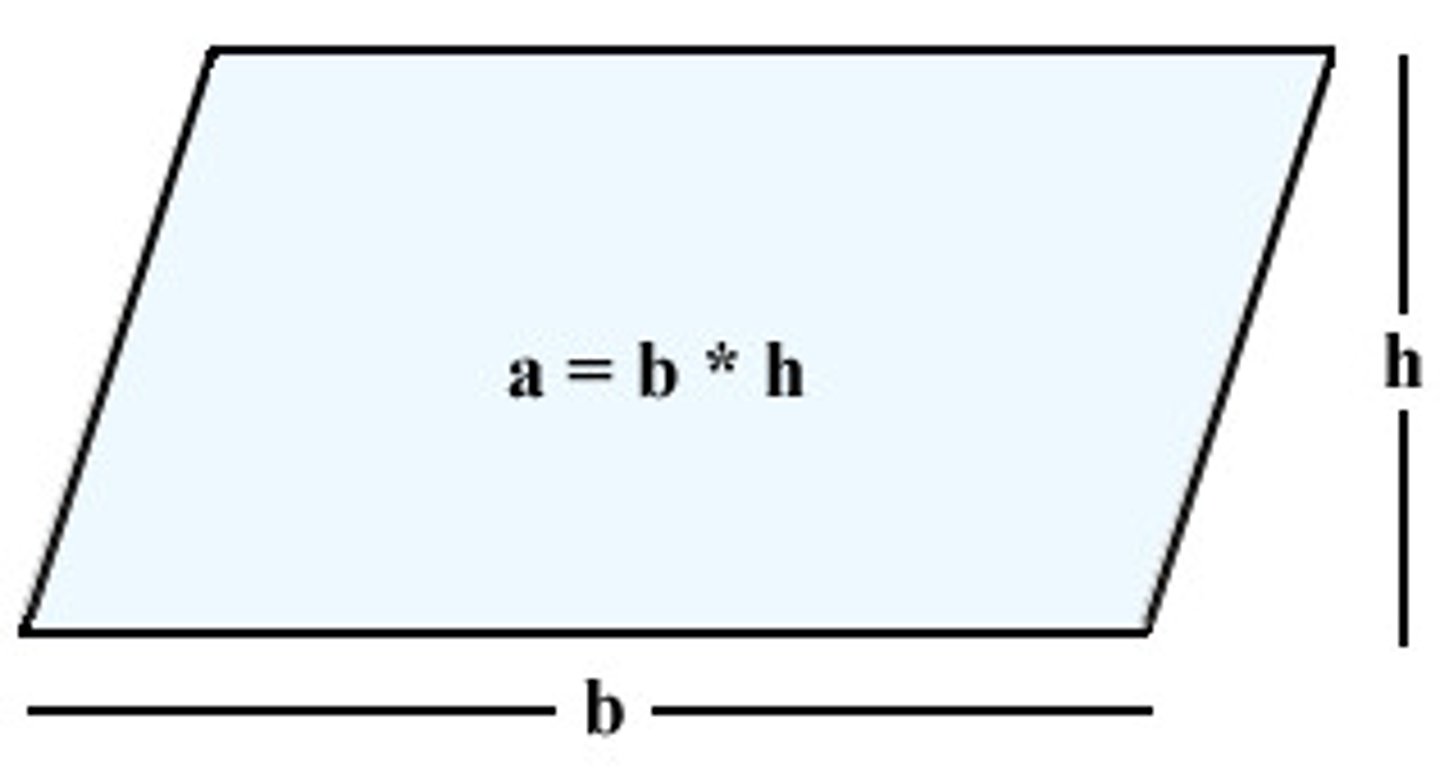
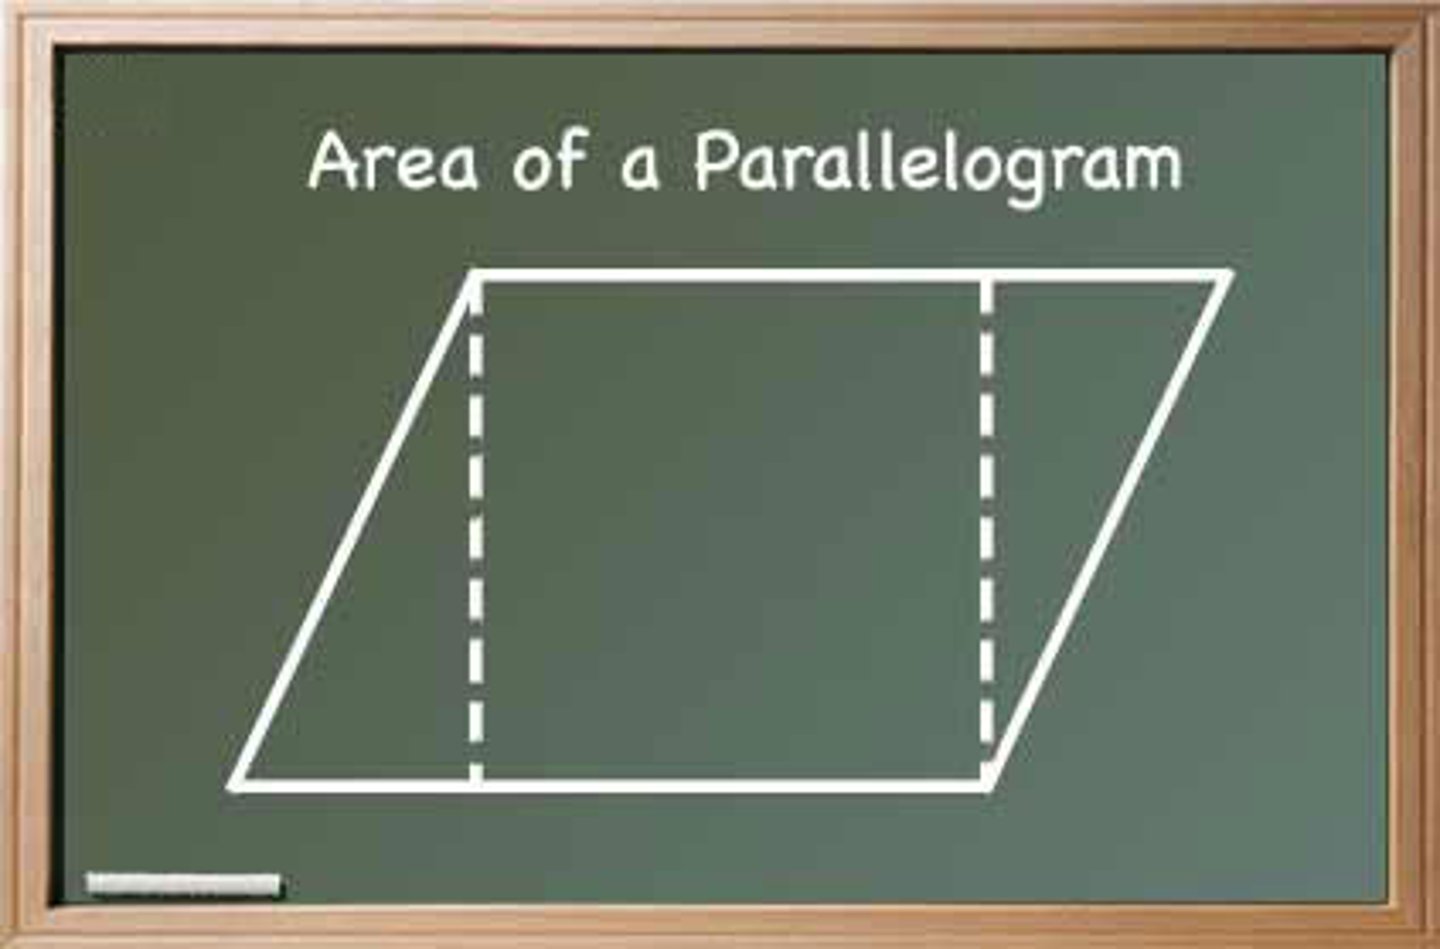
area of a parallelogram
A=bh (b=base ; h=height)
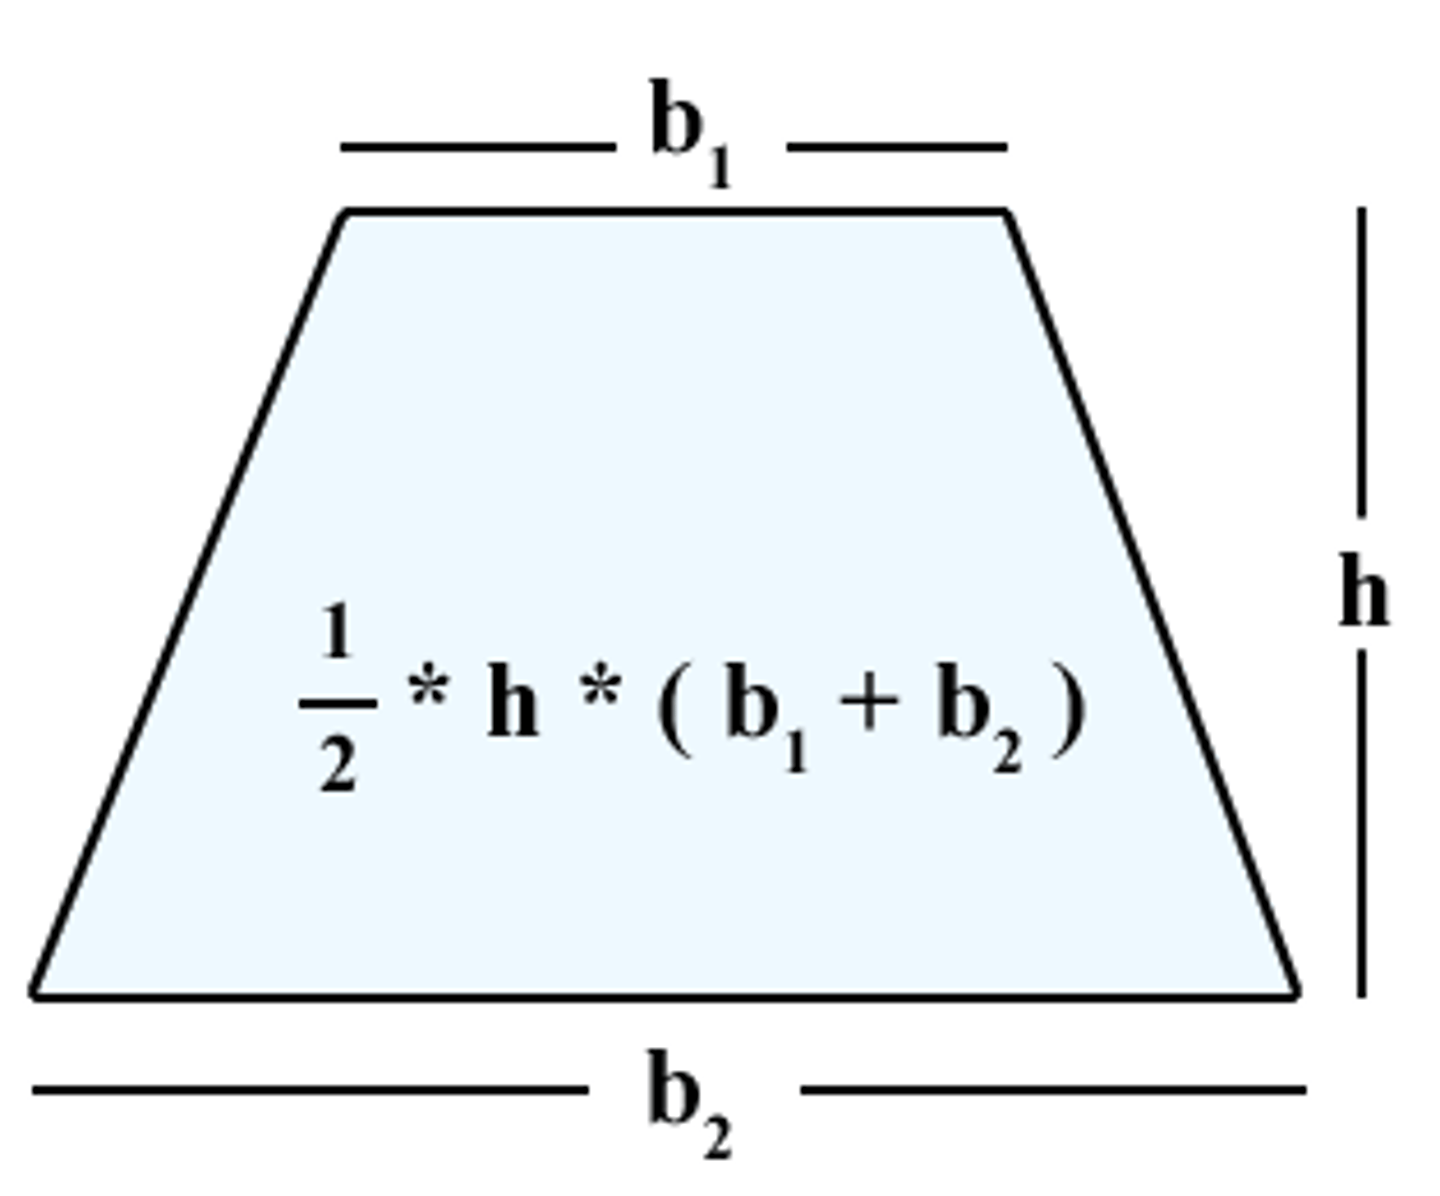
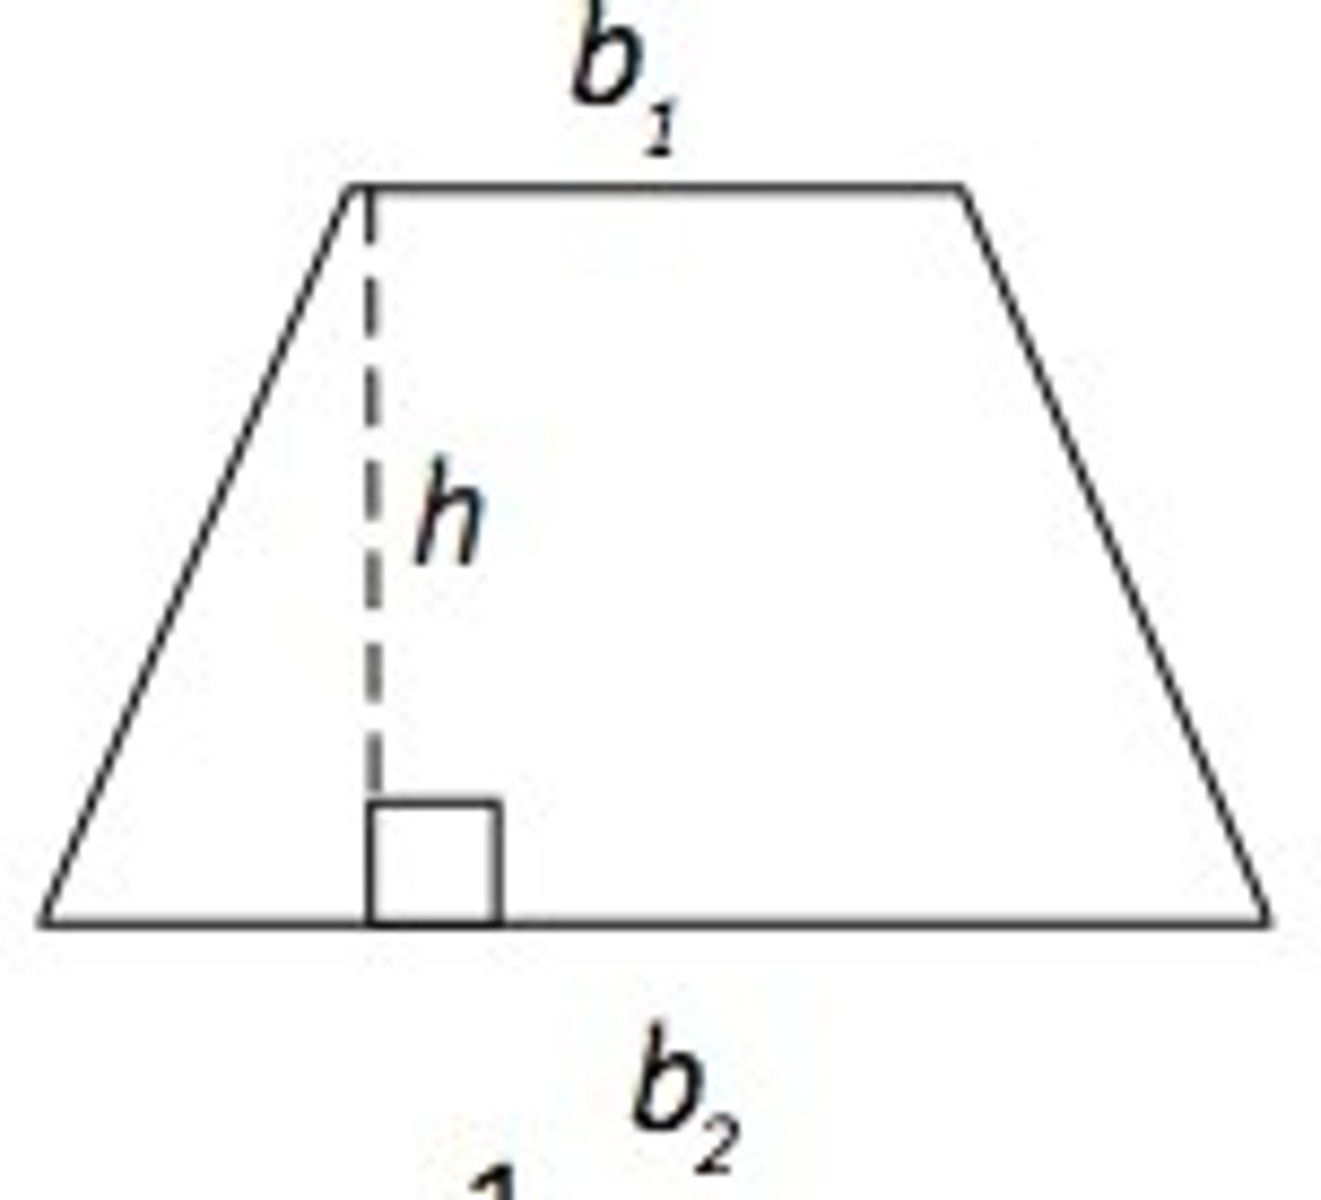
area of a trapezoid
A=1/2h(b1+b2) ((b1= smallest base b2= largest base; h=height)
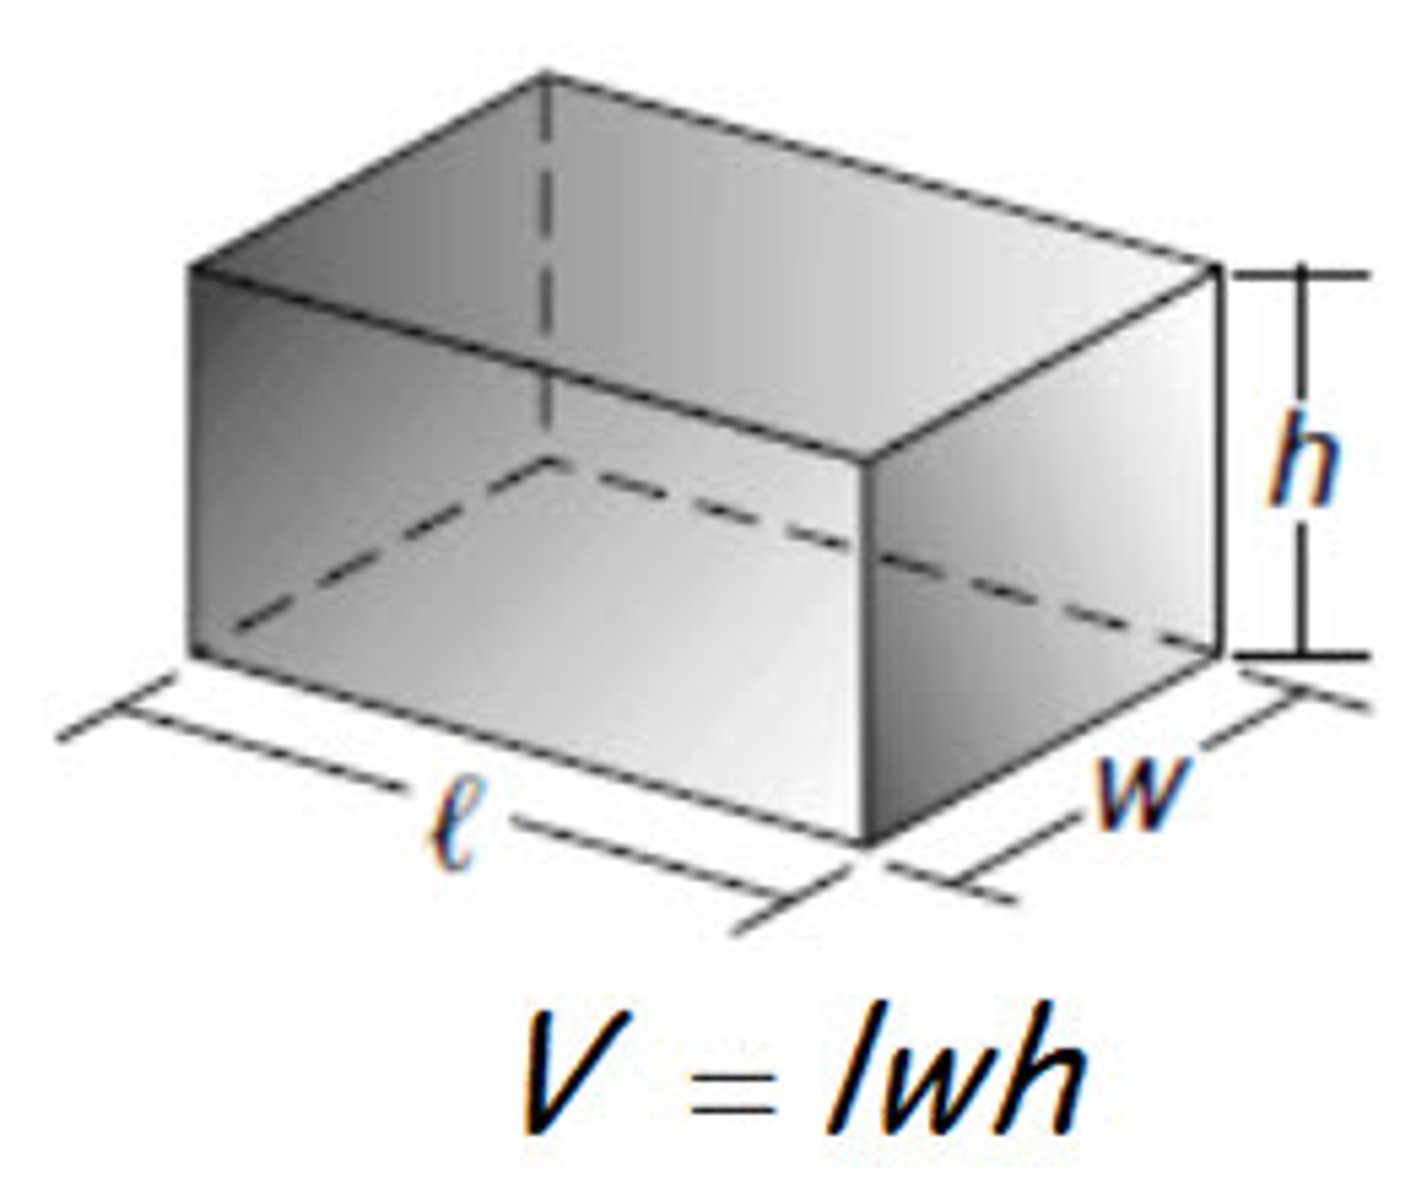
volume of a rectangular prism
V=lwh (l=length ; w=width ; h=height)
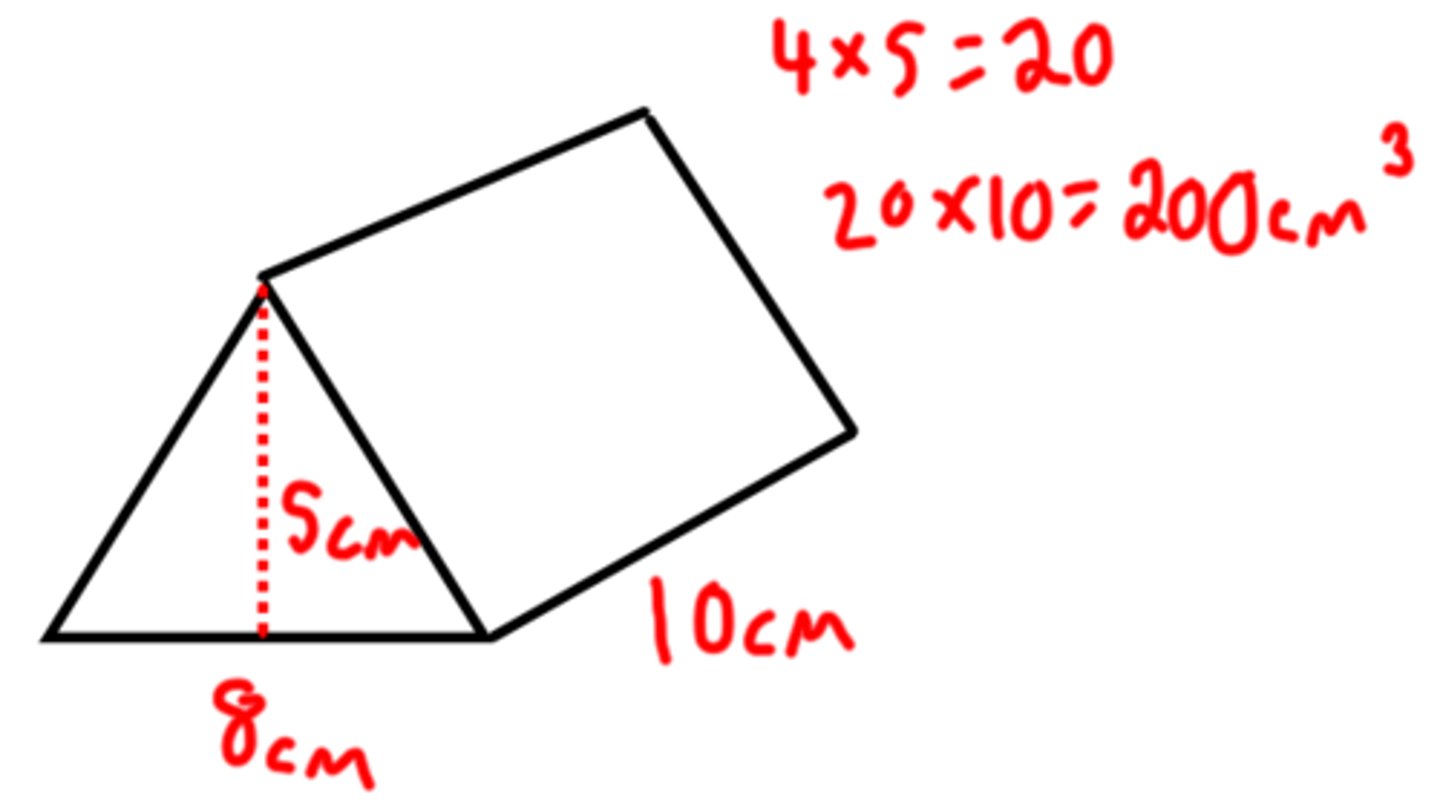
volume of a triangular prism
V=(1/2bh)h
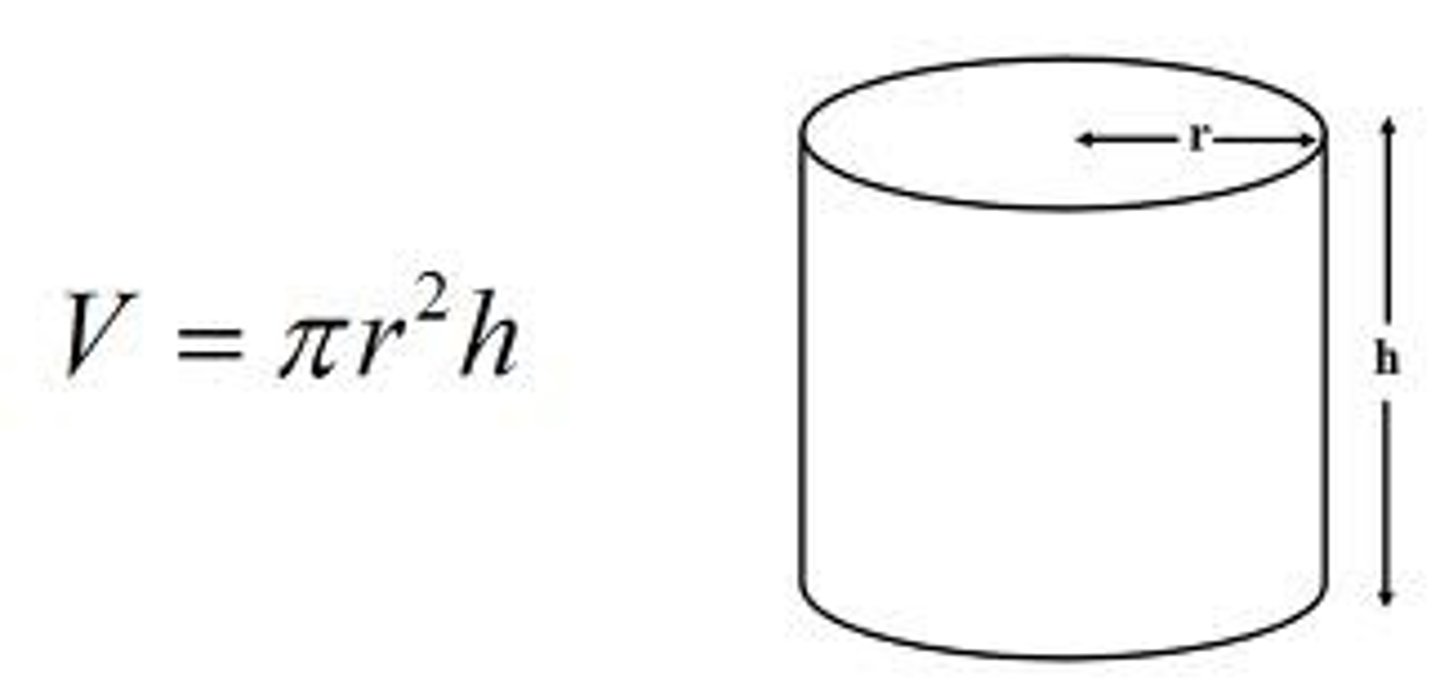
volume of a cylinder
V=πr²h (r= radius ; h= height)
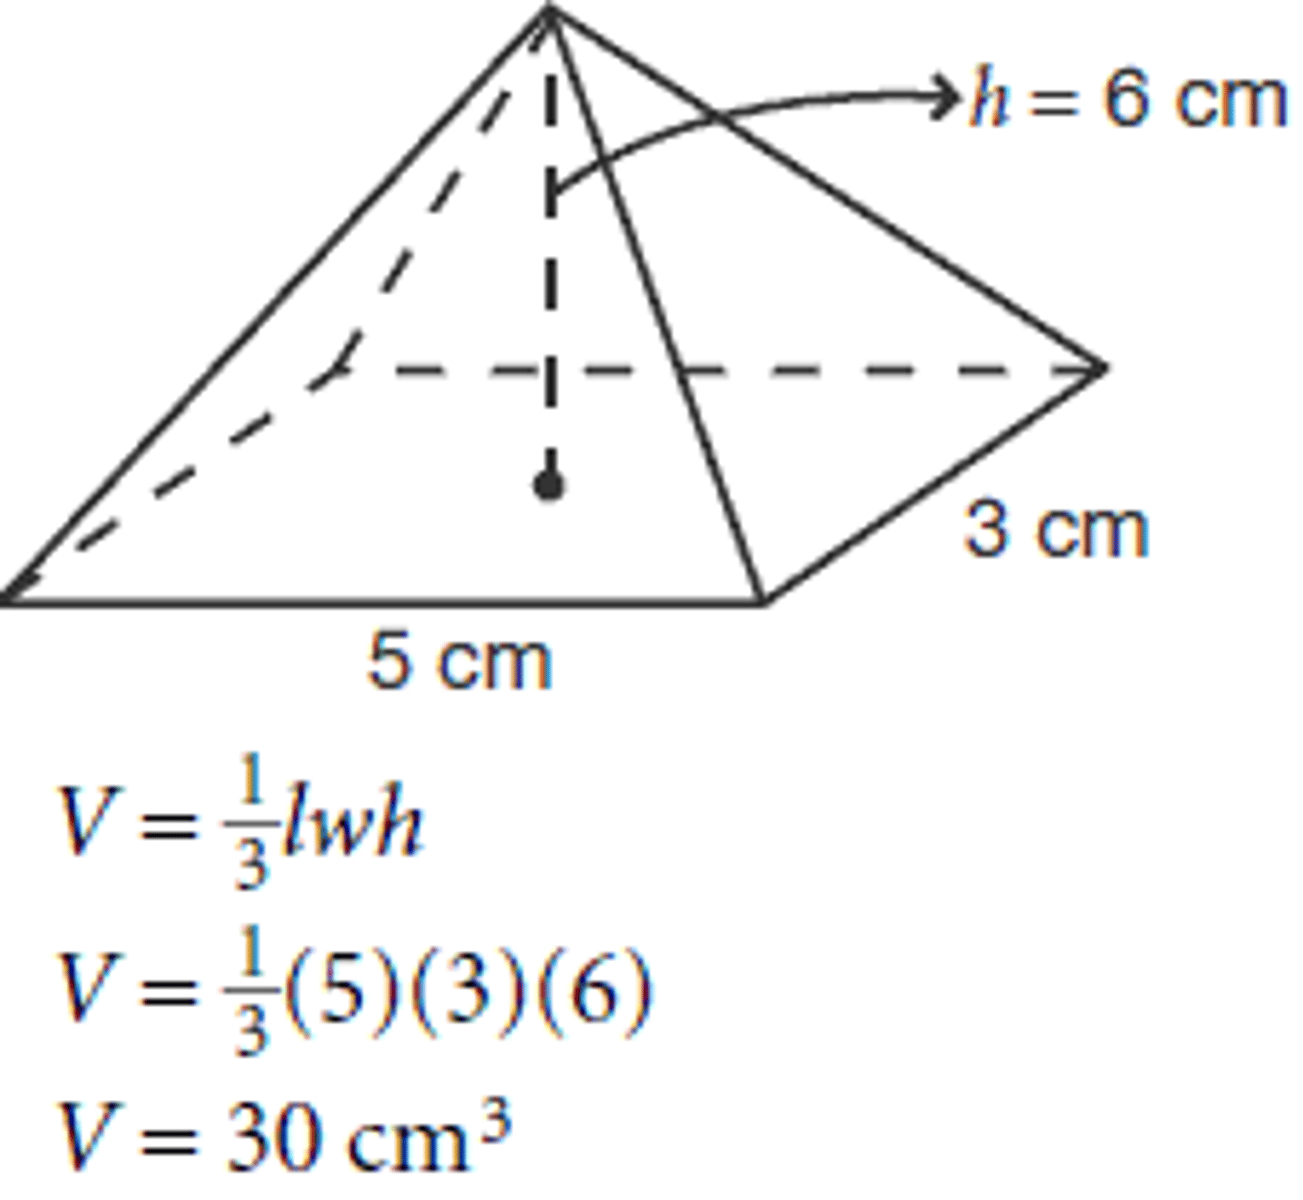
volume of a rectangular pyramid
V=1/3lwh
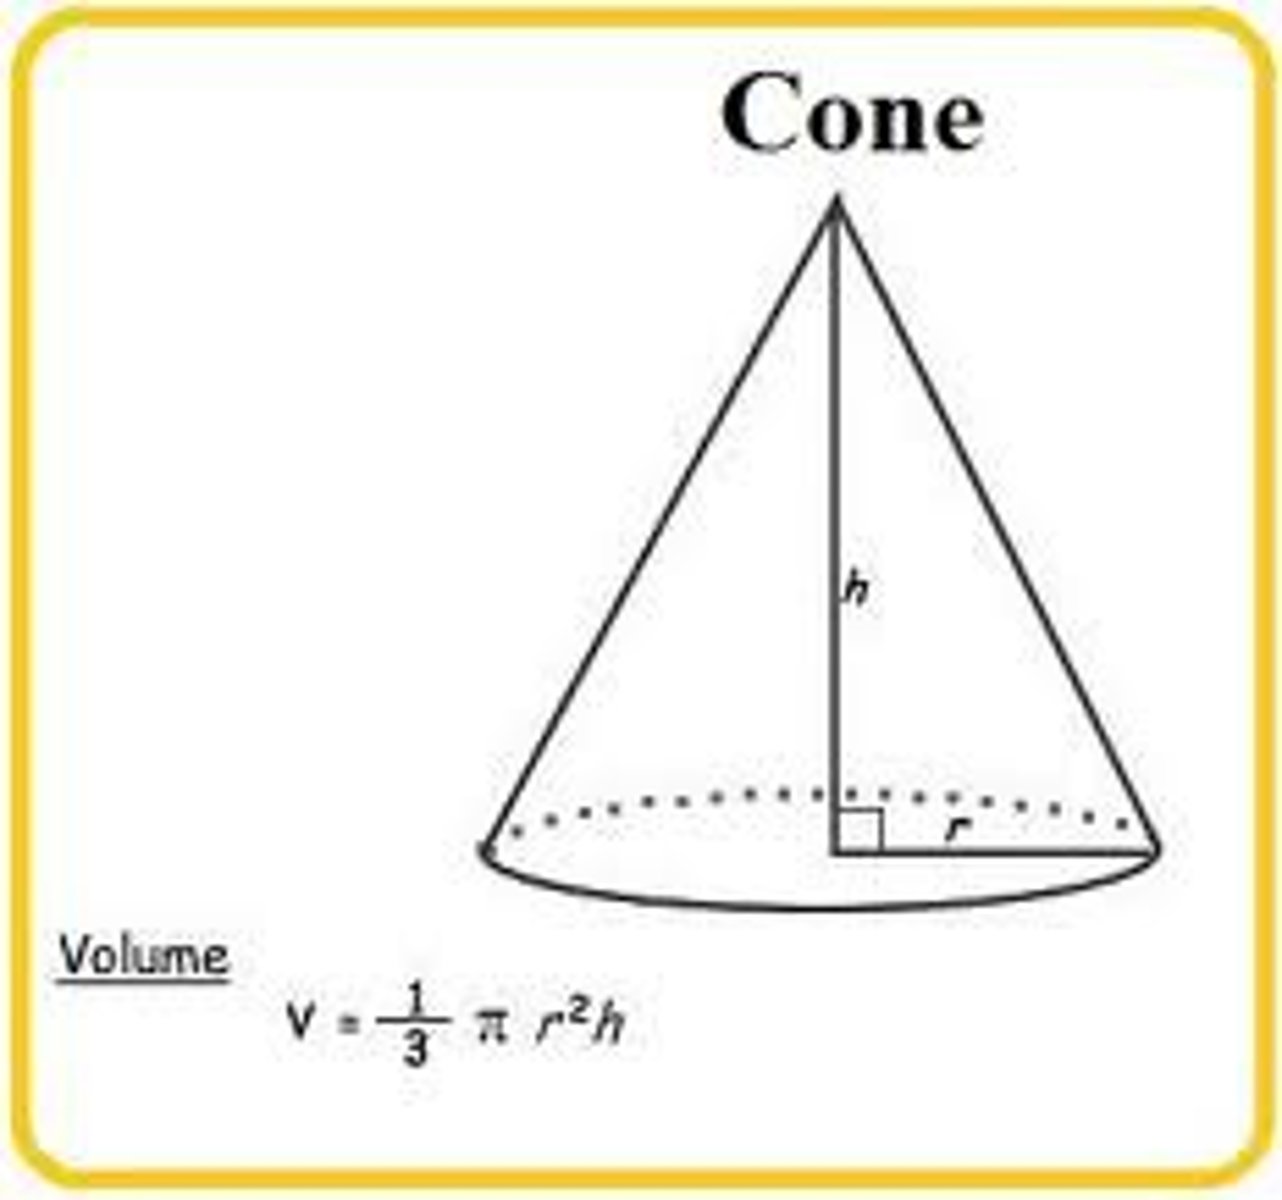
volume of a cone
V=1/3πr²h
Decimal Placement/Converting
- Value greater than 1, Move decimal to right till you get whole number.
- Number becomes numerator and 1 becomes denominator with the number of 0's that matches number of moves for decimal. = Fraction
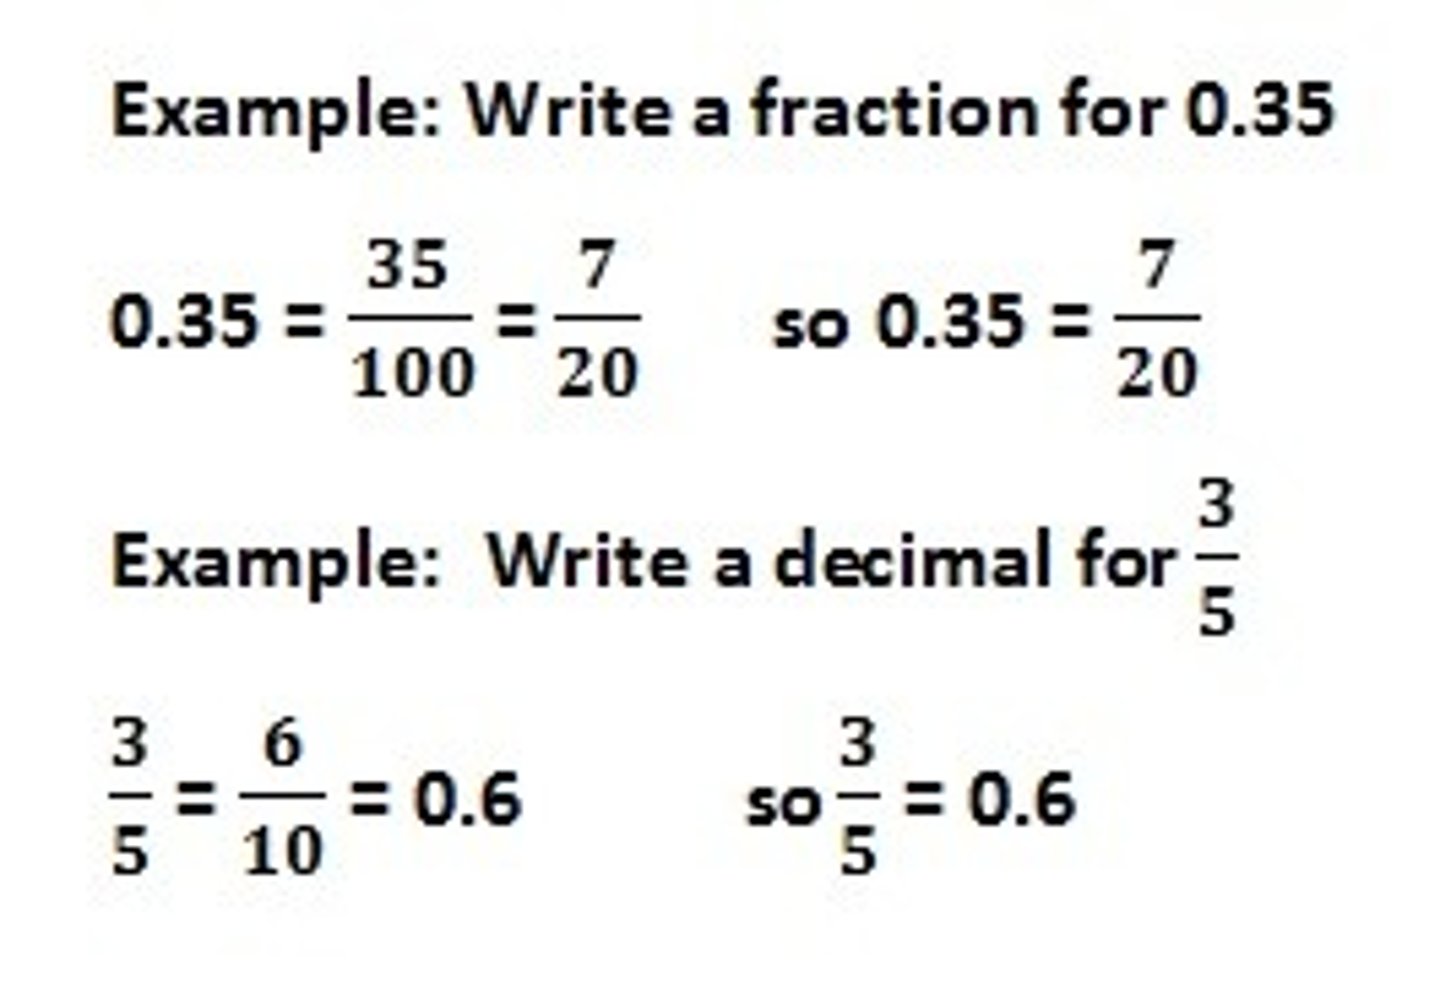
- Value less than 1. Use whole number as numerator and the Place value of last decimal Digit as denominator. =Fraction
Percentage Convert to/from Decimal
TO - Divide % by 100 then remove % symbol
FROM - Multiply by 100 then add % symbol
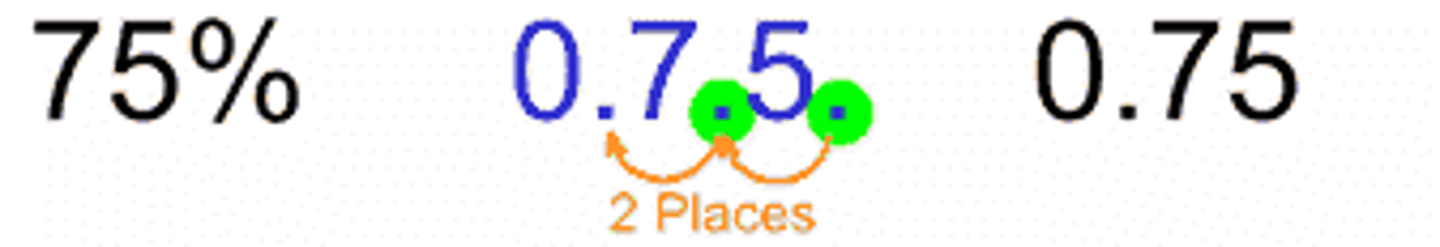
Divide % by 100
How do you convert a percent into a decimal?
Percentage Convert to/from Fraction
TO - Convert to decimal first (divide by 100) then put into simplest form
FROM - Convert to decimal (multiply to get 100 in denominator then divide by denominator) then put decimal into %
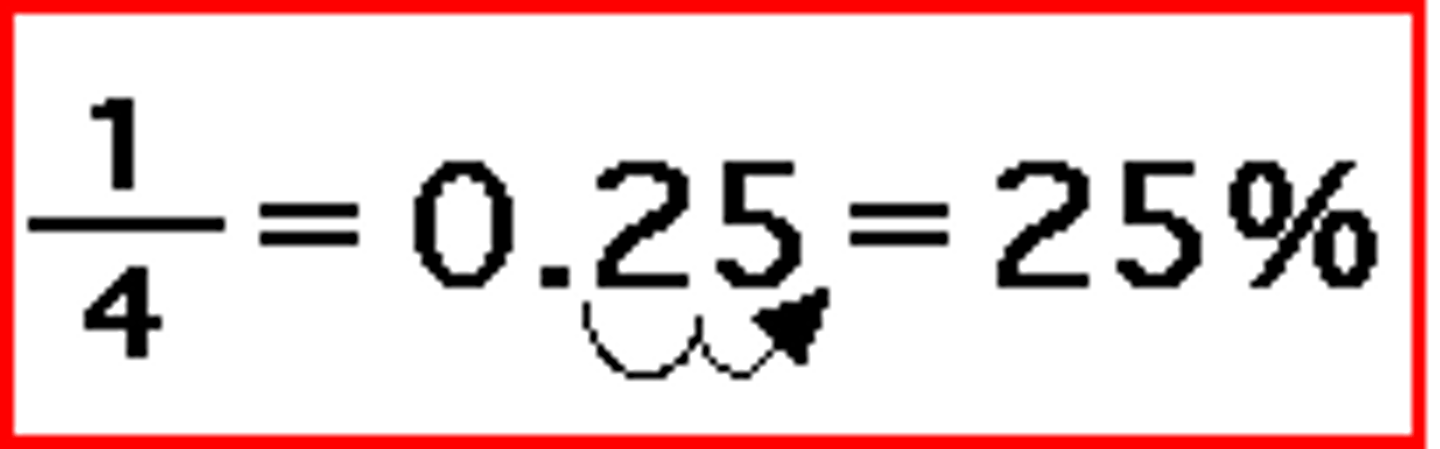
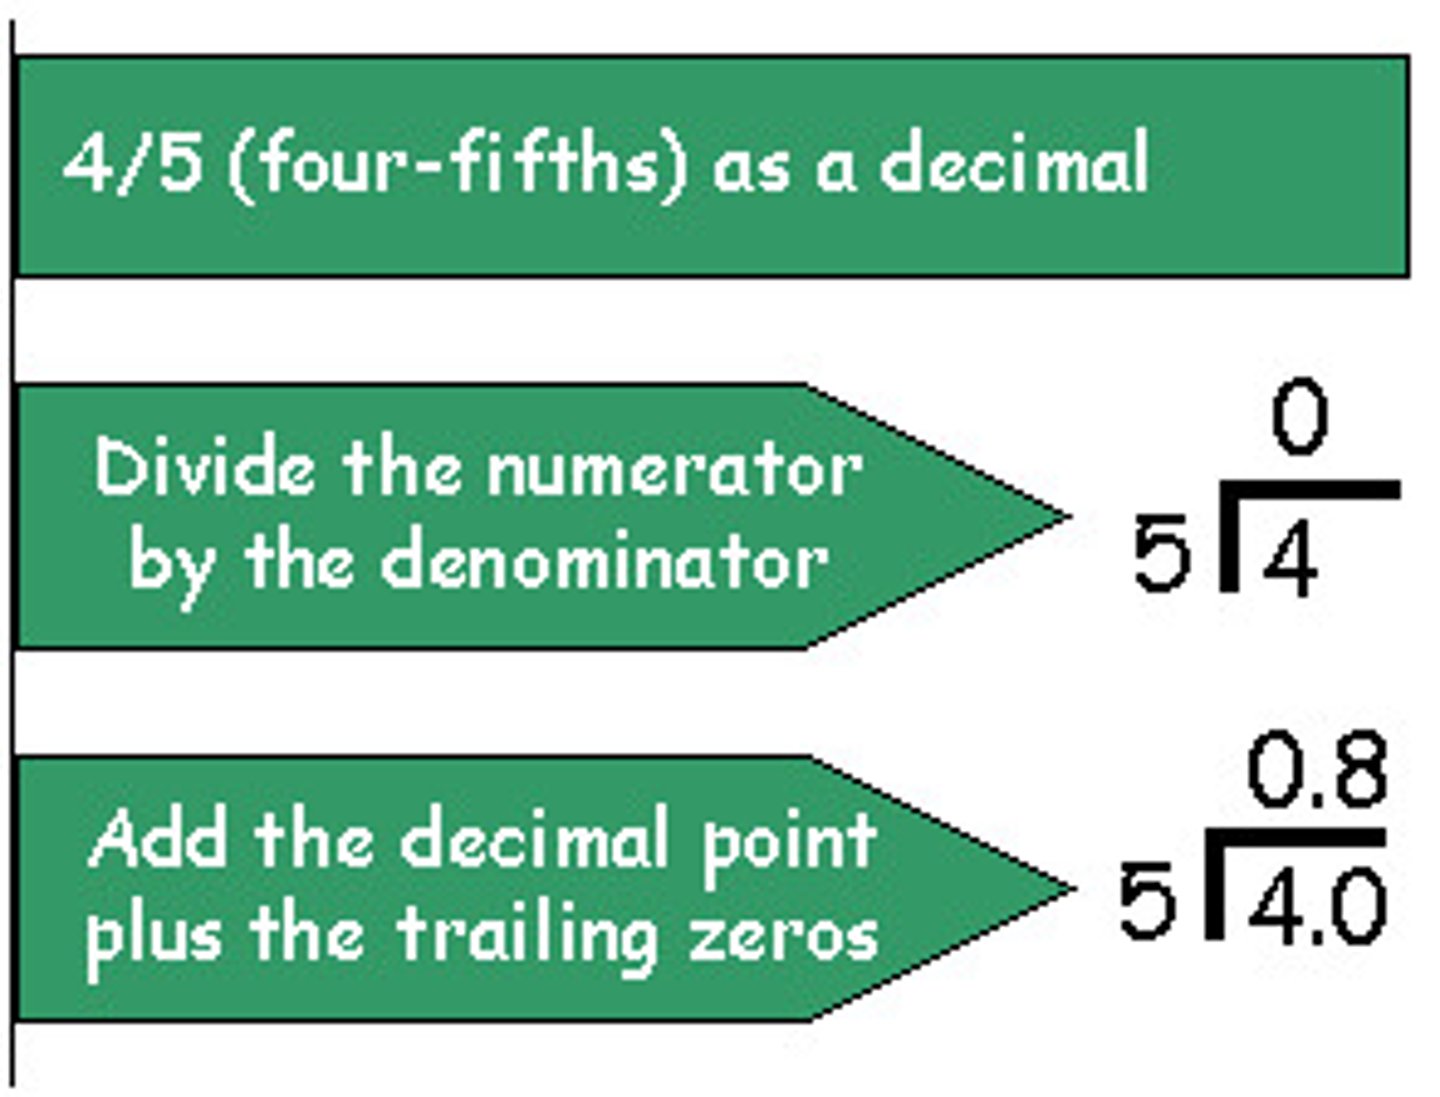
Fraction Convert to Decimal
Divide numerator by denominator
Compare and Order Rational Numbers
-Rational Numbers: -6 (-6/1), 5 (5/1), 100 (100/1)
-Irrational Numbers: Square root (any prime number), pi
-Numeric Order: Least to Greatest, Greatest to Least. Best in decimal form. Line them up vertically.
-Fraction/Fraction Form: 5 2/7 (put into decimal) Divide 2 by 7 to get .2857 which will equal 5.2857
<, _<_
Less than, IS fewer than
Less than or equal to, is at most, is no more than
>, _>_
Greater than, IS more than
Greater than or equal to, is at least, is no less than
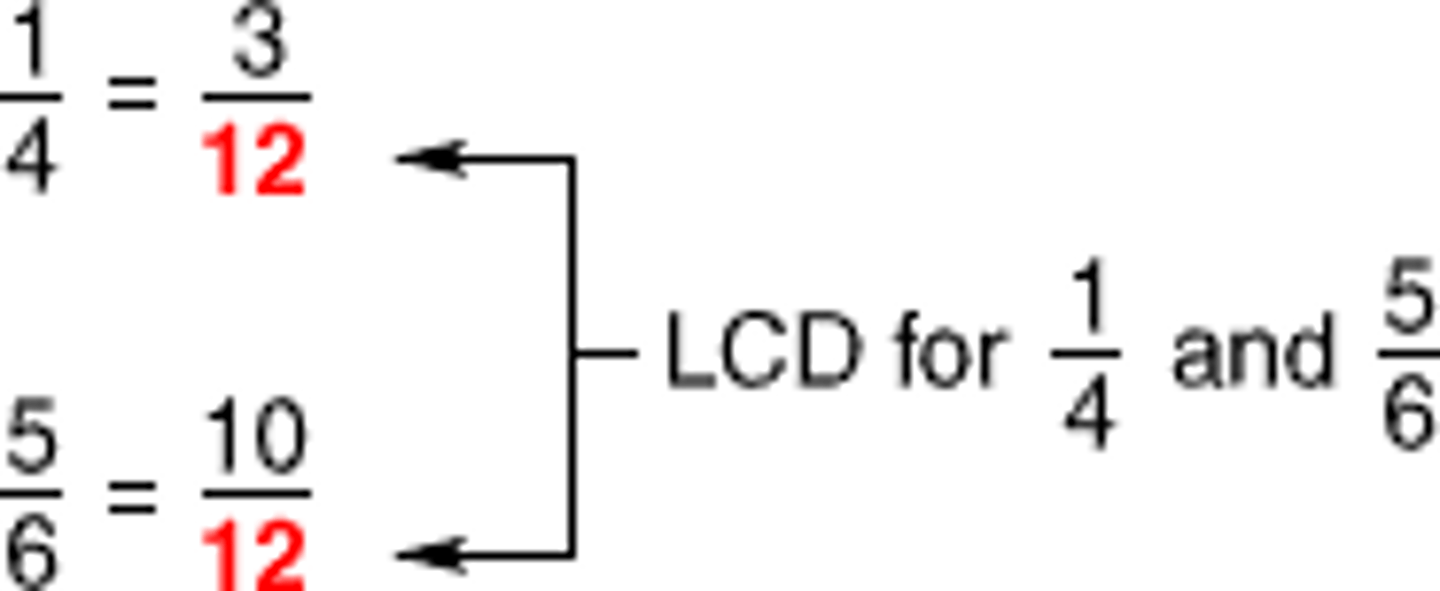
Common Denominator
1. Find least on on multiple of denominator
2. Change each fraction to make their denominator the same as least common denominator
~List multiples of each denominator and find SMALLEST number
~Multiply numerator by multiple of LCD, Use LCD as denominator
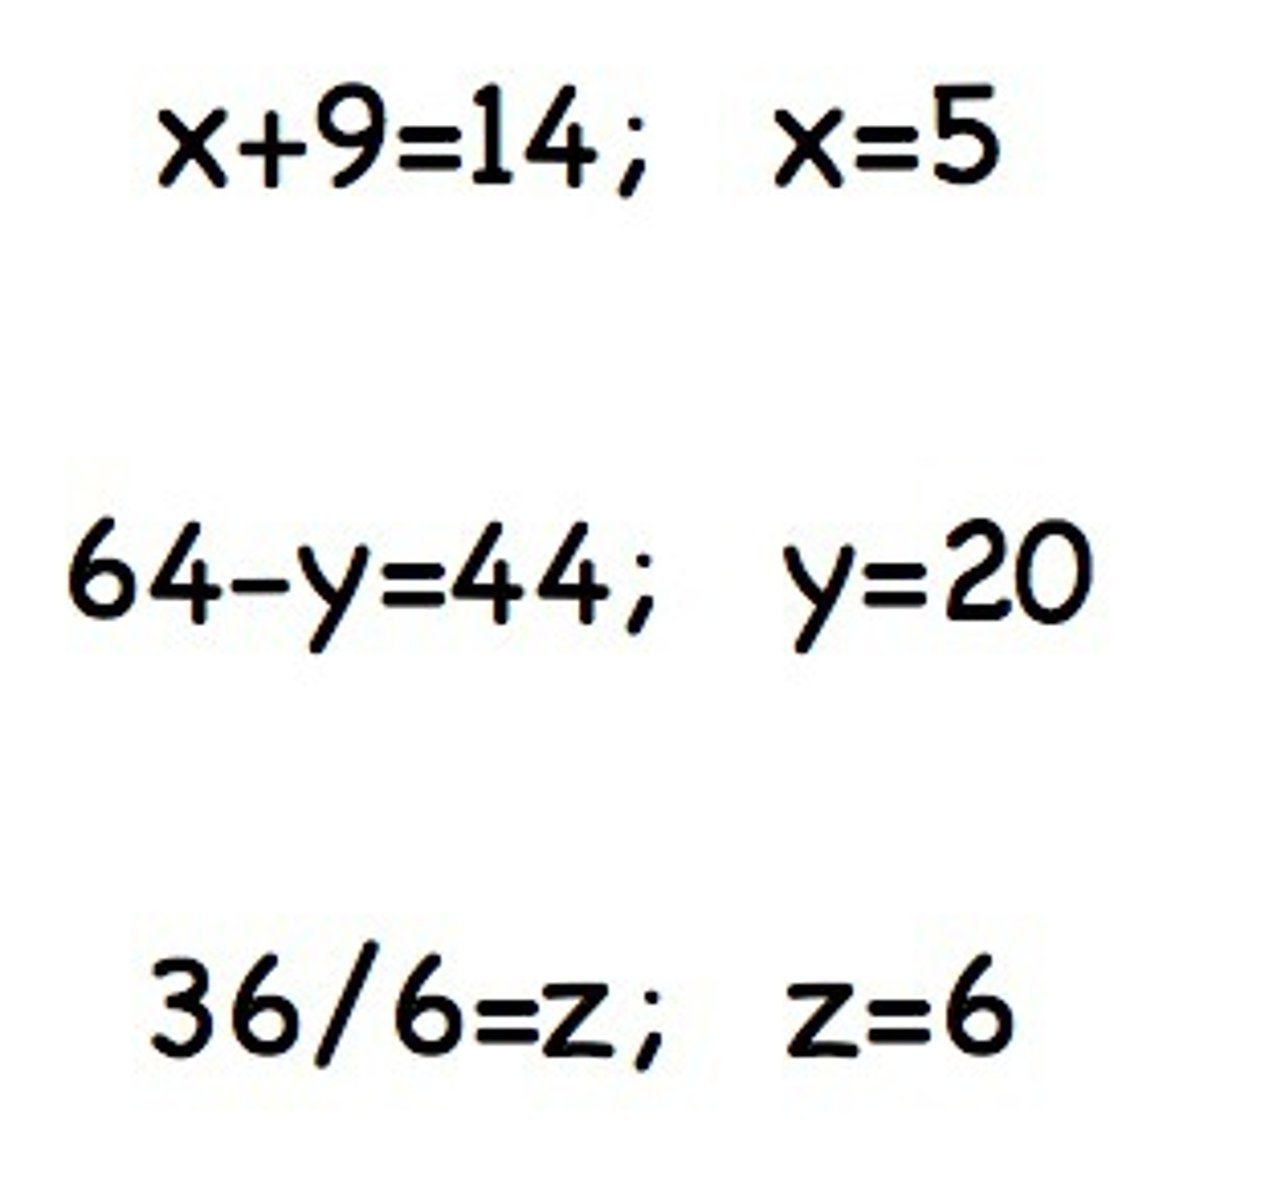
Solve Equations in One Variable
Collecting all variable terms to one side of the equal sign and all the constants on the other side, using addition or subtraction. Once all like terms are combined, last step is to divide. Could also be multiplication by the reciprocal ( One divided by original number).
Extraneous
Incorrect
Story that is interesting containing details that aren't necessary to tell you what happened.
Erroneous
Irrelevant
Story might contain conflicting accounts of what happened due to having multiple observers.
Terms Related to Operations
Sum (+) , Difference (-) , Product (x) , Quotient ( / ) , Per 100 (#% _<_ 100%), Is or Of (#% _>_ 100%)
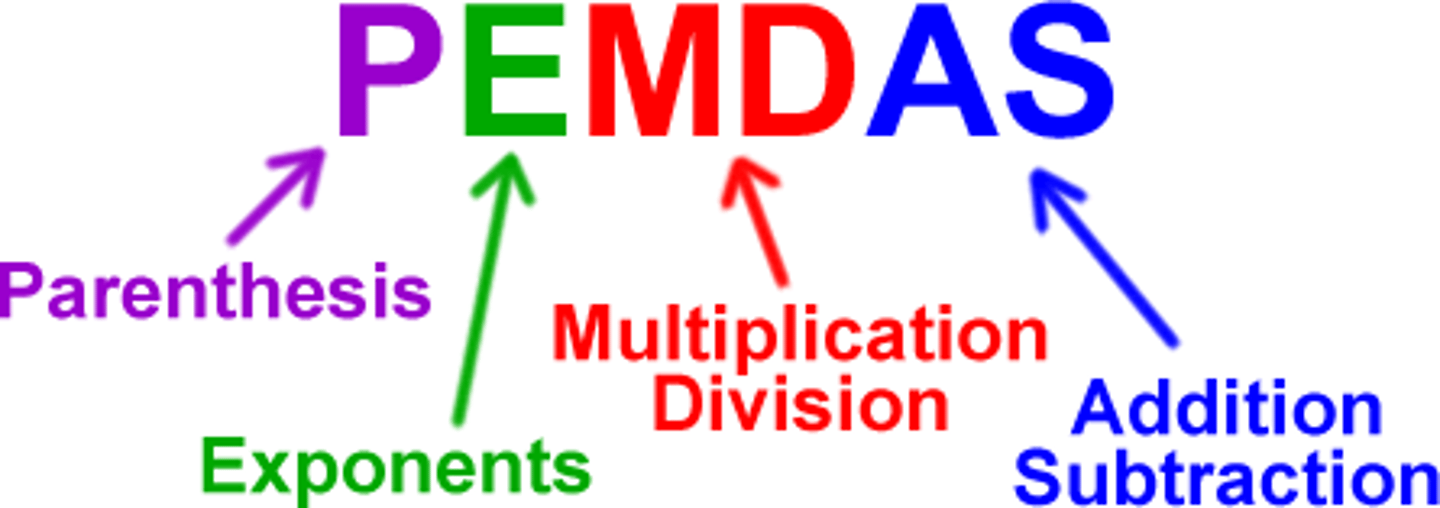
Order of Operations
-PEMDAS
-Parentheses FIRST
-Multiplication and Division SECOND (Left to Right)
-Addition and Subtraction THIRD (Left to Right)
=
Equal, equal to, is, was, were, will be, yields, becomes
Rational Numbers can be represented by?
By fractions
Includes: Whole Numbers, Positives/Negatives, Zero, and all decimals that either terminate or repeat.
~Irrational numbers will not concern us at this point
Percent Increase Equation
- Percent Increase
~ PI= new amount - original amount/ original amount X 100%
Percent Decrease Equation
PD = original amount - new amount/ original amount X 100%
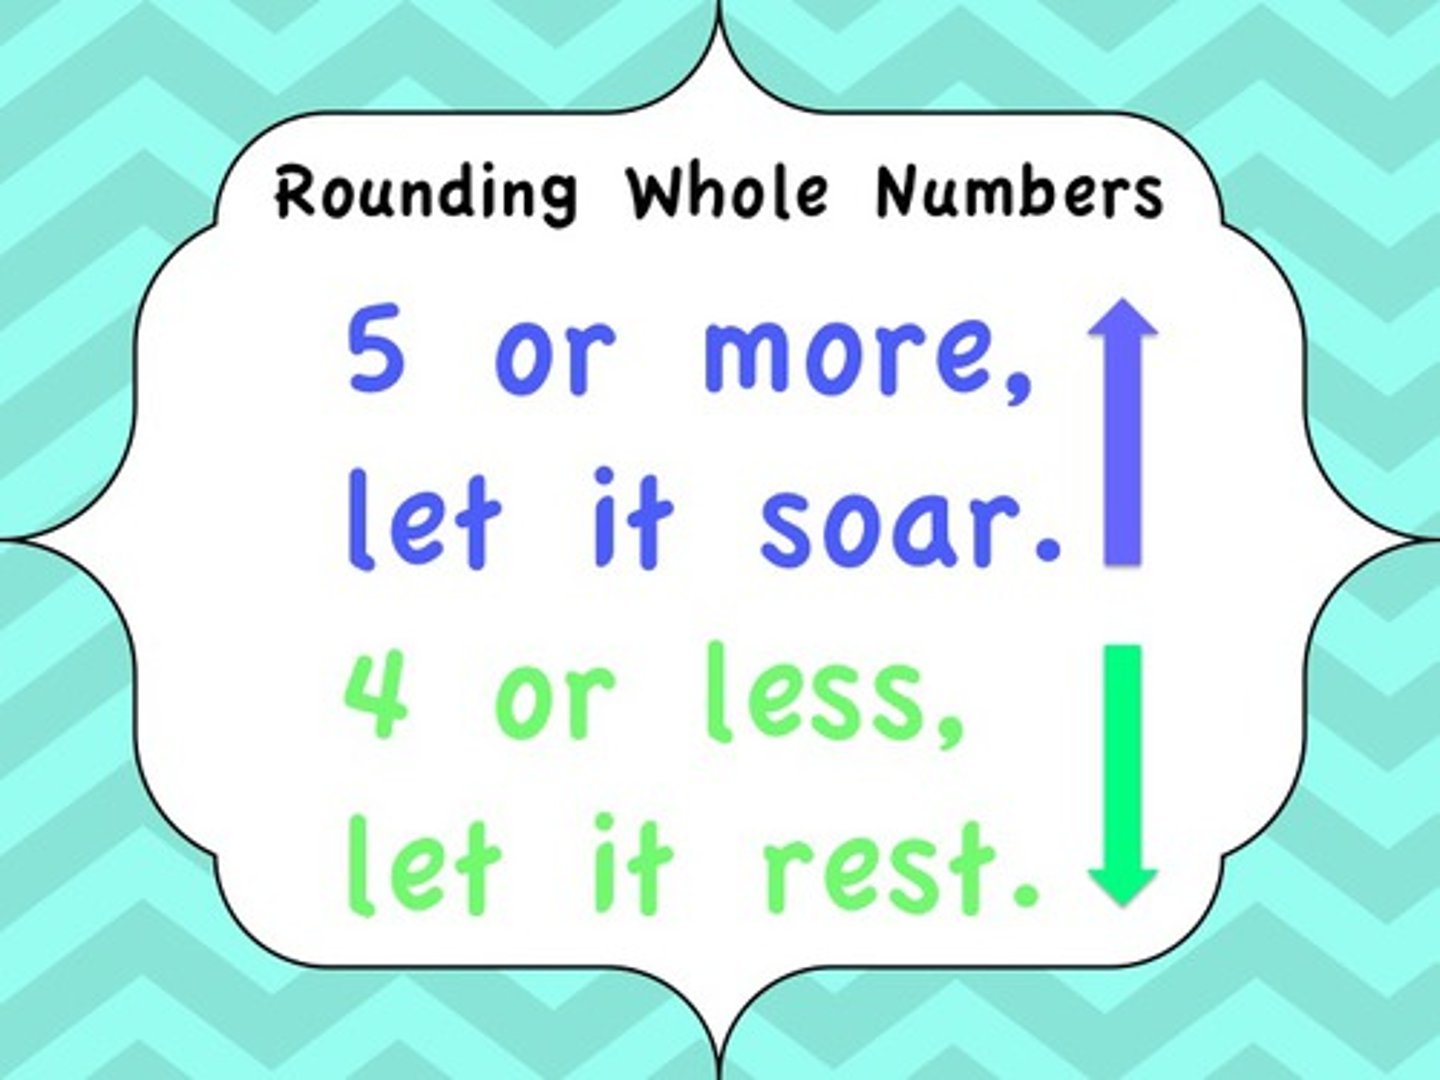
Rounding Rules
- 5 or LARGER, round UP (decimals)
- 5 or SMALLER, Round DOWN (decimals)
- Numerator is GREATER THAN OR EQUAL TO 1/2 the denominator, then round whole # UP
- Numerator is LESS THAN OR EQUAL TO 1/2 the denominator, then round whole # DOWN
Proportions
Ratio in fraction form set equal to another ratio in fraction form.
~Example:
50mi/1cm = X/12.6cm (cross multiply) -> 50mix12.6cm/1cm=Xx12.6cm/12.6cm (cancel out 12.6cm on Num. and Den.) -> 50mix12.6cm/1cm (cancel out cm) = X -> 630mi = X
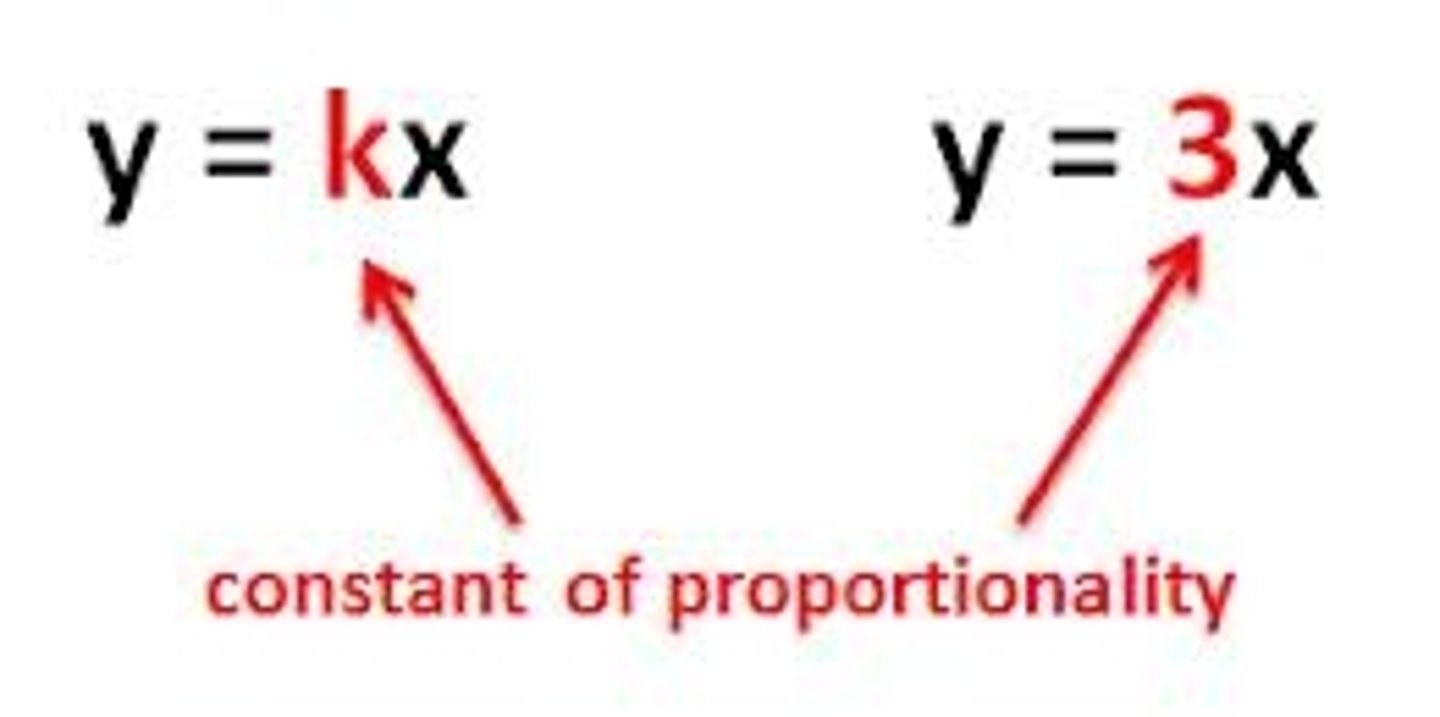
Constant of Proportionality
Also known as Rate of Change
Ratio between two quantities
~Y=k*x (k is constant, y and X are direct proportion)
~One variable is always the product of the other and a constant, the two are said to be directly proportional.
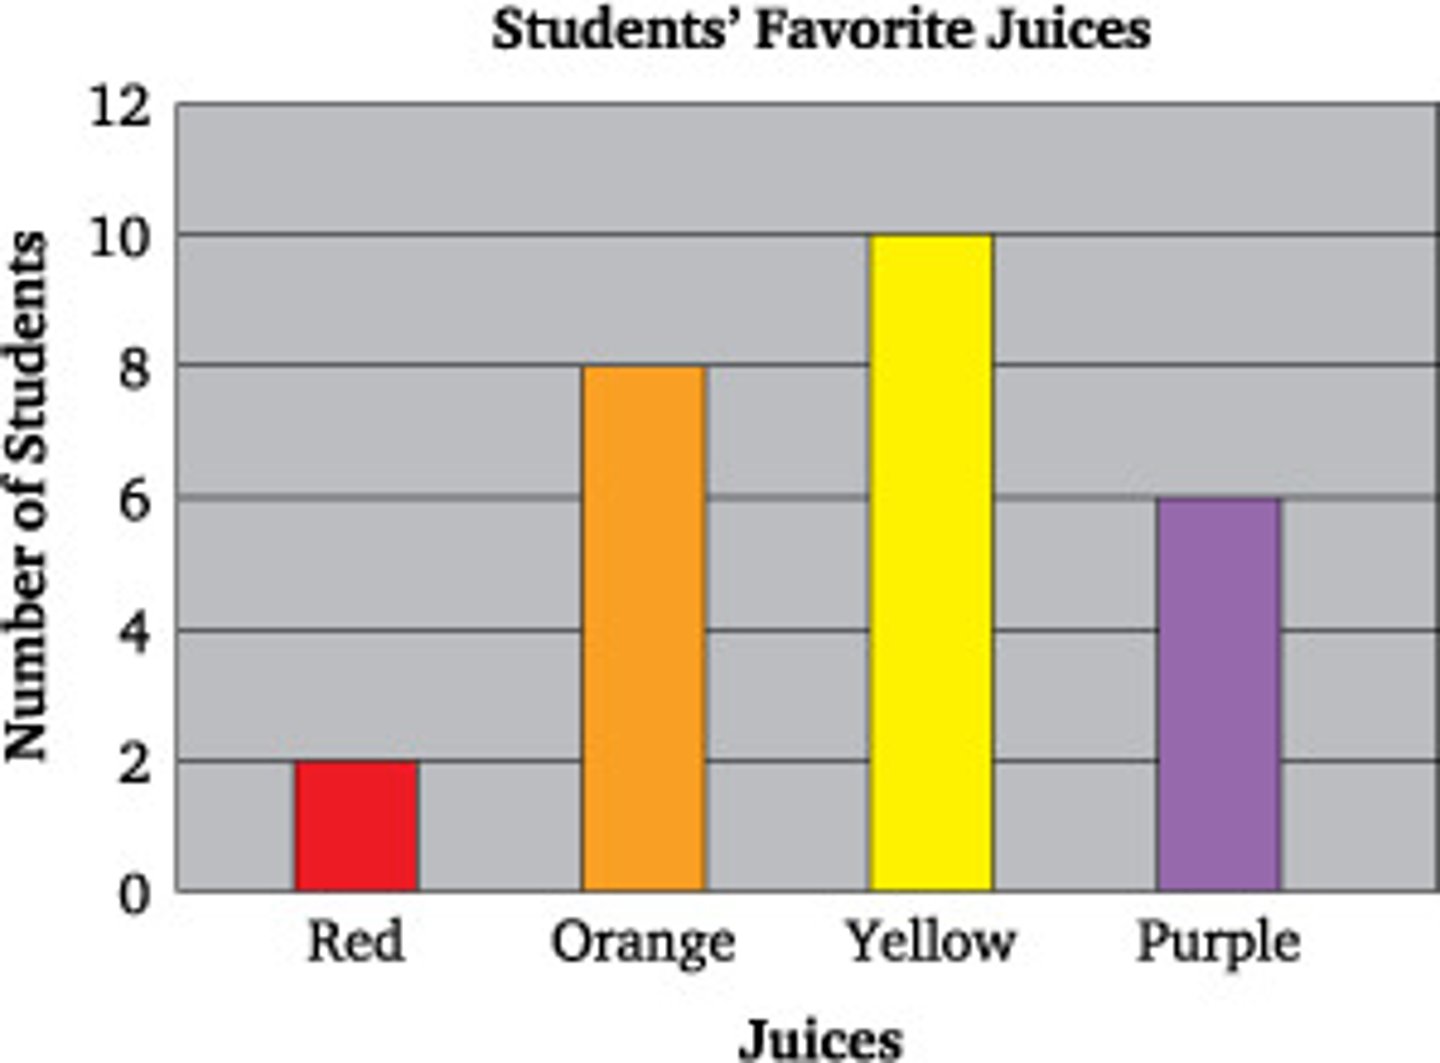
Bar Graph
Which graph is used to compare data (has scale)?
Area
What is the amount of space inside a 2 dimensional shape
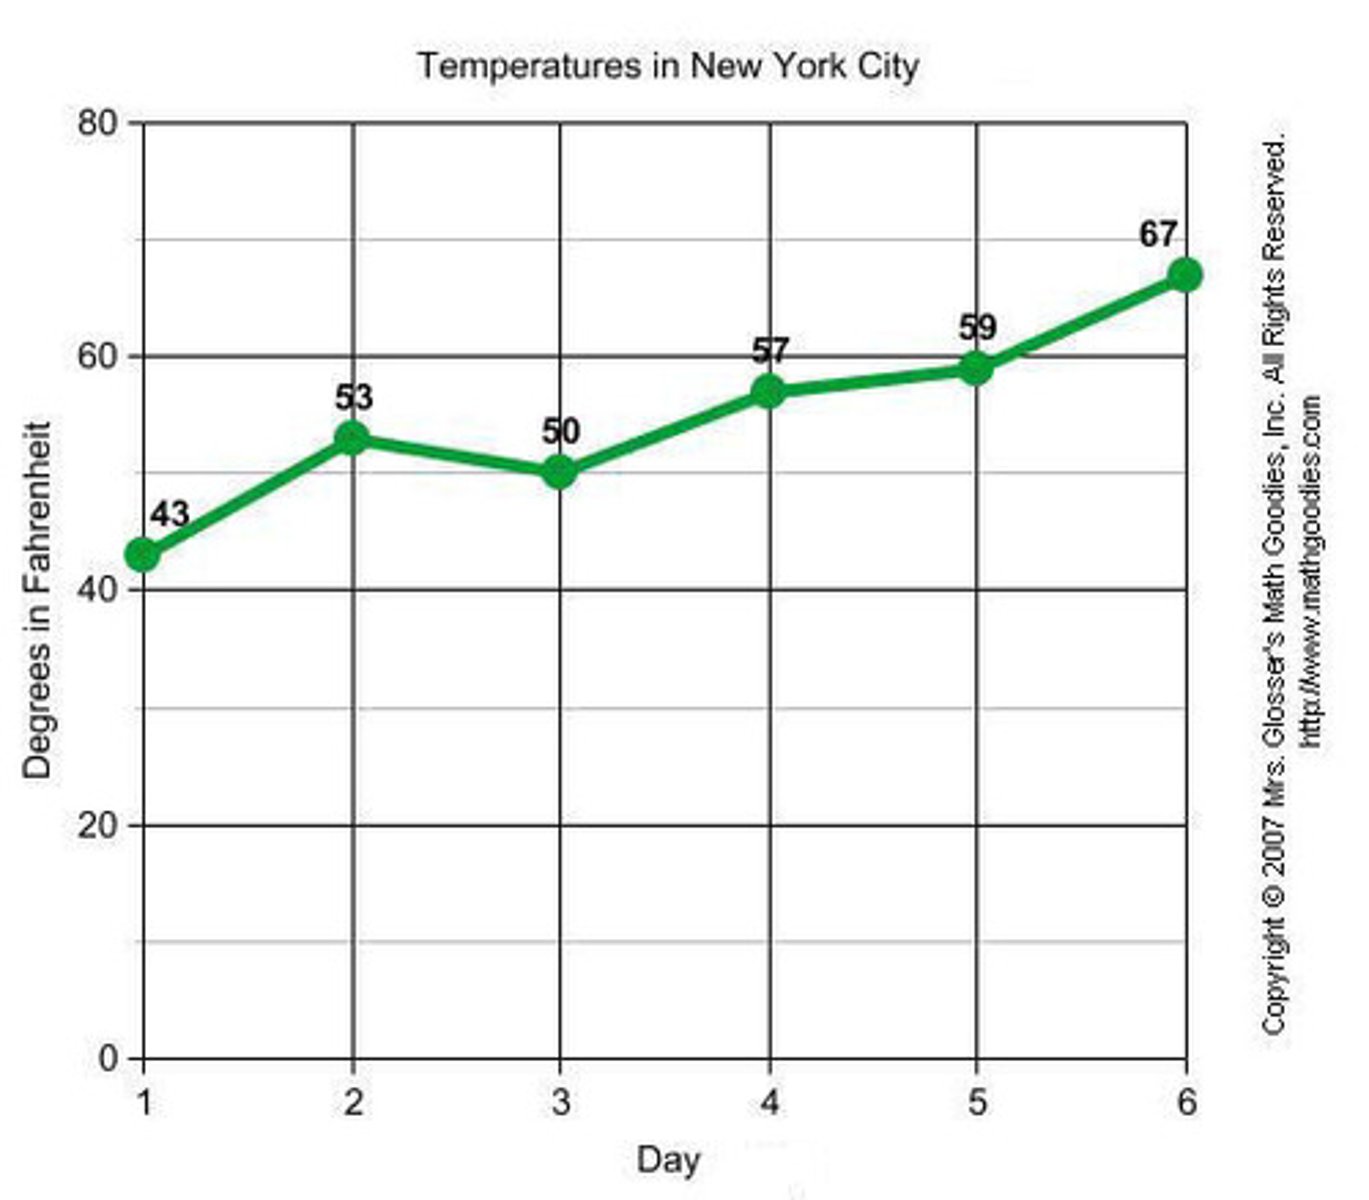
Line Graph
Which graph is used to show data INCREASE or DECREASE over time (has legend)?
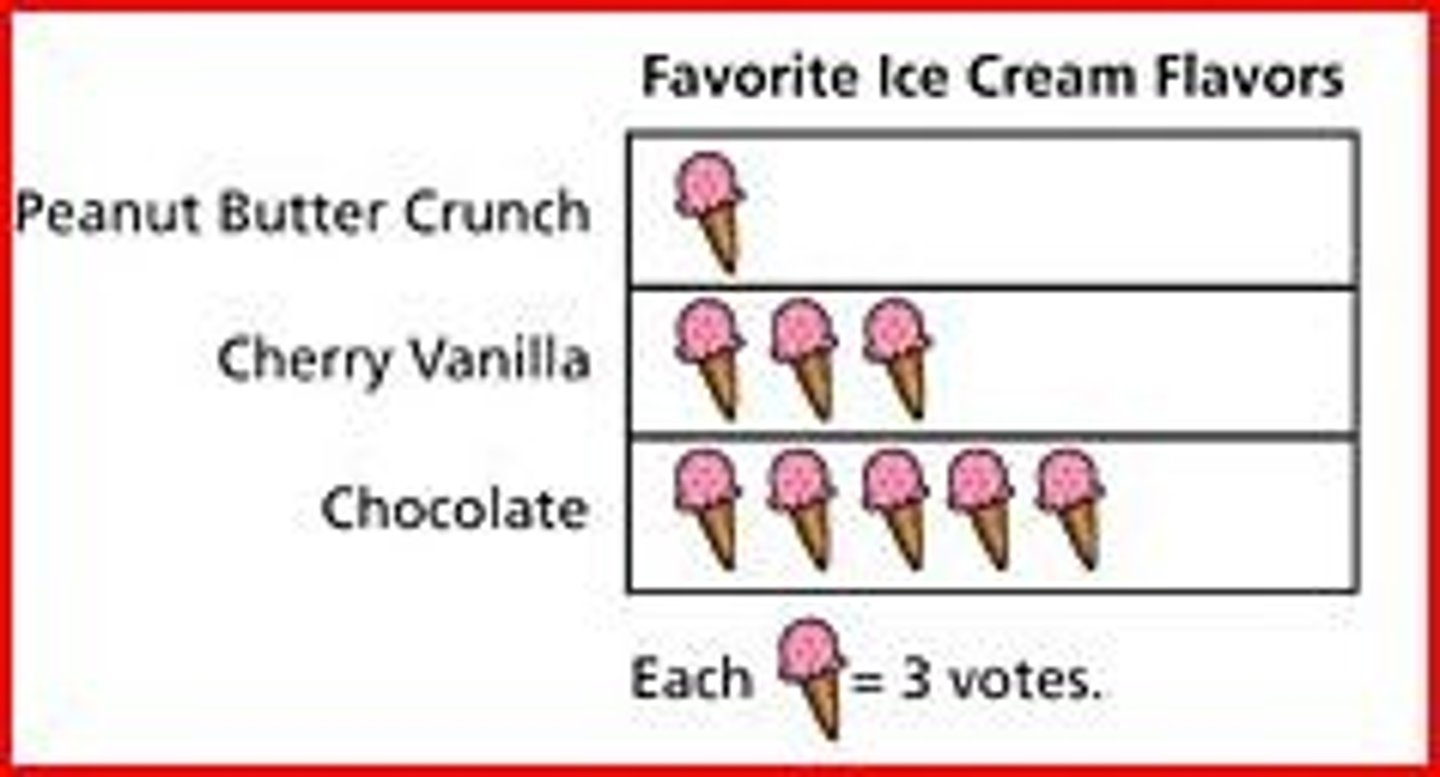
Pictograph
Which graph shows pics or symbols to show data (legend)?
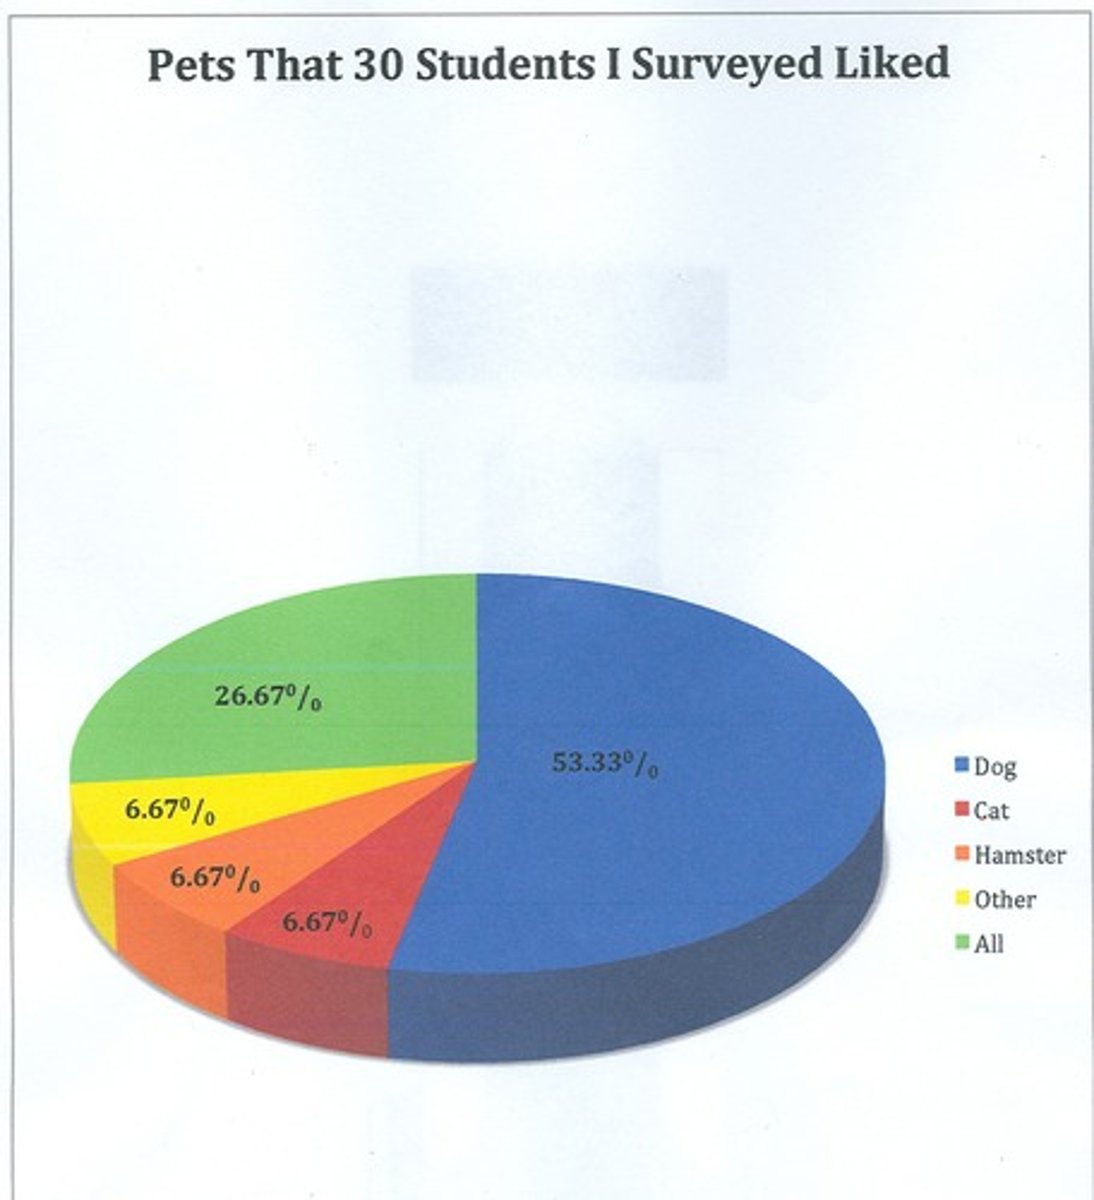
Pie Chart
Which graph is a diagram to compare parts as a whole (labeled,legend)?
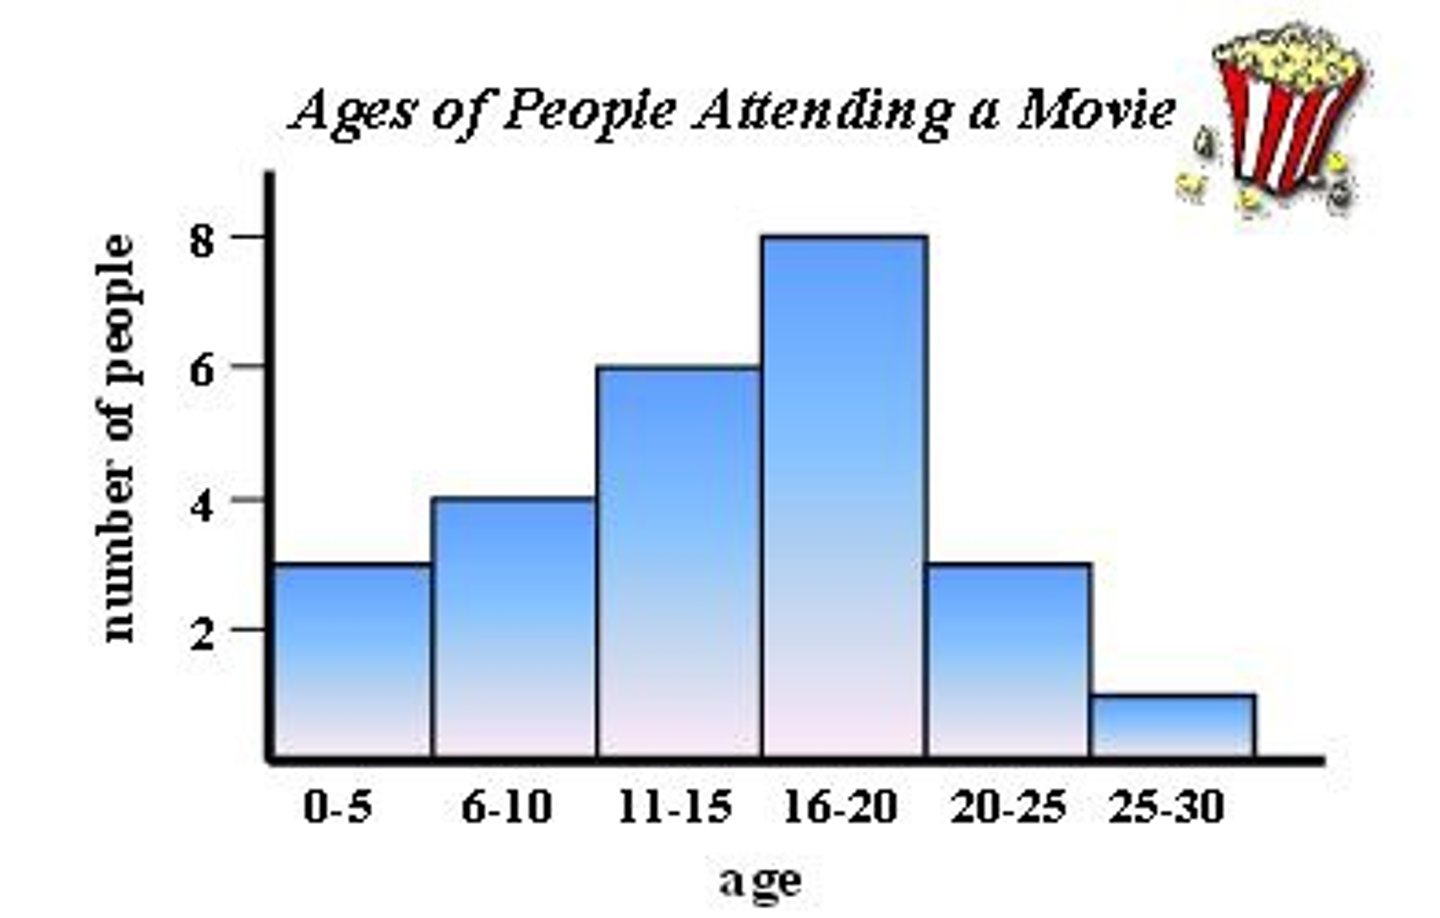
Histogram
What graph is like a bar graph with grouped data that is touching?
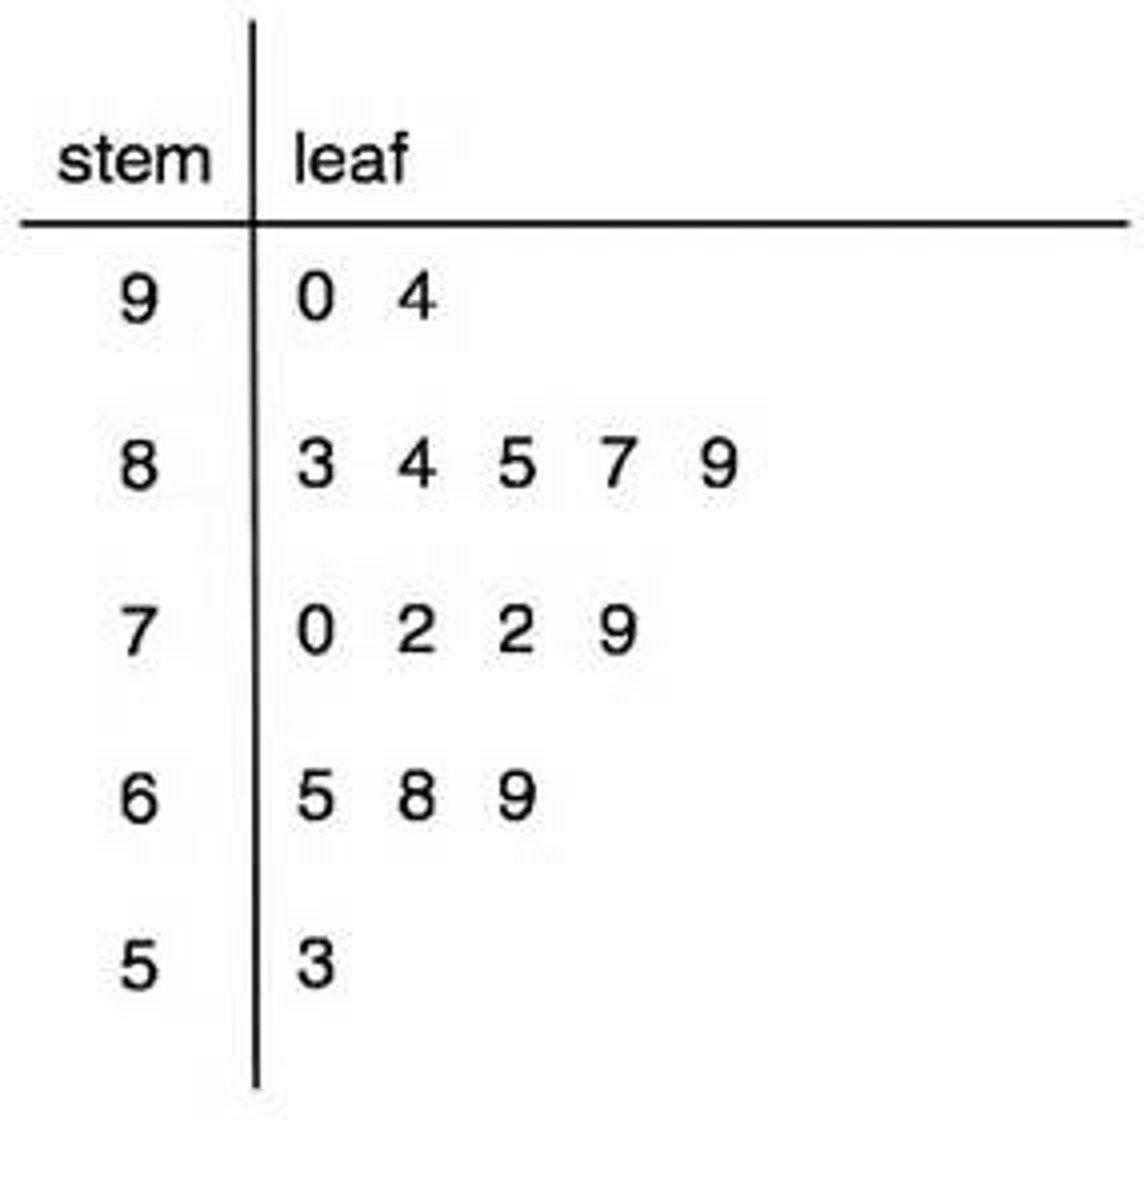
Stem and leaf plot
This graph outlines groups of data that fall into range (small to large, left=stem, right=leaf)
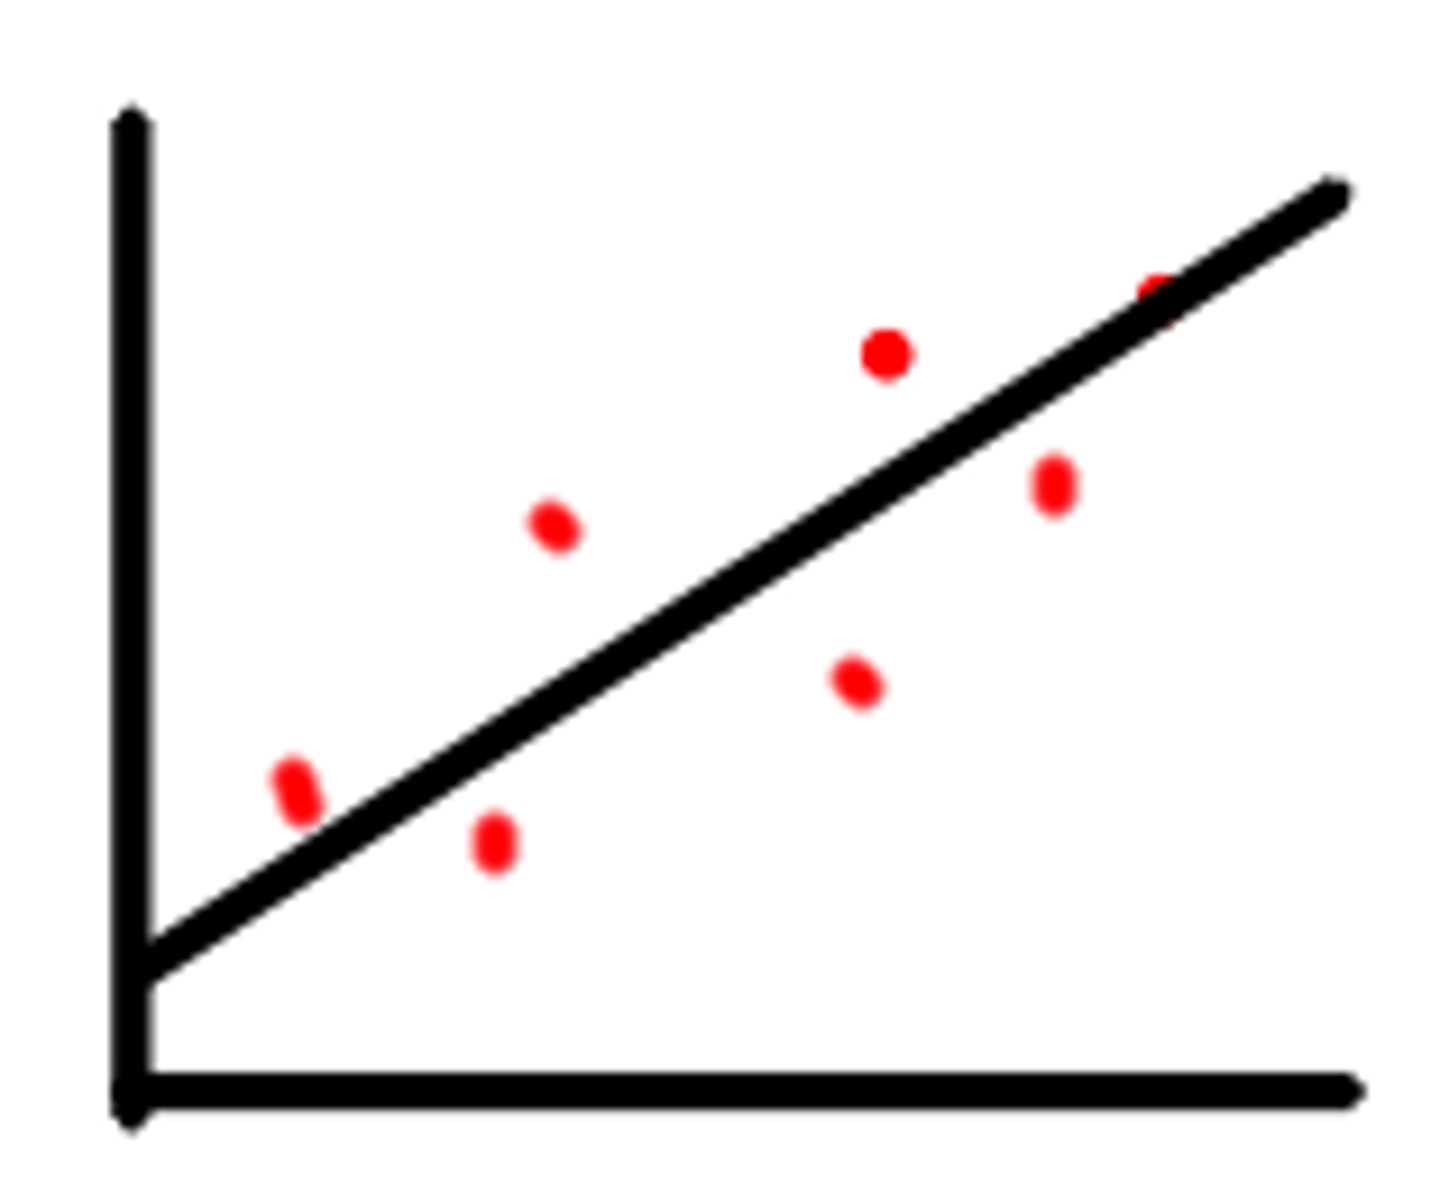
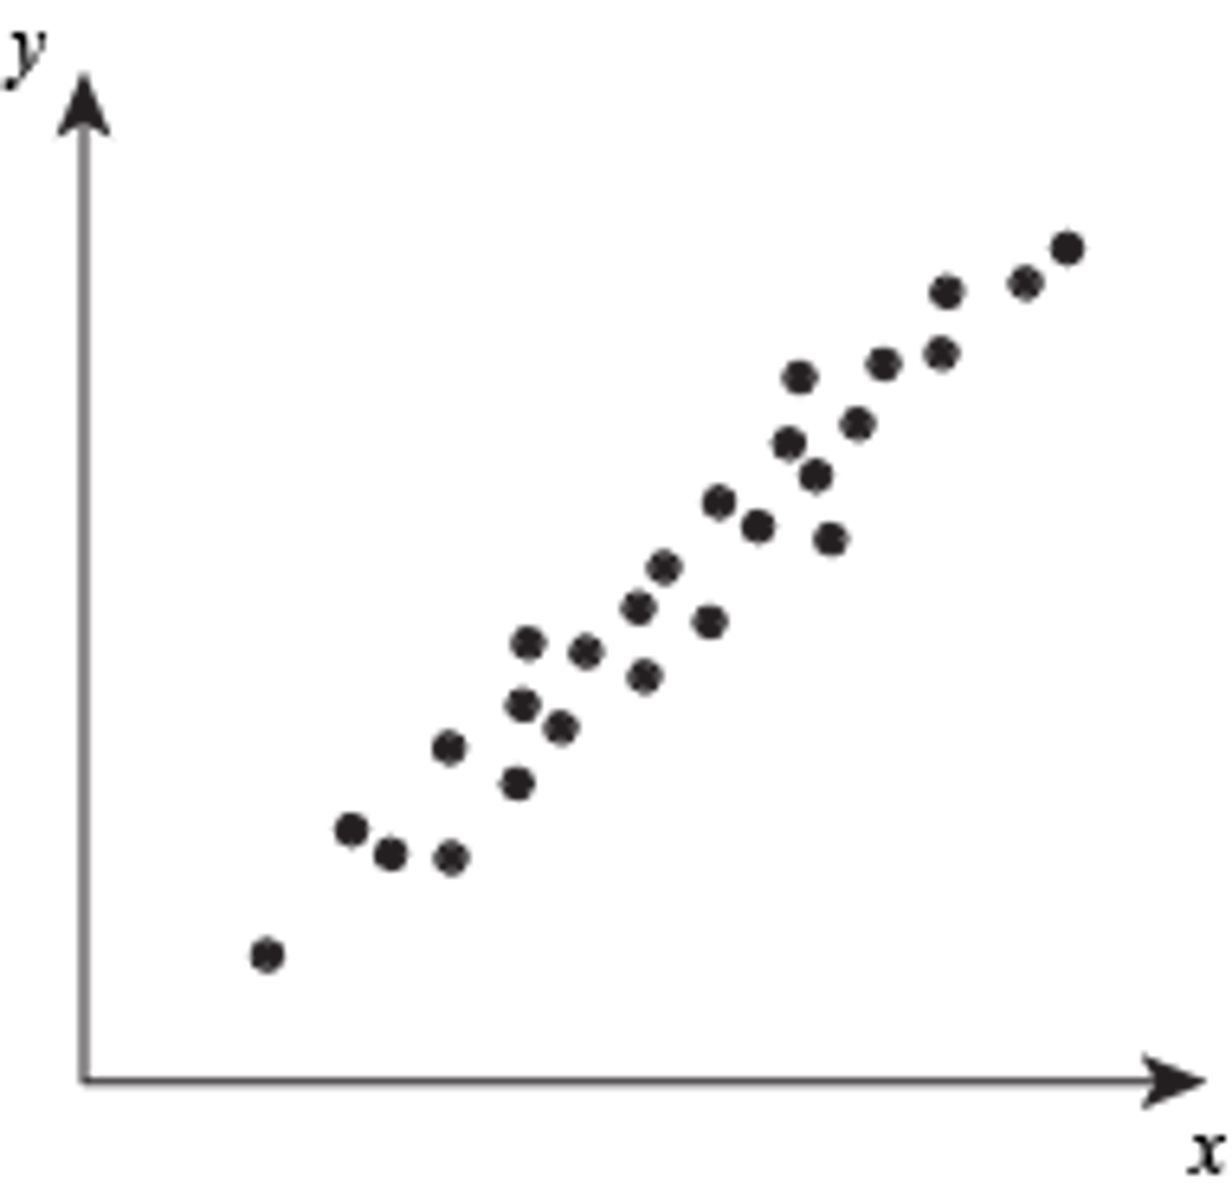
Scatter plot
This graph functions with data, finding simple regression.
4 different types: positive, negative, nonlinear exponential, nonlinear quadratic
Mean
Which measure of tendency is when you add all #, then divide by how many # there are? Also known as the average.
Median
Which measure of tendency is when you put the middle # of ordered (Least to Greatest) list, and if # are even, then the 2 middle # averaged out?
Mode
Which measure of tendency is the number that occurs the most and can be more than one?
Range
Which measure of tendency is when you subtract the minimum value from maximum value?
Outlier
What is a data point that is distinctly separated from other values and is considered unexpected value? This value "lies outside" (is much smaller or larger than) most of the other values in a set of data
Data trend
What is the term for the general tendency of numbers in a set?
Symmetry
Which shape of distribution is divided at the center with each side having half the data?
Unimodal
Which shape of distribution has a single clear peak?
Bimodal
Which shape of distribution has TWO clear peaks?
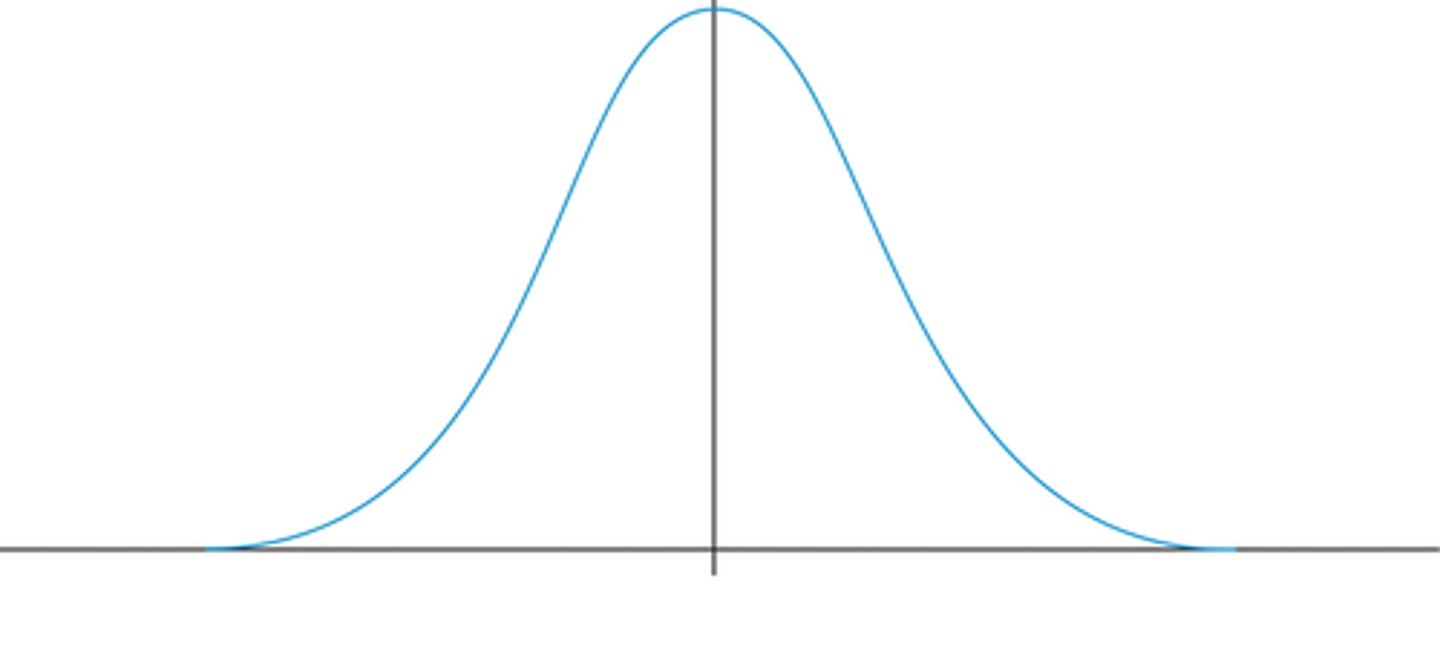
Bell Shaped
Which shape of distribution has a single peak at the center?
Skewed Right
Which shape of distribution has fewer observations on the right (towards higher values)?
Skewed Left
Which shape of distribution has fewer observations on the left (towards lower values)?
Uniform distribution
Which shape of distribution has observations in a data set that are spread equally across the range of the distribution?
Covariance
What is the term that explains the way two variables change together?
Dependent Variable
What kind of variable depends on at least one other variable?
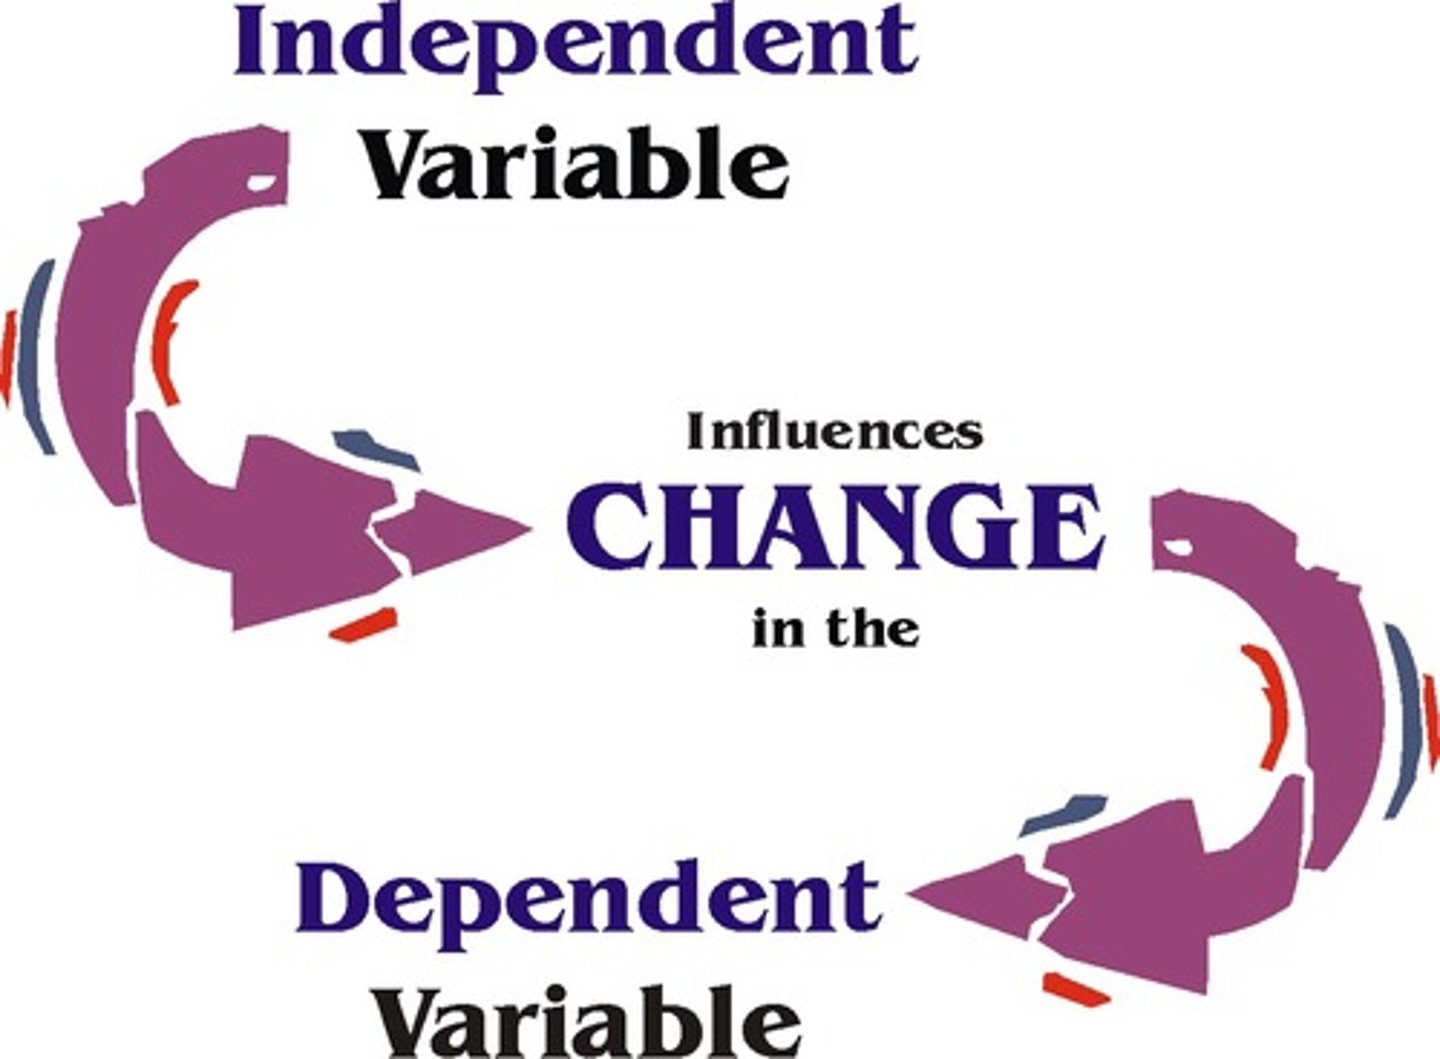
Independent Variable
What kind of variable determines the value of another variable?

Length
Which geometric quantity is measured with ruler or tape measure?
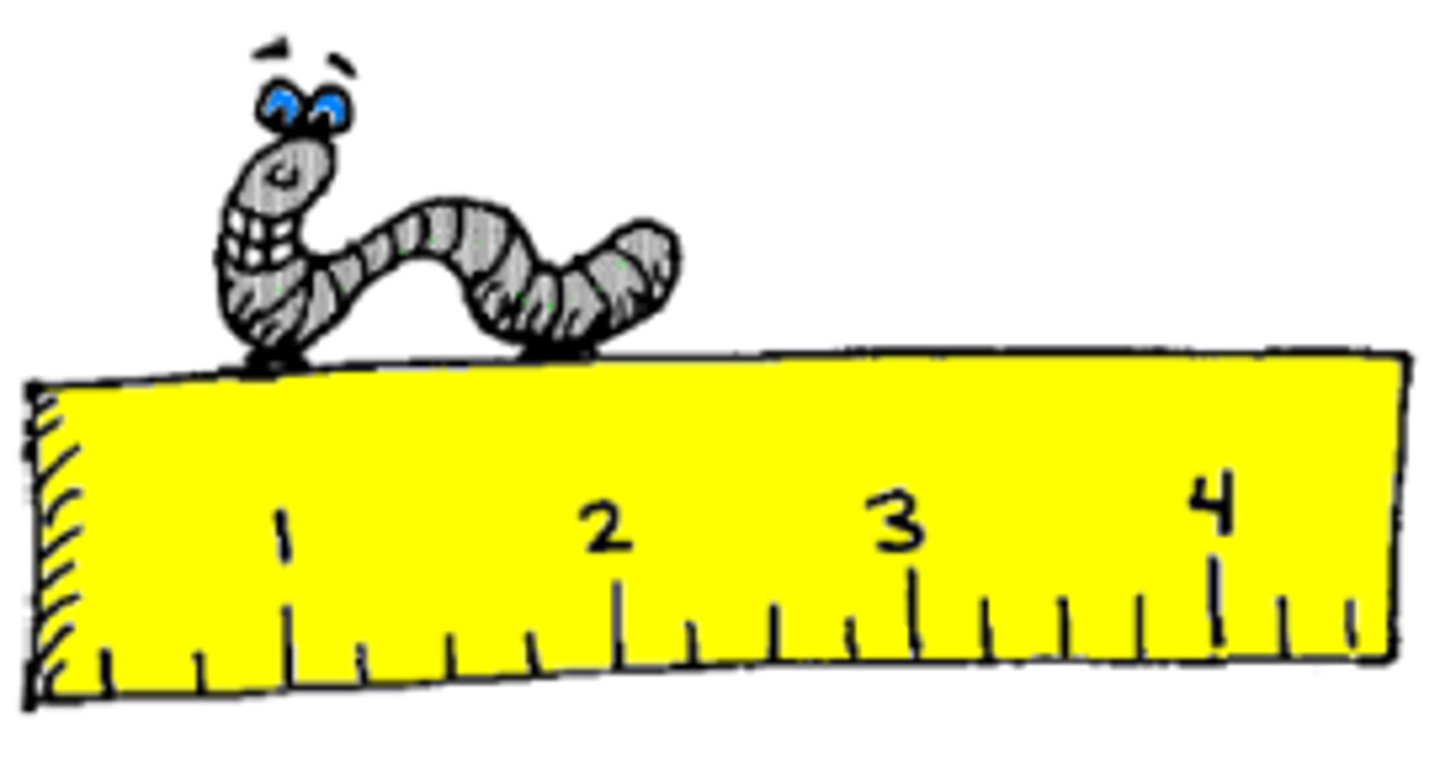
Length
Inches, feet, yard, miles, centimeters, meter, and kilometers are all units of?
C=2 x PIE x r
How is the circumference (distance around a circle) calculated?
Pie x r squared
How do you find the area of a circle?
Length of half a circle
What does this formula cover?
C=2 PIE r then multiply by the fraction central angle measure/360
Perimeter
What is the term for the distance around a 2 dimensional shape?
Add all the sides
How do you find the perimeter of a shape?
Subtract the width and height of the other sides.
How do you find the perimeter of a shape that is missing a side?
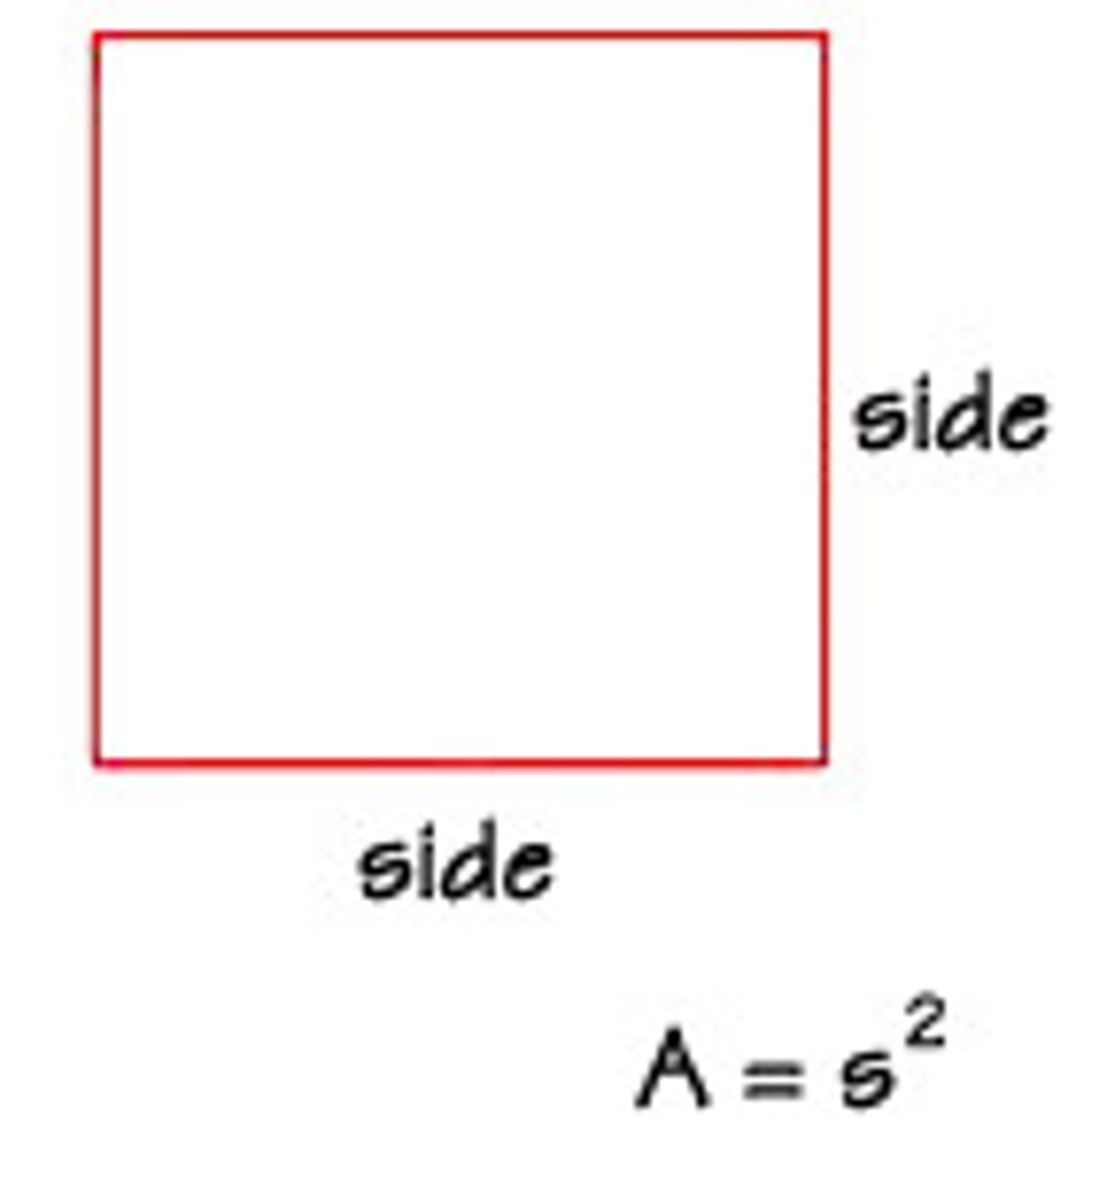
A= l x l
What is the formula for a square?
A= l x w
What is the formula for a rectangle?
A= 1/2 x b x h
What is the formula for a triangle?
A= h x b
What is the formula for a parallelogram?
A= 1/2 x h x (b1 + b2)
What is the formula for a trapezoid?
A= PIE x R squared
What is the formula for a circle?