2. Parameter stability and structural change
1/24
There's no tags or description
Looks like no tags are added yet.
Name | Mastery | Learn | Test | Matching | Spaced | Call with Kai |
|---|
No analytics yet
Send a link to your students to track their progress
25 Terms
What does CLRA1 mean?
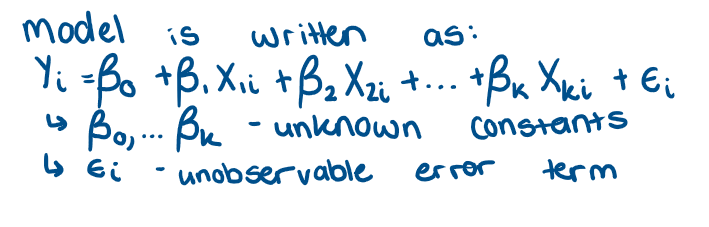
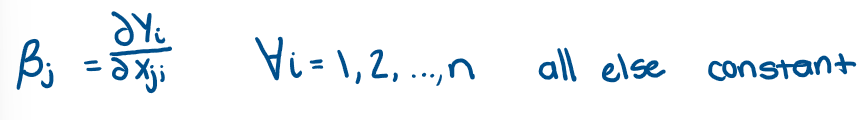
What does βj interpreted as?
What are non constant parameters
We have n observations and that for the first set we have n1 observations and the second set has n -n1 observations and the β are not the same
What does it mean if we have a structural break/change?
βj1 =/ βj2 - 1 and 2 indicate subsets
the parameter is not constant
OLS estimater βjhat will be biased
It will be be some unbiased estimators of βj2hat and βj2 hat - overestimatye for one and underestimate for the other
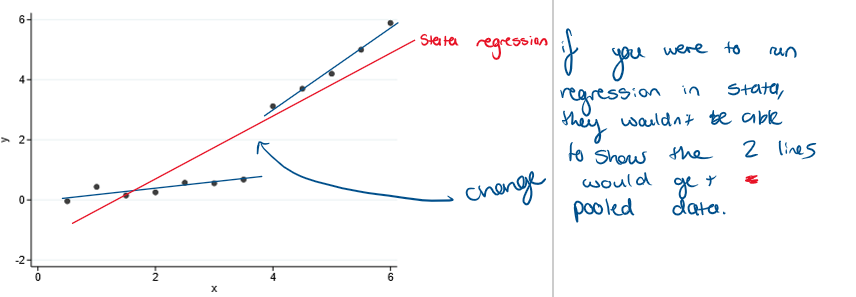
What can a sructural break look like?
What does the Simpsons paradox look like
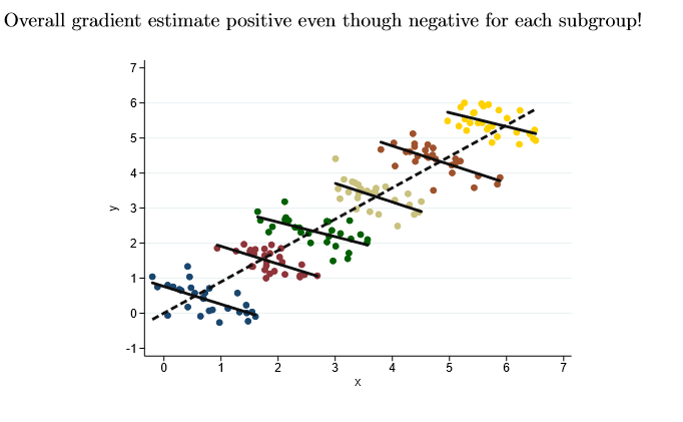
Why can structural change be problematic?
breaks assumption of constant parameters
May lead to misleading parameter estimates
How does structural change problems arise in cross-sectional data?
Cross-sectional data, relationships between variables may vary across different subgroups
determinants of wage may be different for men and women
determinants of life satisfaction may differ by age
How does structural change problems arise in time-series data?
Time-series data, relationships between variables may vary across different subperiods
relationships between macroeconomic aggregates change due to shocks
Determinants of aggregate excess mortality change due to Covid
What are the tests for structural change?
formal test:
Chow Test
Predictive Failure test
Informal diagnostic to idnetify potential structural breaks
recursive Least squares
What are we testing in the Chow test?
The null hypothesis is that the model 1 is correct: Yi = β0 + β1X1i + β2X2i + … + βkXki + ei
Alternative hypothesis is that any parameter is non-constant
H0: β01 = β02, β11 = β12, …. , βk1 = βk2
H1: βj1 =/ βj2 for atleast one j
How is the Chow test an F-Test
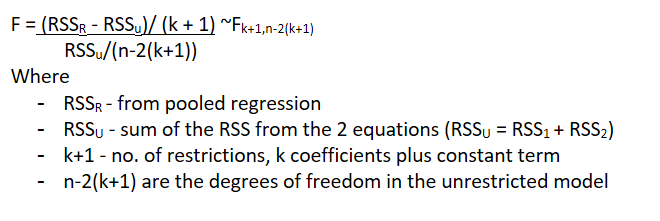
What are the 5 easy steps to do the F stat of a Chow test?
Run the pooled, restricted regression using the whole sample (1,…, n) and obtain RSSR
Run regression in group 1 using observations 1,…n1 obtain RSS1
Run regression in group 2 using observations n1+1,…,n and obtain RSS2
Calculated RSSu = RSS1 + RSS2
Calculate the F-stat and compare it to the relevant critical value of the F-distribution table - bigger values of F are rejected - if RSSR is much bigger than RSSU → more residual variation in RSSR than RSSU
What are the steps for a chow test
need critical components
need hypothesis
write F stat/ test stat
Need critical value
What are the drawbacks of the Chow Test
to calculate RSSu = RSS1 + RSS2 we require:
ei1 and ei2 are homoscedastic and independently distributed
The test does not tell us which parameter is unstable
only that any of them may be
Procedure requires us to know where structural break occurs
bc/ we need to specify where to split the sample - in practice we don’t know this exactly
May not have enough data to estimate both models seperately
esp if one sub-sample is relatively small
What’s different between the predictive failure test and the chow test
instead of estimating models for 2 samples and detecting differences We estimate the model for one sample and check whether it can accurately predict outcomes in the other sample
How does predictive failure test show there is a structural break?
If model cannot predict outcomes in the second sample → then structural break has occured
What are the hypothesis for a predictive failure test?
Null: the same model can be fitted to the second sample
H0: Yi = β0 + β1X1i + β2X2i + … + βkXki + ei i = n1 + 1, …. n1 + n2
If we impose the null on our unrestricted model what do we get
Yi = β0 + β1X1i + β2X2i + … + βkXki + ei i = 1,2,..n1+n2
How is the predictive failure test an F-test of multiple regressions
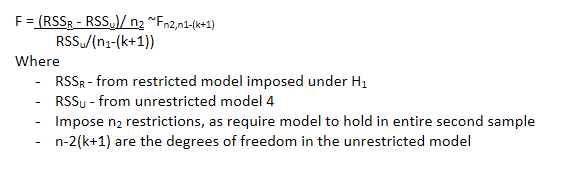
What are the steps for a predictive failure test
Run the full, restricted regression using the whole sample (inc all observations 1, .., n1, n1 + 1, …, n1 + n2) and obtain RSSR
Run regression in the first subgroup using only observations 1,…,n1 and obtain RSSU
Calculate the F-stat and compare it to the relevant critical value from the F-distribution table
How can we use the predictive failure test using dummy variables?
How can we know when where a break is?
differences btw/ groups in cross-sectional data
break after a major event in time-series
Data-driven way to identify potential breaks - recursive least squares
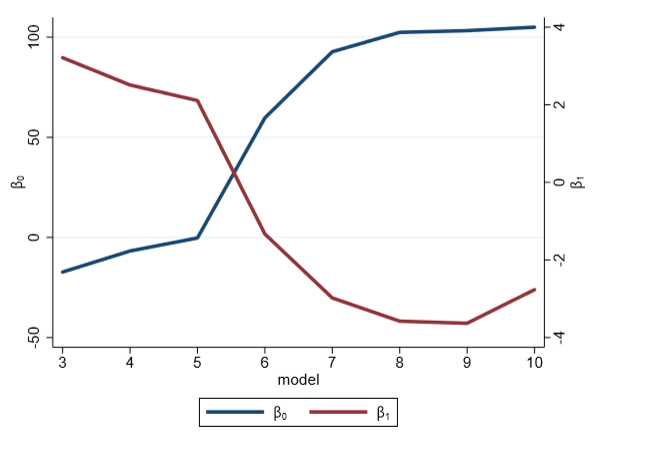
What is the procedure for Recursive Least squares
Fit model on smallest possible subsample (first k+1 observations)
Obtain βjhat
Extend sample by 1 observation and fit model again
Obtain another set for βjhat
Repeat adding one observation at a time, until entire sample used
Obtaining a sequence of sets for βjhat
Plot the sequence of values for each parameter
visual inspection will tell you where the break might be
What could it look like if there is a break using reclusive least squares