Probability & Statistics - Week 1 - 3
1/40
There's no tags or description
Looks like no tags are added yet.
Name | Mastery | Learn | Test | Matching | Spaced | Call with Kai |
|---|
No analytics yet
Send a link to your students to track their progress
41 Terms
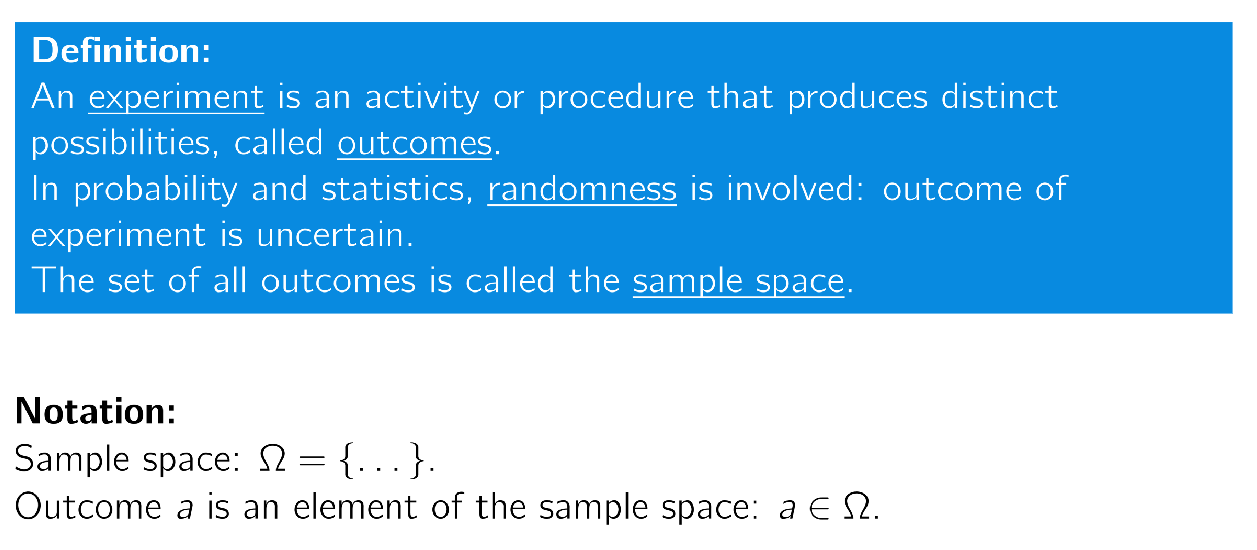
Definition Outcome & sample space
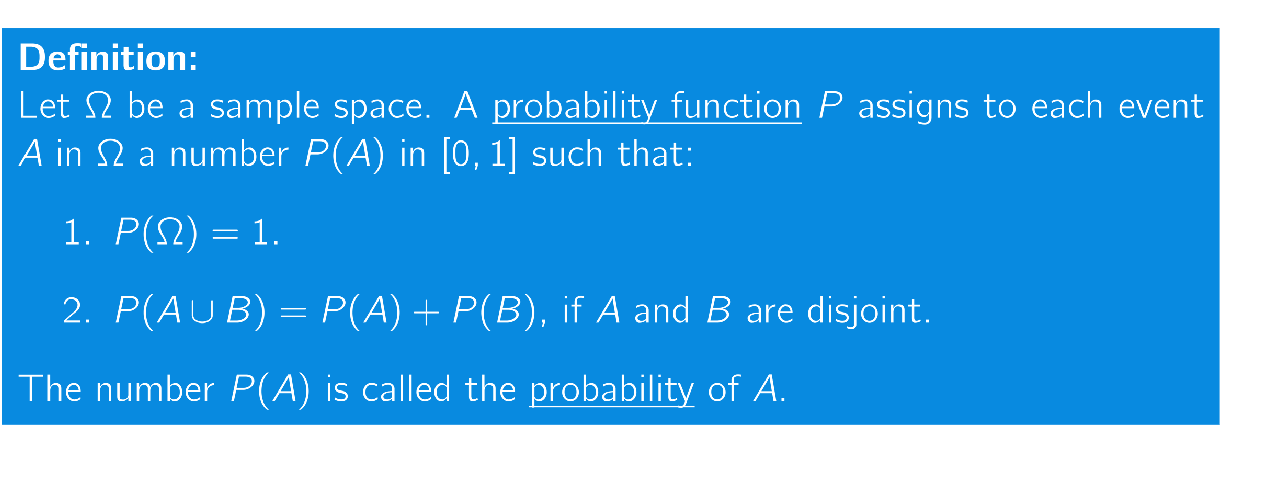
Definition Probability function
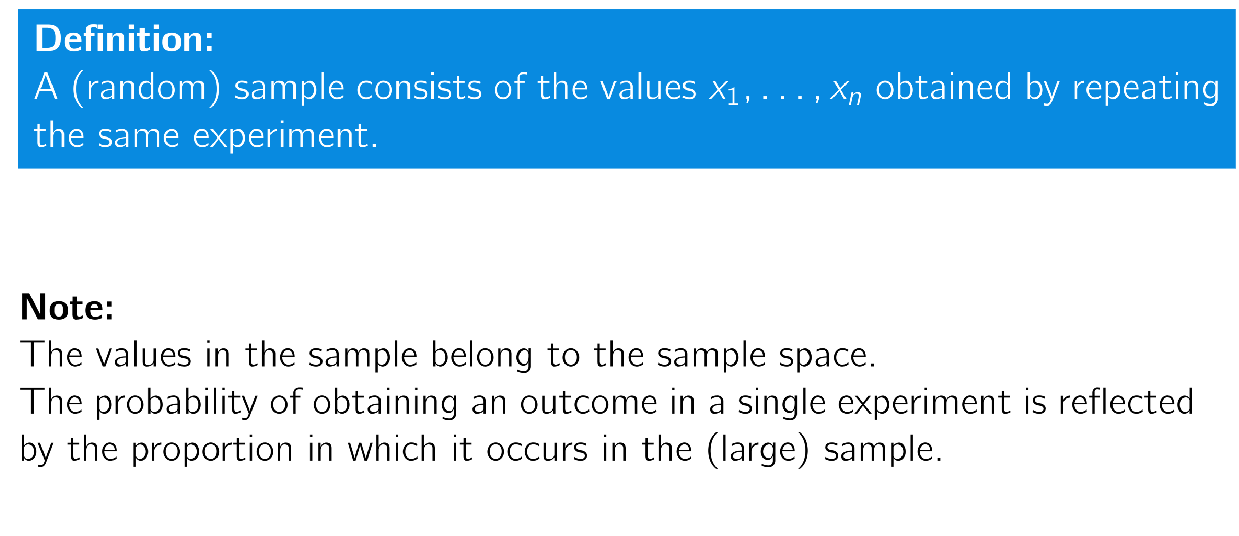
Definition Random Sample
Difference probability vs statistics
Probability: from a model → predict data
Statistic: from collected data → create a mode → this can be applied later to predict
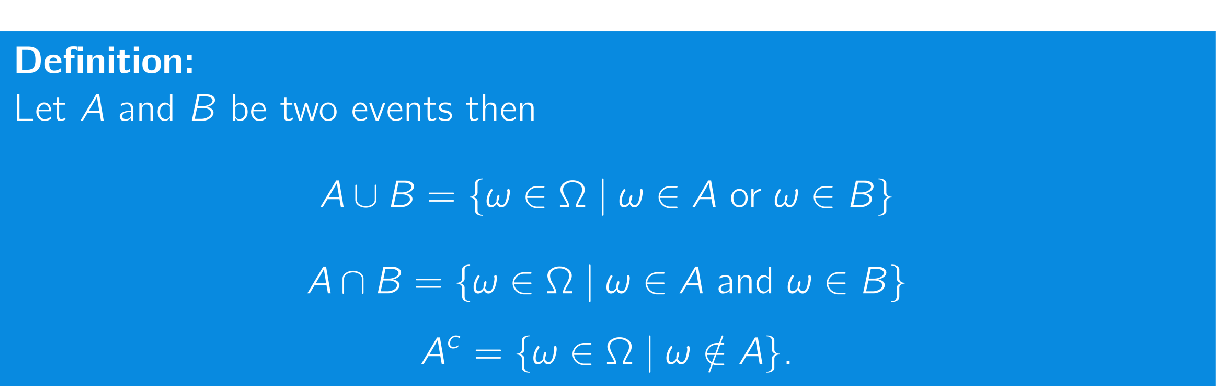
(Algebraic) definition: union, intersection & complement
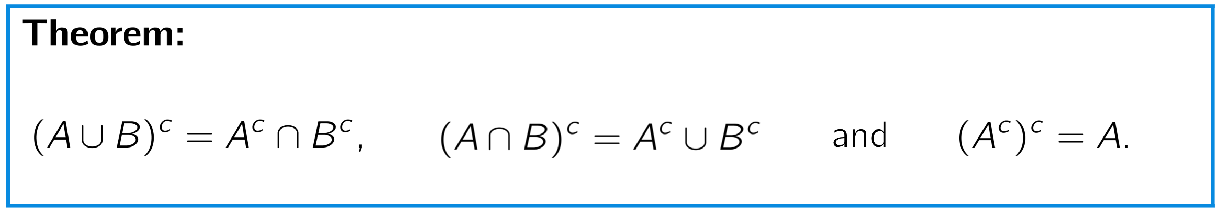
Theorem: links between union, intersection & complement (DeMorgan’s laws)
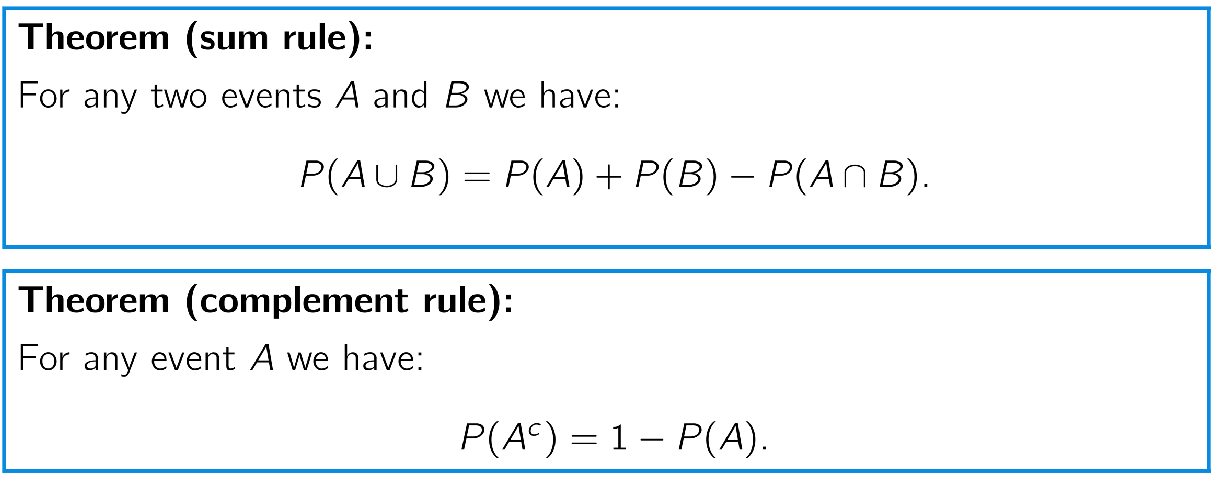
Sum & Complement rule
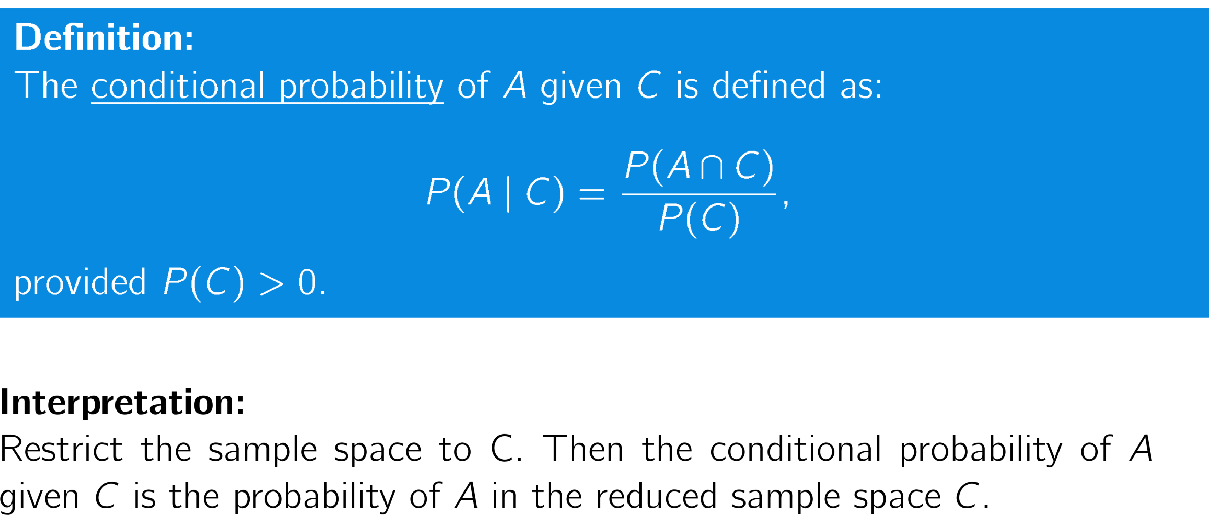
Conditional Probability
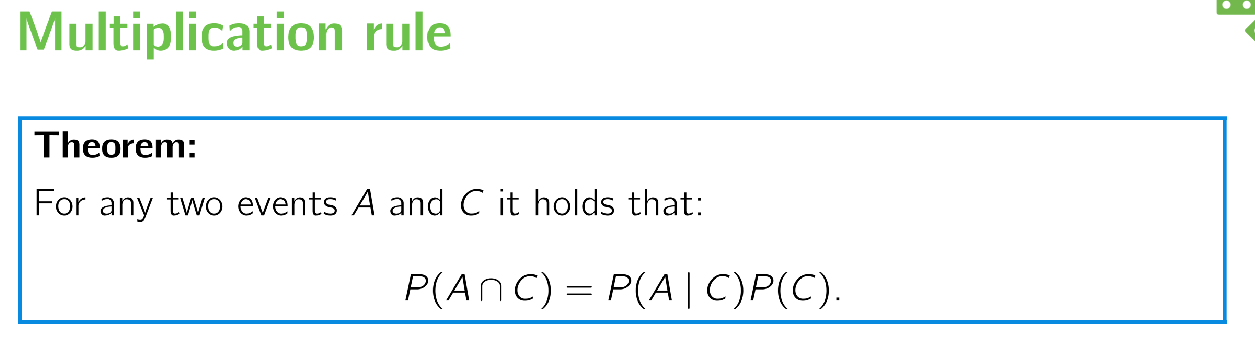
Multiplication rule
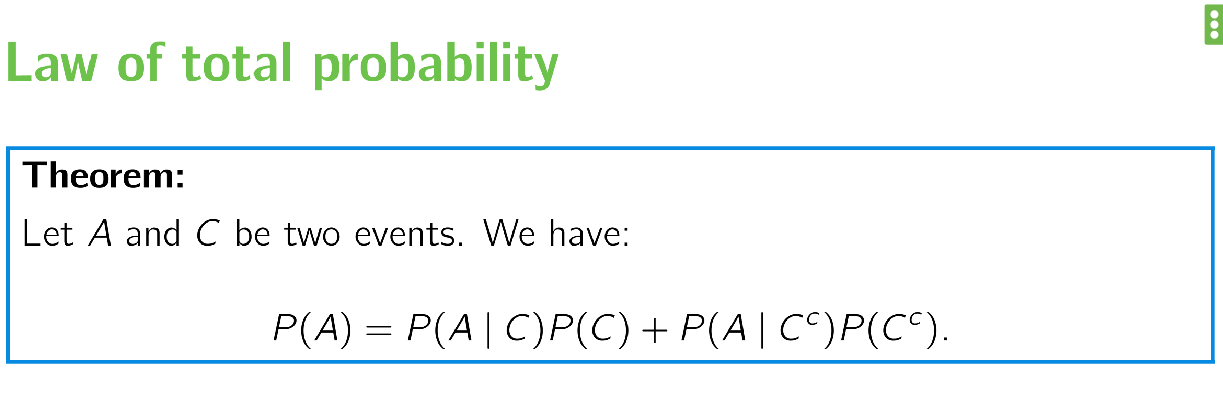
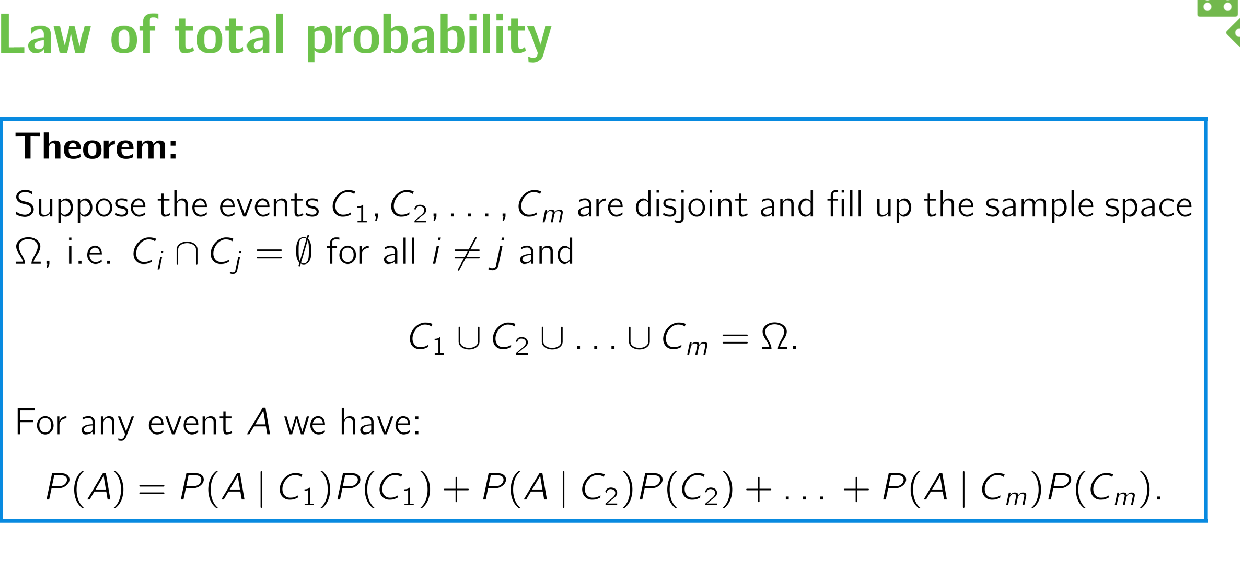
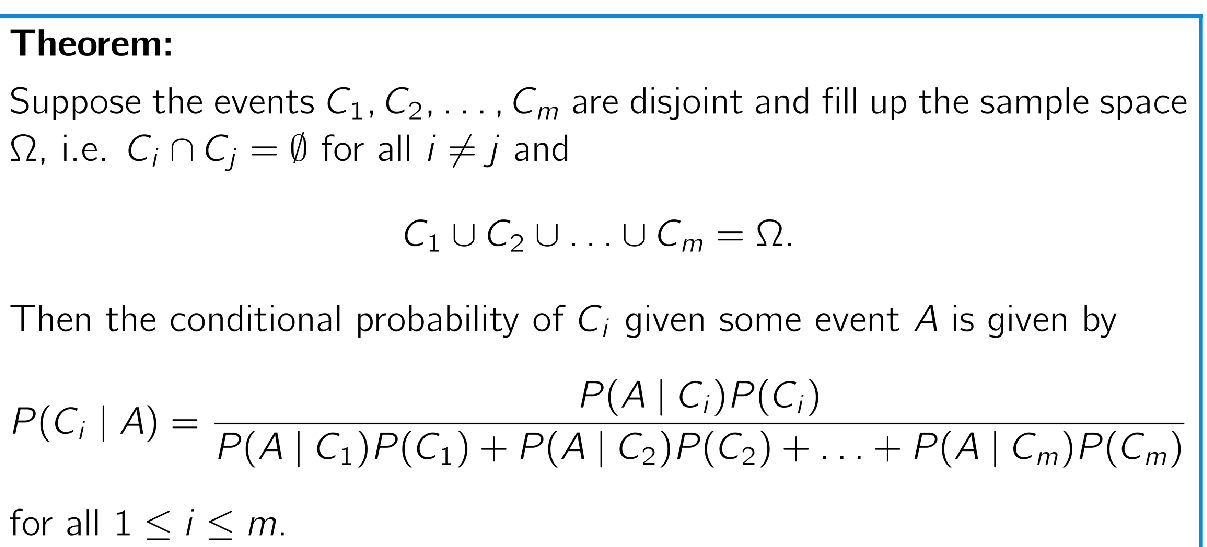
Law of total probability
Theorem / application of the law of probability
Bayes Rule
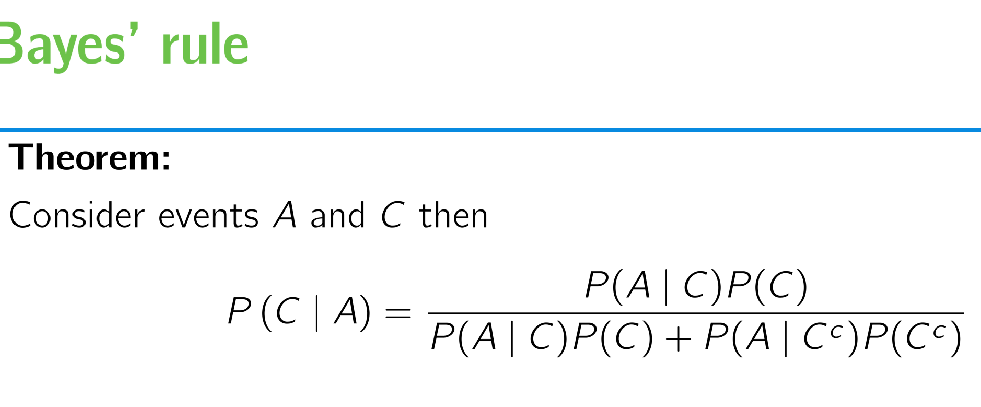
Theorem / application of Bayes Rule
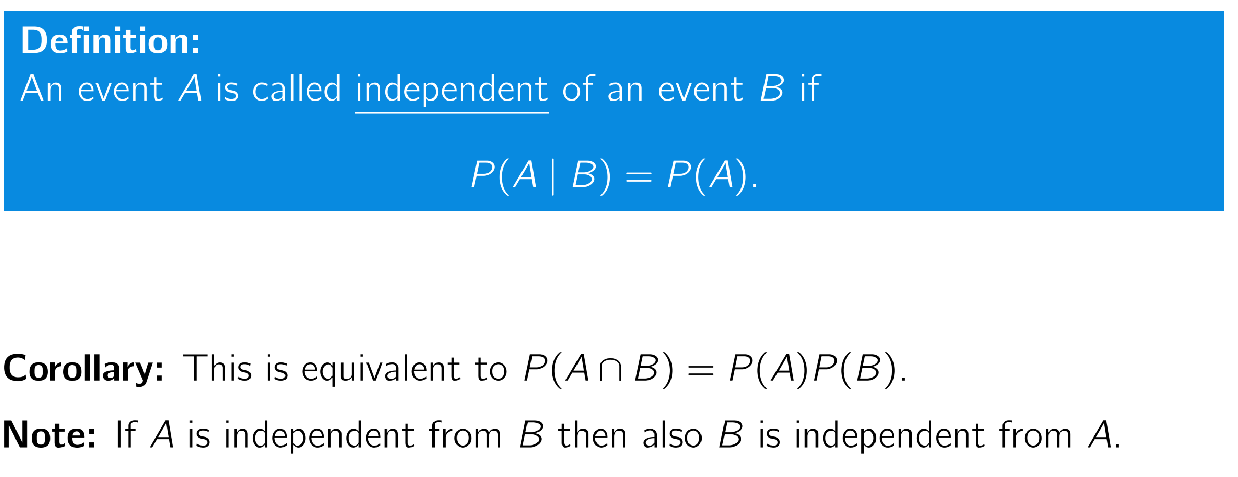
Definition independence
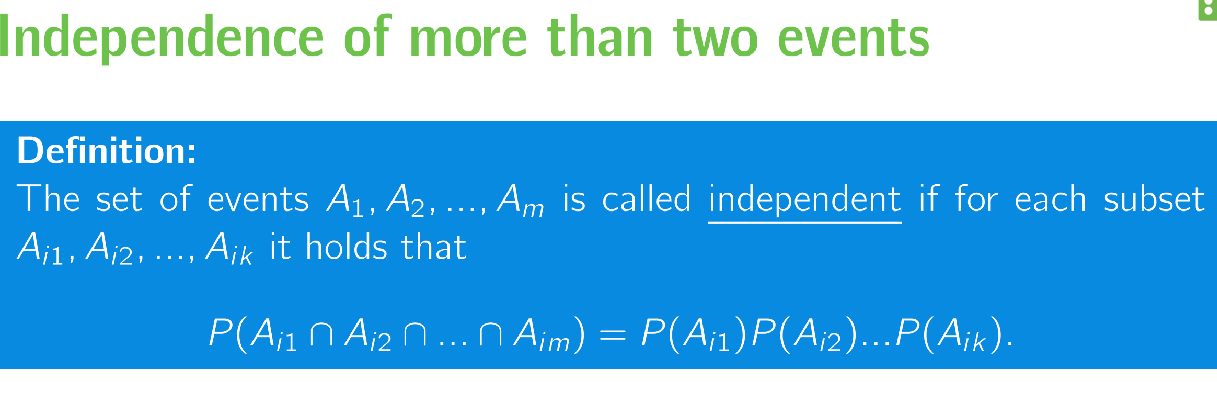
When is a set independent?
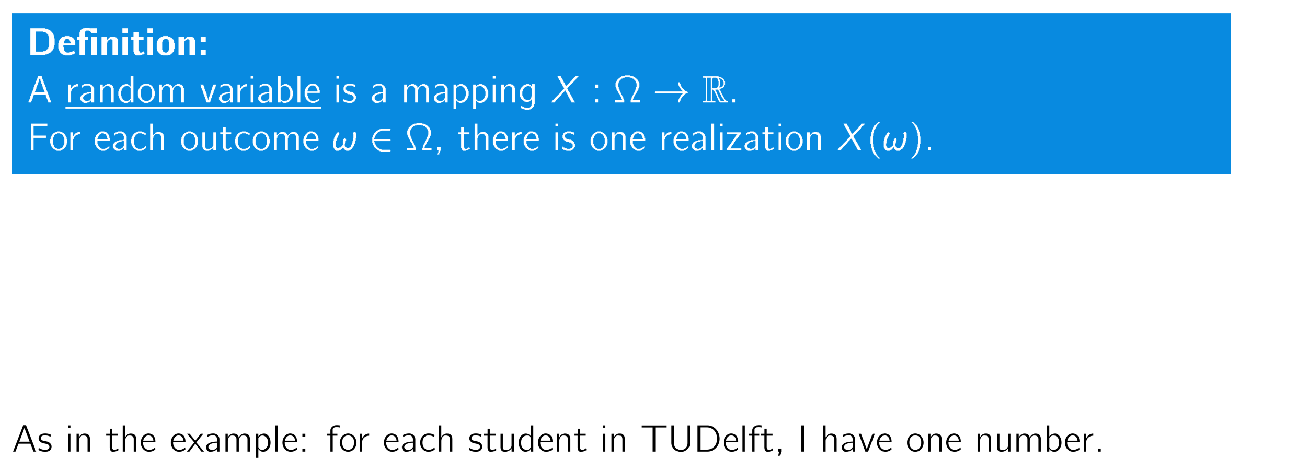
Definition: random variable
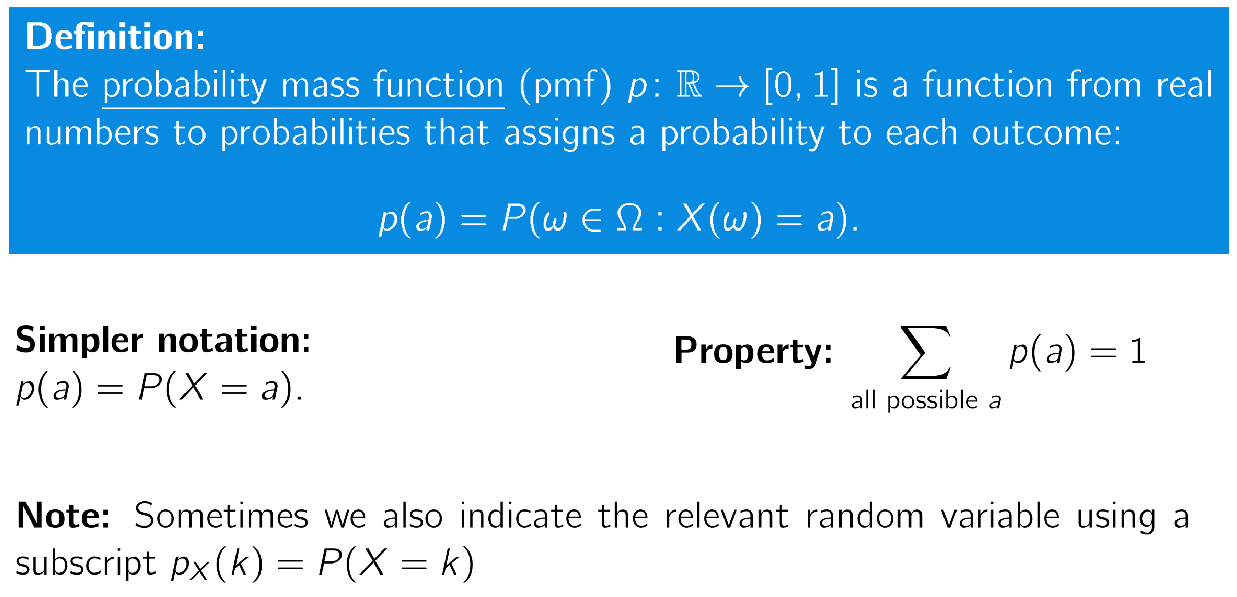
Probability mass function
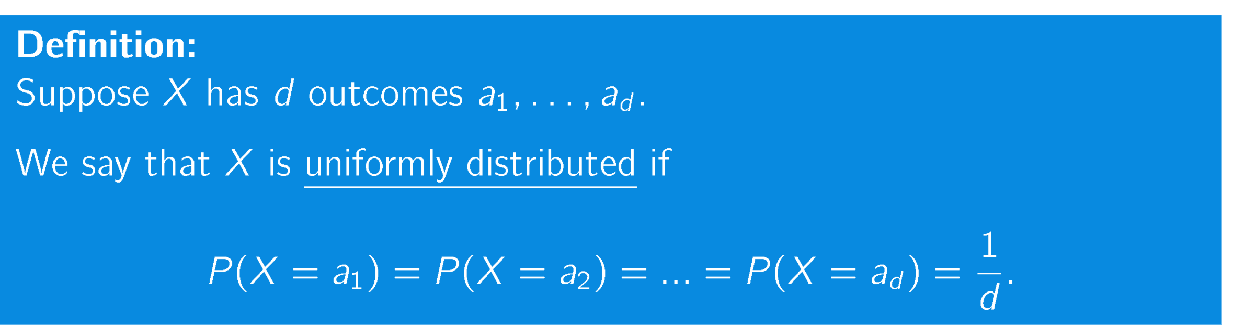
Definition uniform distribution
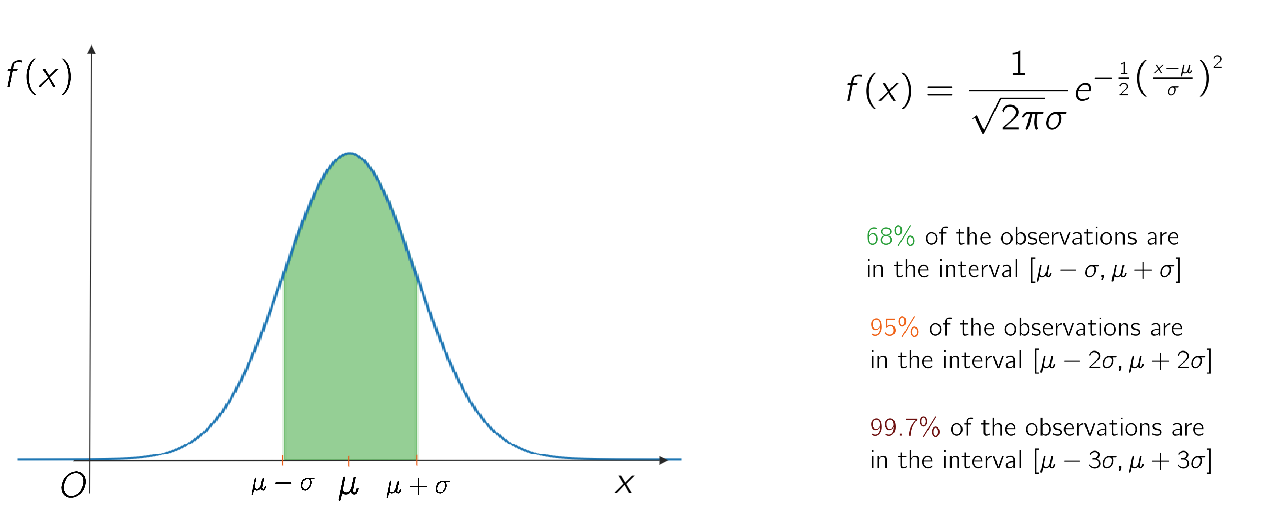
Normal Distribution (percentages)
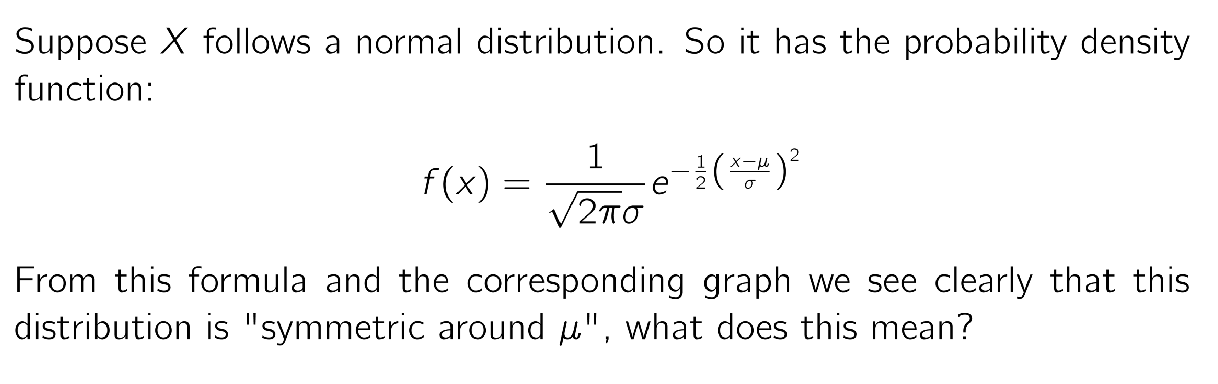
Normal Distribution — probability density & what is symmetric with a normal distribution?
Answer:
The distribution is symmetric around u if:
P(x <= u - a) = P(x >= u + a)
Definition cumulative distribution function
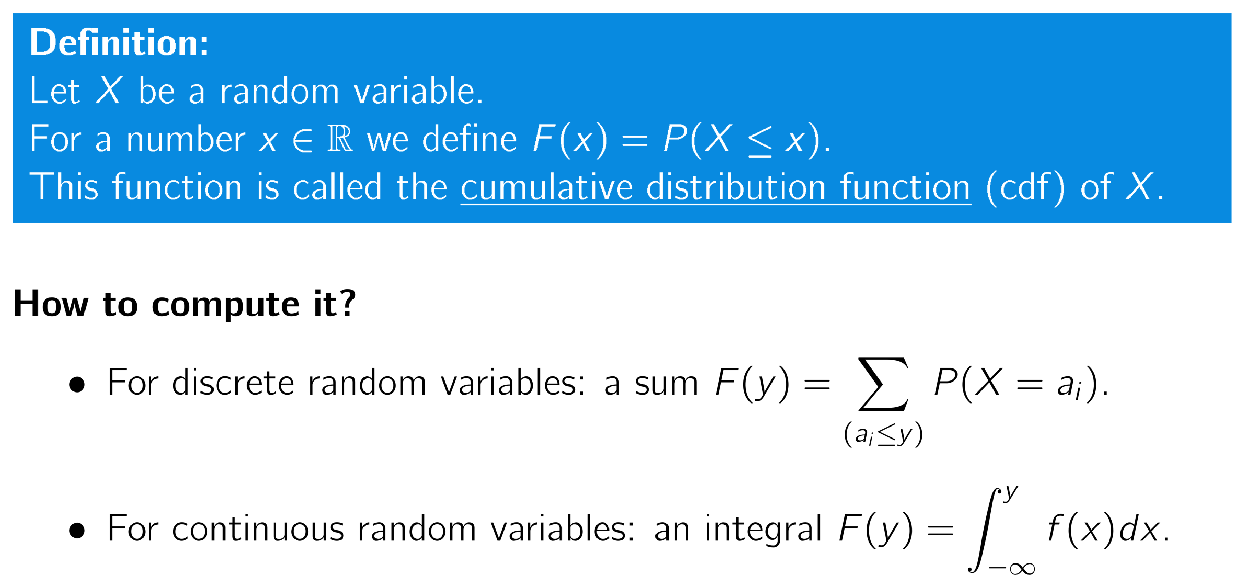
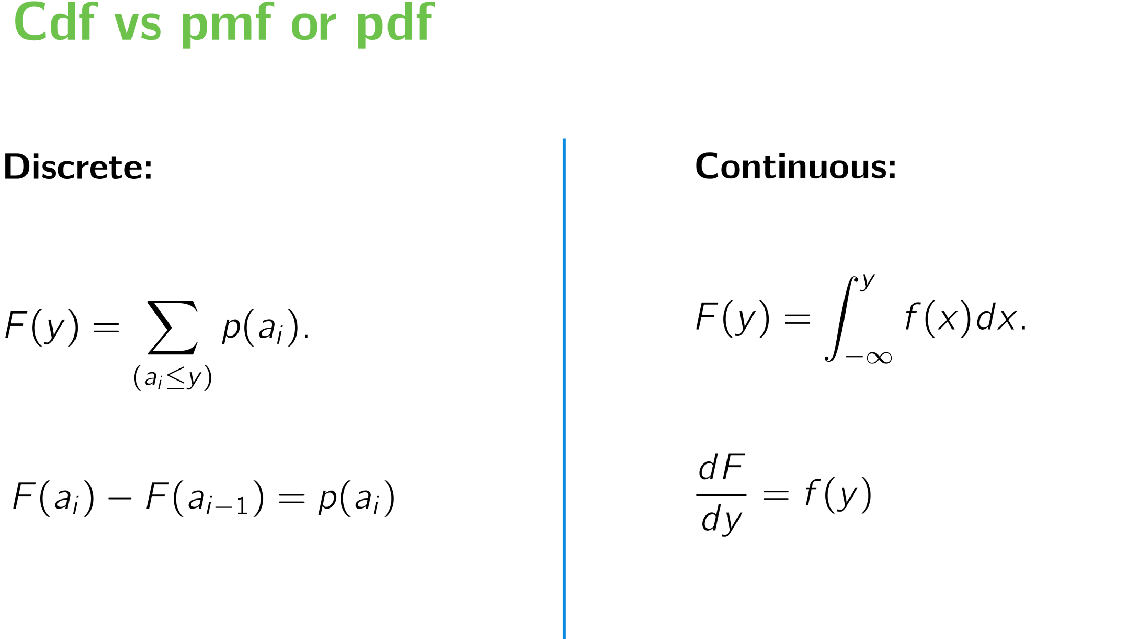
How to calculate CMF(cumulative distribution function) vs PMF(probability mass function)
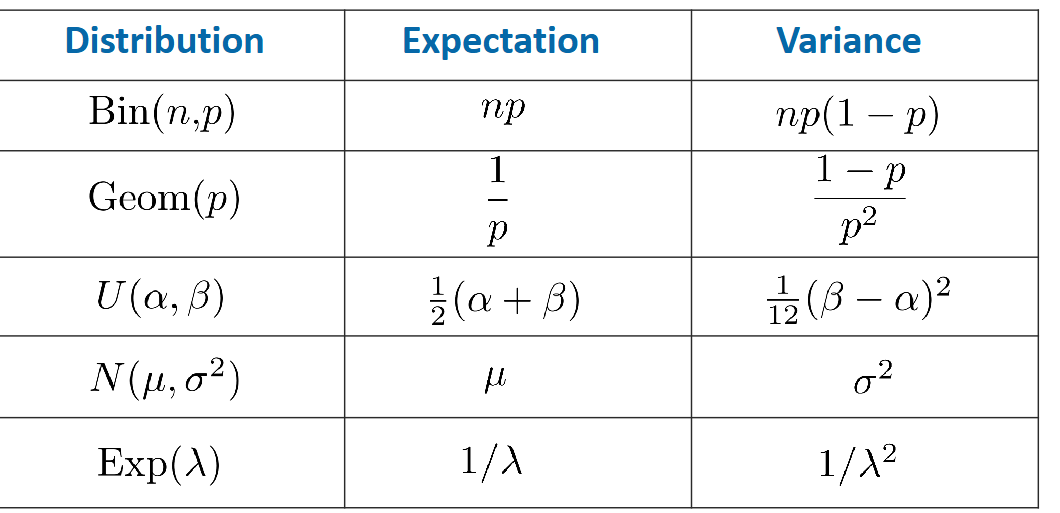
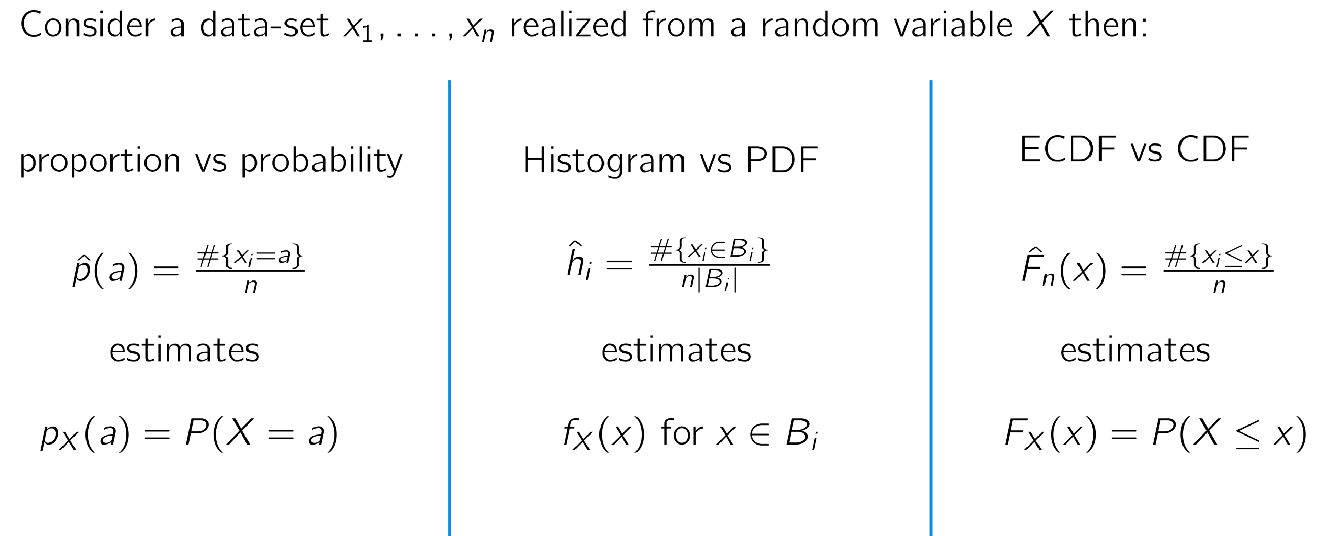
Summary of estimators
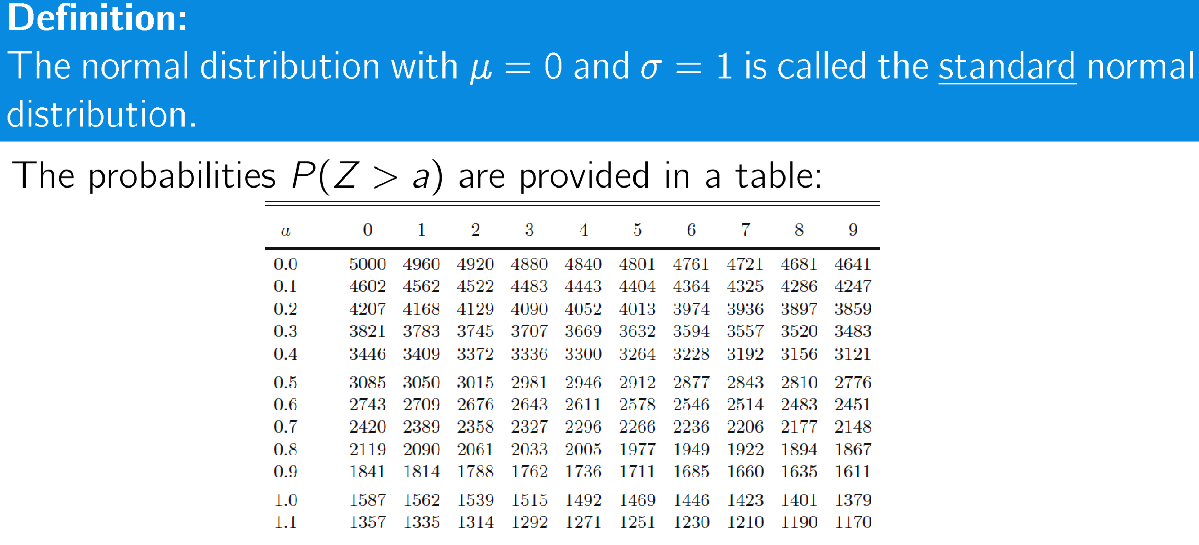
Standard normal distribution
During the exam you’ll get such standard normal distribution
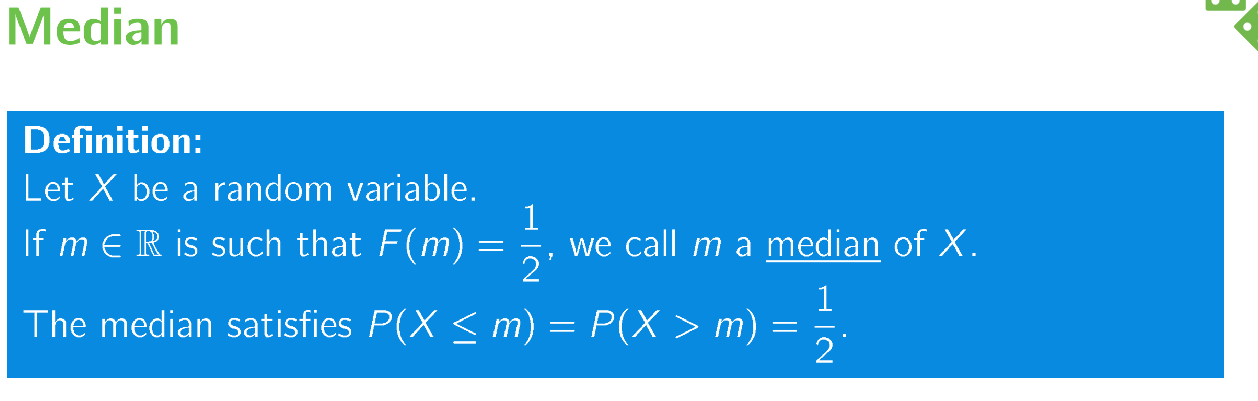
Definition Median
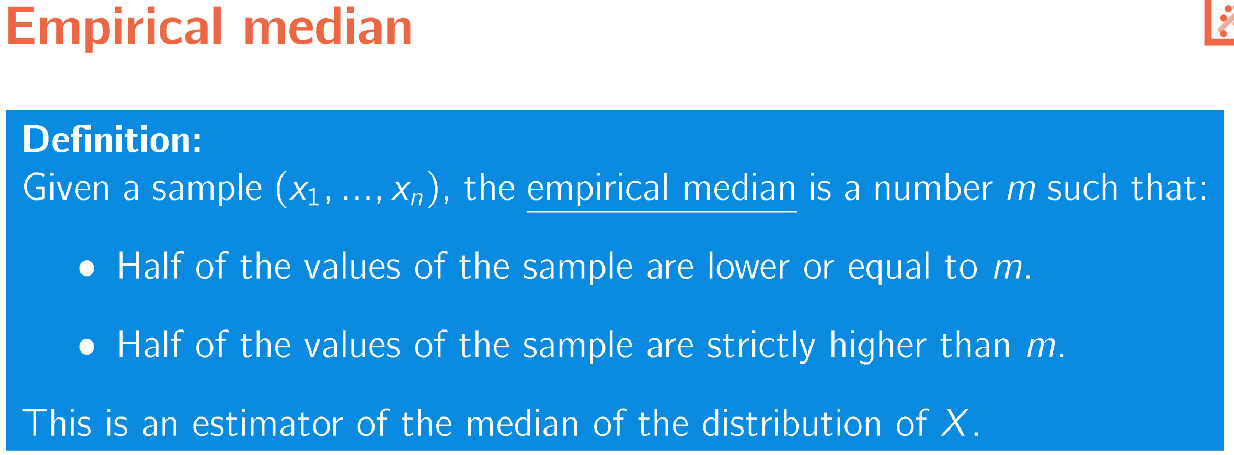
Definition Empirical Median
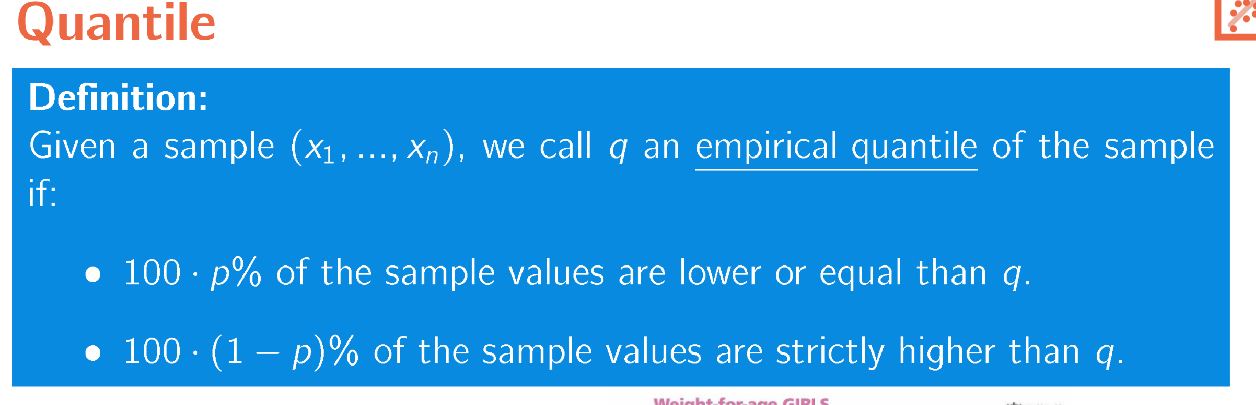
Definition Quantile
Aka the cut point where you divide a set into different parts each with the same total occurence / probability
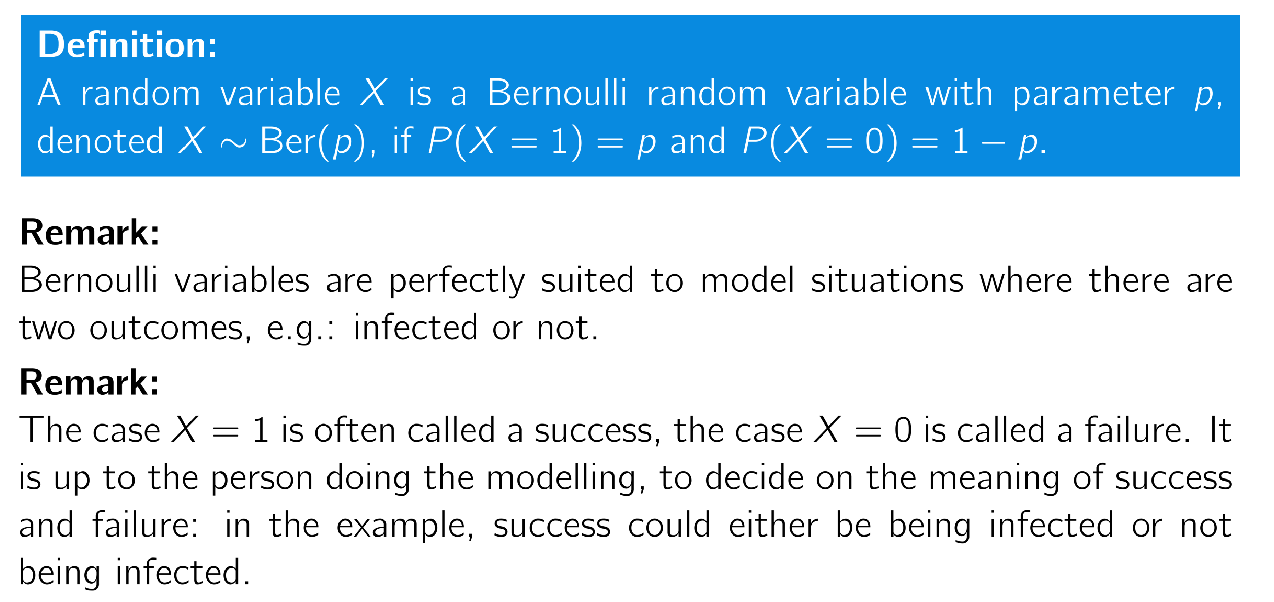
Definition Bernoulli random variable
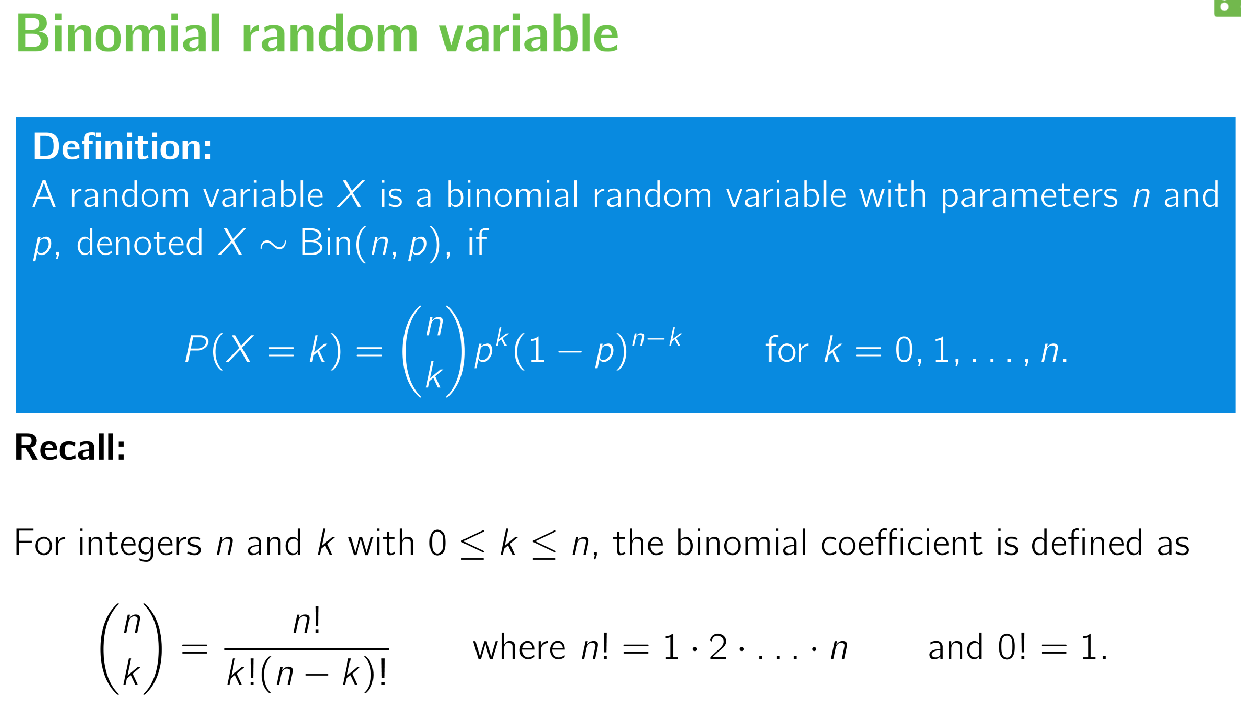
Binomial Distribution
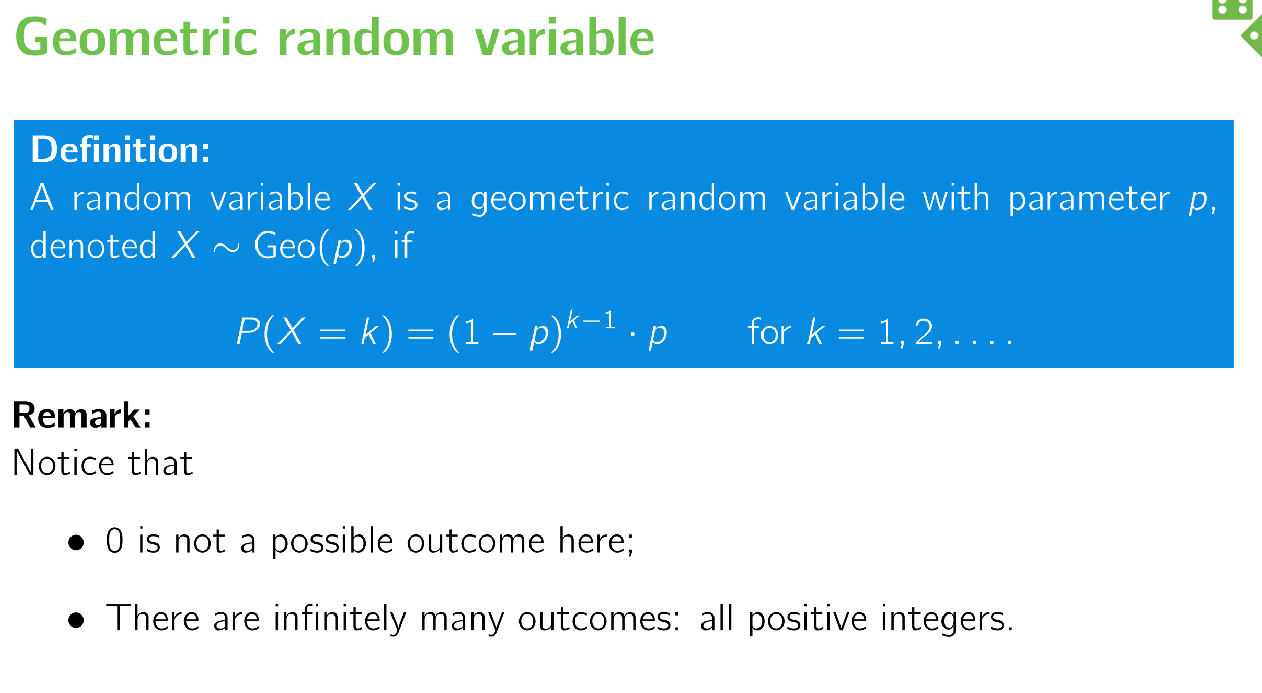
Geometric Random Variable
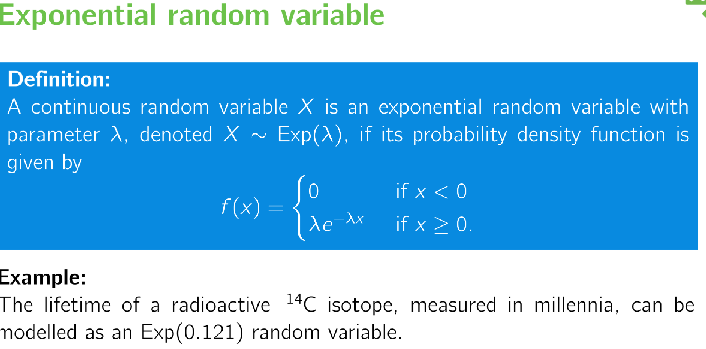
Exponential random variables / distribution
Essentially the continuous version of the geometric distribution
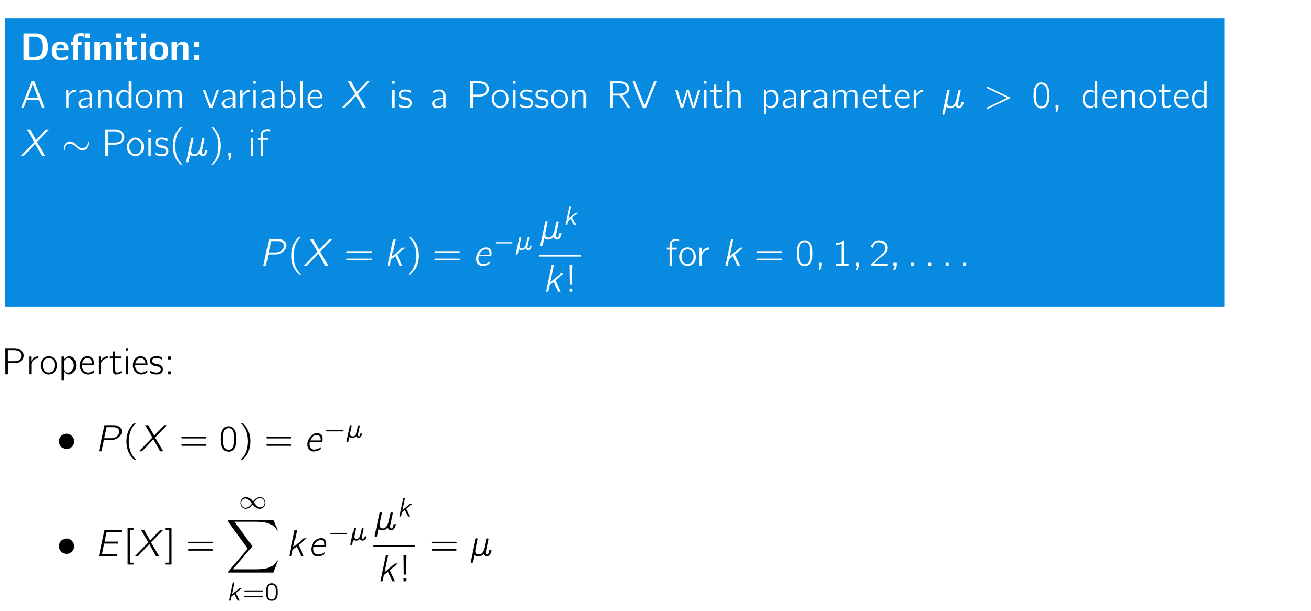
Definition Poisson Variable
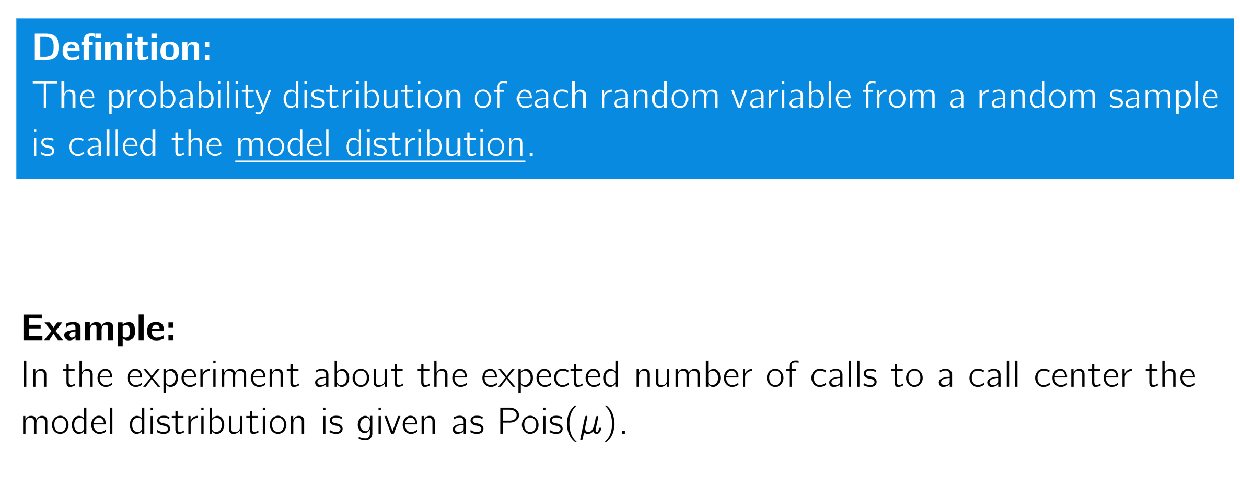
Definition Model Distribution
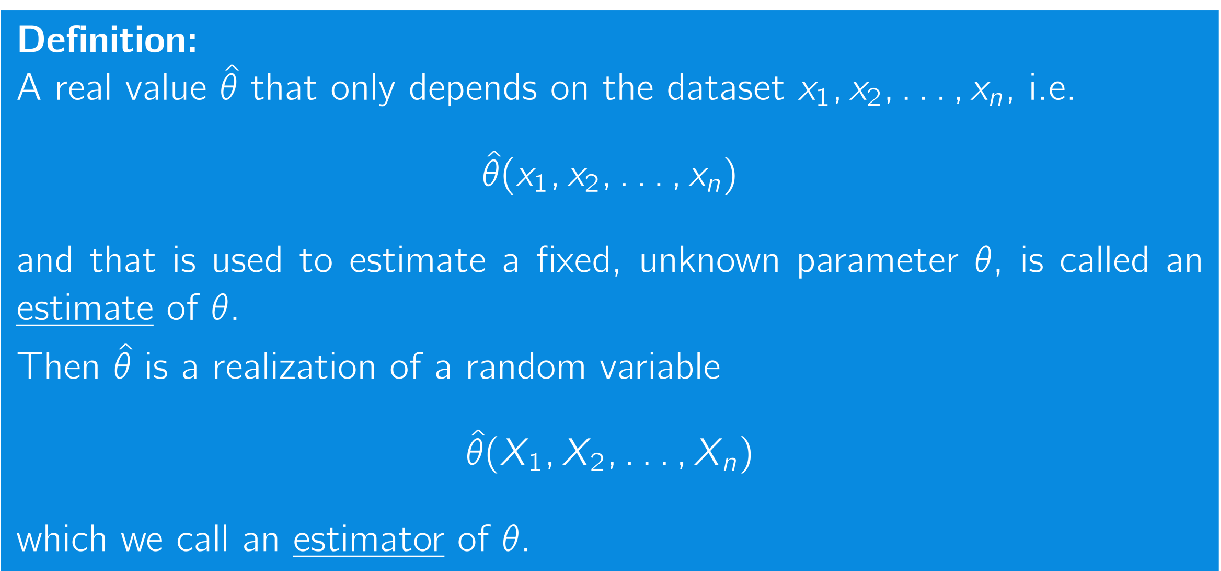
Estimate & Estimator
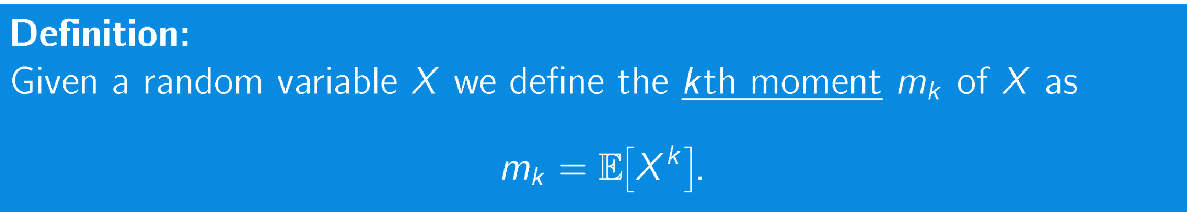
Definition Moment
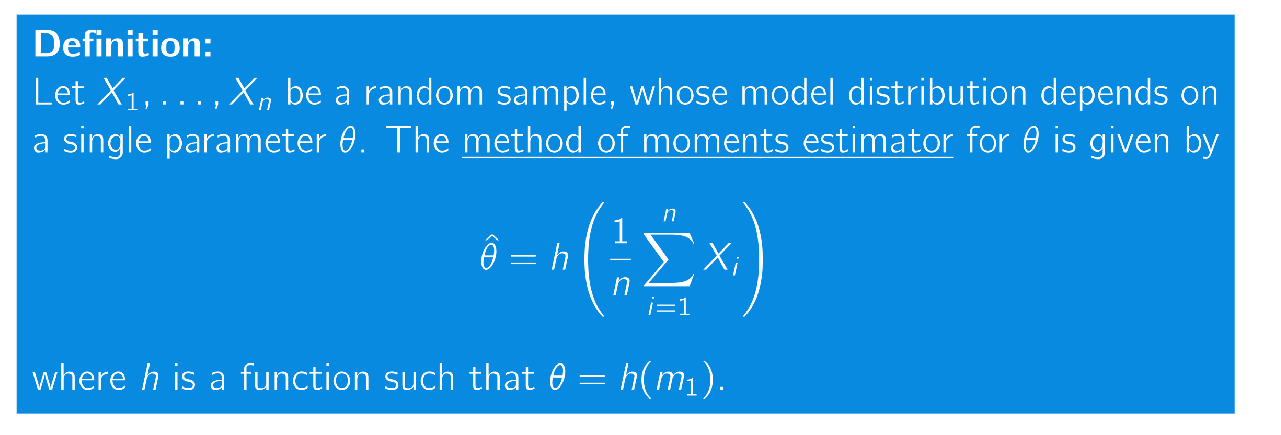
Explain method of moments (1 parameter)
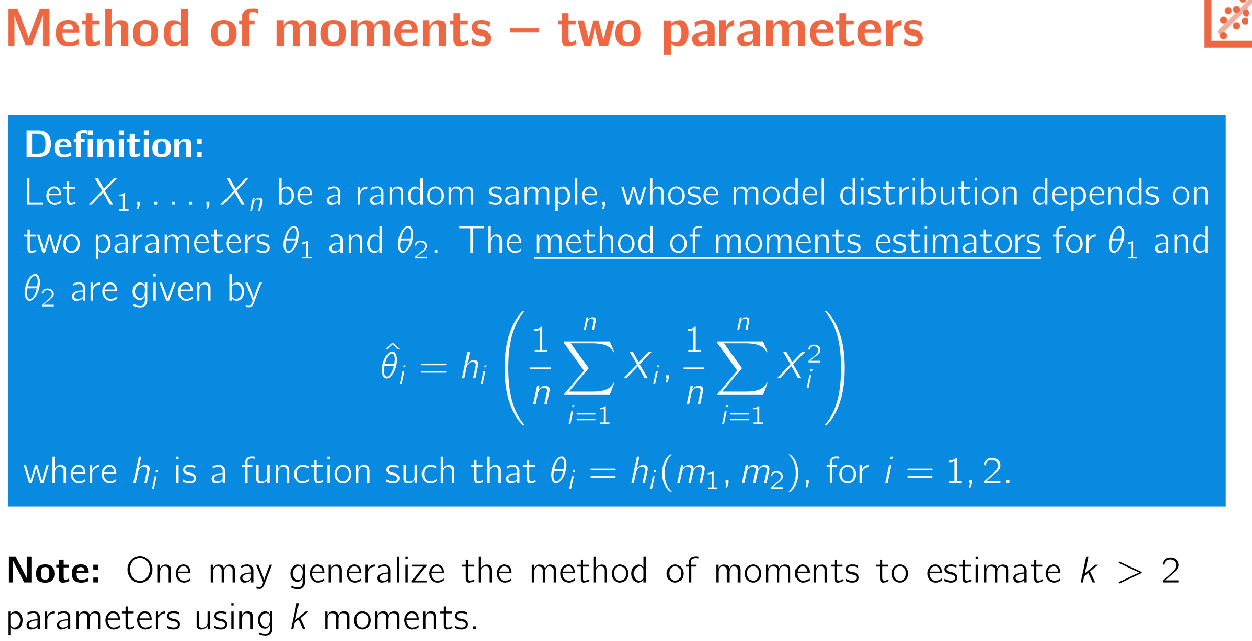
How does method of moments of 2 parameters work?
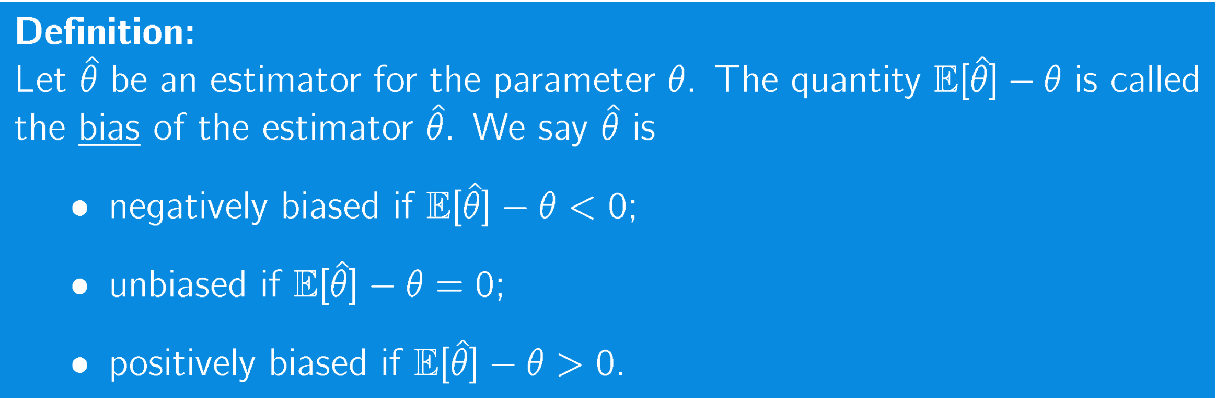
Definition Bias
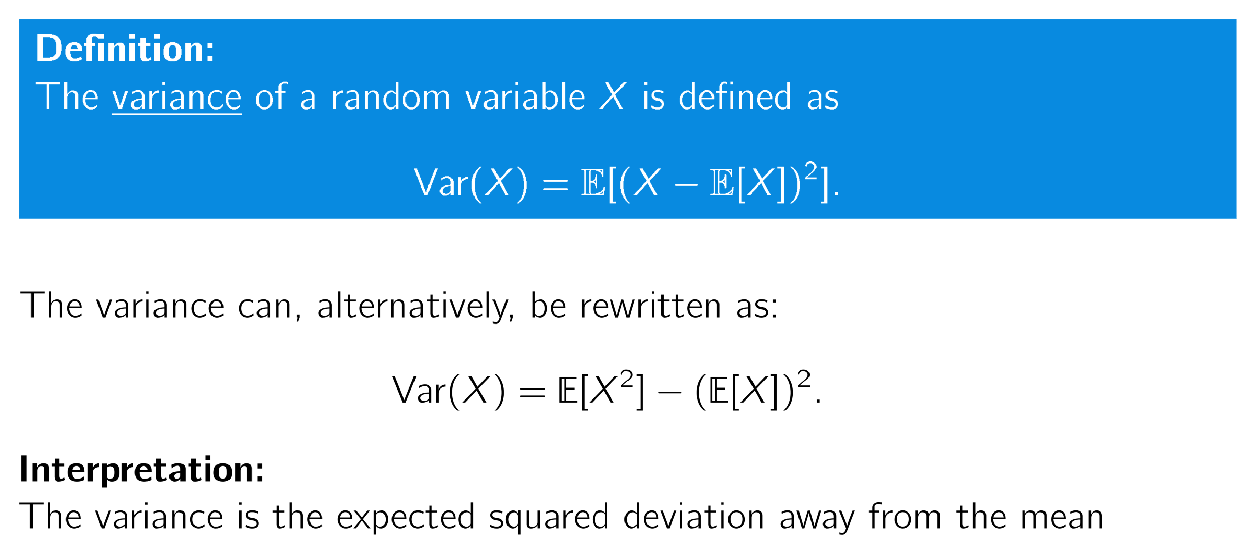
Definition Variance
A measure of the dispersion of a set of values, calculated as the average of the squared differences from the mean. It quantifies how much the values in a dataset differ from the mean of the dataset.
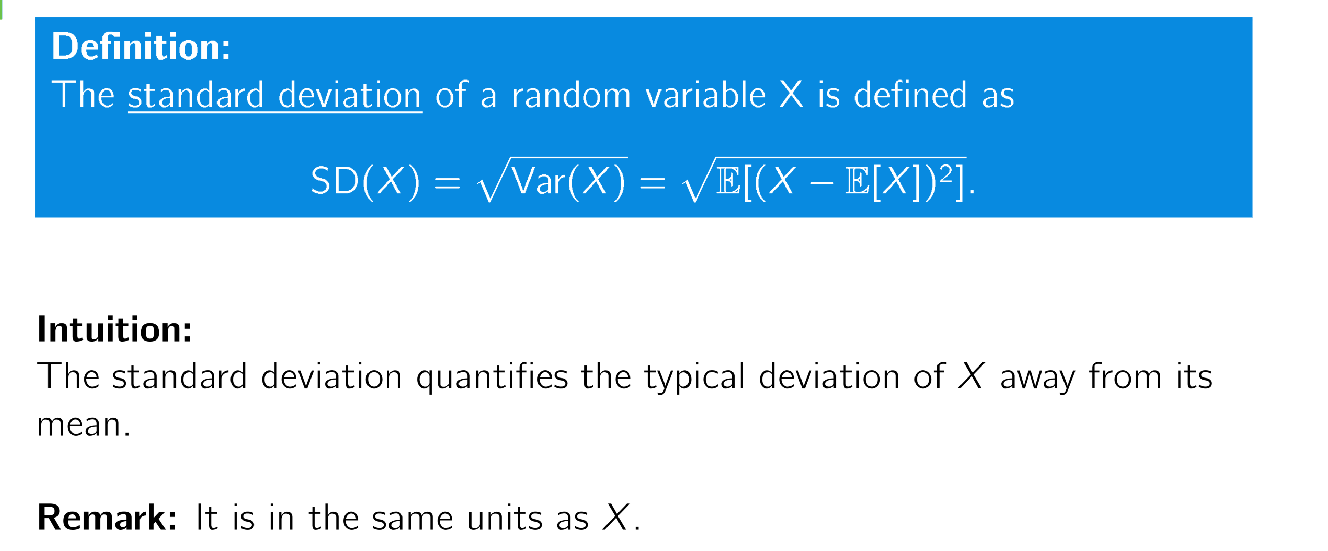
Definition Standard deviation
The standard deviation is the square root of the variance, representing the average distance of each data point from the mean. It provides a measure of the spread or dispersion of a dataset.
overview of expectation and deviation of standard distributions