Research method unit 4 AOS 3
1/26
There's no tags or description
Looks like no tags are added yet.
Name | Mastery | Learn | Test | Matching | Spaced | Call with Kai |
|---|
No analytics yet
Send a link to your students to track their progress
27 Terms
Scientific vs Non-scientific
scientific: Ideas generated through observation and experiment with Empirical evidence (information obtained through direct and systematic observation or experimentation).
Non-scientific: Ideas formed without empirical evidence.
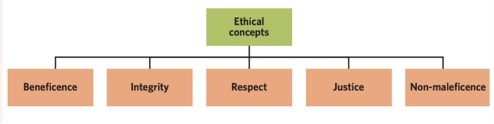
Ethics concepts: (broad, moral guiding principles)
Beneficence: commitment to maximising benefits and minimising the risks and harms.
Integrity: commitment to knowledge and honest reporting information and results, whether favourable or unfavourable.
Respect: consideration of living things have an intrinsic value, giving due regard to the welfare, liberty and autonomy, beliefs, perceptions, customs and cultural heritage of both the consideration living things to make own decisions; and when living things are empowered and protected.
Justice: moral obligation that there is fair consideration of competing claims; no unfair burden on a particular group, fair distribution and access to the benefits of an action. Right to be treated fairly, ensuring people’s differences are also accounted for.
Non-maleficence: avoiding causing harm, the harm resulting from any position or course of action should not be disproportionate to benefits.
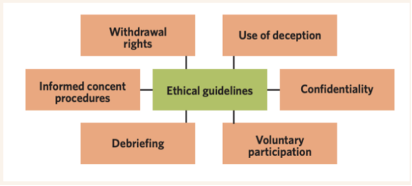
Ethical guidelines: (principles used to ensure that participants are safe and respected. Must be approved by an ethics committee that ensures the study is designed in a way that meets ethical standards).
Confidentiality: protection and security of personal info, including the removal of identifying elements.
Informed consent: ensure participants understand nature and purpose of the experiment, including potential risks (both physical and psychological), before agreeing to participate in the study.
Deception: intentionally misleading participants about the nature of a study. Only permissible when participants’ knowledge of the purpose of experiment affects behaviour while participating in study. Only when necessary.
Debriefing: at the end of experiment, participant leaves understanding experimental aim, results and conclusions. Must be conducted at the end of every study.
Voluntary participation: no pressure put on the participant to partake in an experiment, choose to be involved.
Withdrawal rights: right of participants to discontinue their involvement in an experiment at any time, without penalty.
RESEARCH METHODOLOGY:
Name | Definition | Strengths | Limitations |
Case study | An in-depth investigation of an individual, group, or particular phenomenon (activity, behaviour, event, or problem) that contains a real or hypothetical situation and includes the complexities that would be encountered in the real world. |
|
|
Classification and identification | Classification: Arrangement of things into sets (i.e grouping mental disorders based on symptoms). Identification: recognition of phenomena as belonging to particular sets (i.e when a clinical psychologist may diagnose a patient with a mental disorder based on the existing sets from classification) Classification organises mental disorders into groups based on symptoms, while identification is the process of recognising which group a person’s symptoms belong to (diagnosing). |
|
|
Controlled experiments |
Experimental designs:
|
|
|
Correlational study | Type of non-experimental study in which researchers observe and measure relationship between two or more variables without any active control or manipulation Correlations can be:
|
|
|
Fieldwork | Any research involving observation and interaction with people and environments in real- world settings, conducted beyond the laboratory. |
|
|
Literature review | The collation and analysis of secondary data related to other people’s scientific findings to answer a question or provide background information on a study. |
|
|
Modelling | The construction and/or manipulation of either a physical model, such as a small- or large-scale representation of an object, or a conceptual model that represents a system involving concepts that help people know, understand, or simulate the system (eg a plastic brain to look at) |
|
|
Product, process or system development | The design or evaluation of an artefact, process, or system to meet a human need, which may involve technological applications, in addition to scientific knowledge and procedures (eg meditation apps). |
|
|
Simulation | A process of using a model to study the behaviour of a real or theoretical system. This can allow us to see how variables interact in a system without using real people for a test. |
|
|
Control and experimental groups:
Experimental group: the group of participants in an experiment who are exposed to a manipulated independent variable (i.e. a specific intervention or treatment).
A control group: the group of participants in an experiment who receive no experimental treatment or intervention in order to serve as a baseline for comparison.
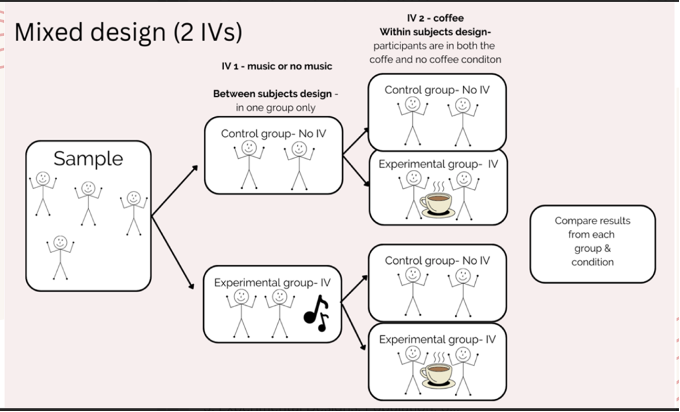
Experimental designs:
Between-subjects: individuals are divided into different groups and complete only one experimental condition.
Within-subjects design: which participants complete every experimental condition.
Mixed design: combines elements of within-subjects and between- subjects designs.
Experimental designs: strengths and weaknesses.
Experimental Design | advantages | Disadvantages |
Within subjects | • Ensures results are more likely due manipulation of the IV. • Less people needed because each participant completes each experimental condition. • Good for real-world settings (impact of certain teaching methods on learning).
| • It can produce order effects (completing one experimental condition first and then the other may influence how participants perform in the latter condition/s) (e.g. due to fatigue, practice, participants’ expectations, and so on).
• A participant dropping out has a great impact on study (loses two data points instead of one). |
Between subjects | -Less time consuming than within subject design. - No order effects. | - may require more participants than within subjects design.
-Differences between participants can affect results. |
Mixed design | -Allows comparison of results across experimental conditions and across groups. - Allows experimental conditions to be compared to the control group. | - Costly and time-consuming to plan, conduct and analyse.
-Demanding for researchers and assistants to be across multiple methods. |
RESEARCH QUESTION:
WITH A QUESTION MARK AT THE END, encompasses what they are interested in researching, begins with a What? / How? / Could? Short and simple. For example: How could having a pet impact mood?
AIM:
statement outlining the purpose of the investigation. It is a succinct and straightforward sentence that clearly determines the parameters of the experiment. For example: The aim of this study is to investigate the effects of owning a dog on low mood.
HYPOTHESIS:
a testable prediction about outcome of an investigation. Used to see if our hypothesis is supported or rejected. A hypothesis includes: variables (independent and dependent), prediction about the ‘direction’ of the investigation, conditions of the experiment (eg. Control and experimental groups).
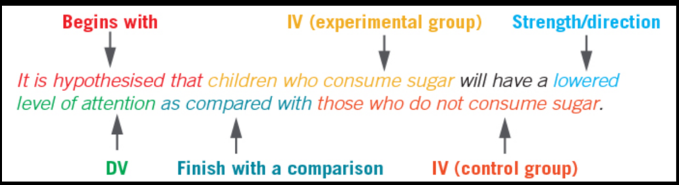
IV DV and CV
• Independent variable (IV) - variable manipulated (quantities are manipulated - controlled, selected or changed- by the researcher)
• Dependent variable (DV) - variable measured (measured in the experiment for changes caused by the IV)
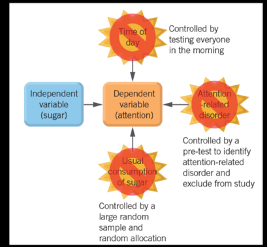
• Controlled variables - variables held constant to ensure that the only influence on the dependent variable is the independent variable.
Sampling techniques
Name | Definition | Strengths | Weaknesses |
Random | Choosing people by chance (an equal chance of being selected). |
|
|
Stratified | Dividing the population into groups (strata) and randomly sampling from each group. |
|
|
Convenience sampling: sampling method where researchers select participants who are "convenient" or immediately available to them.
Populations:
The population of an experiment refers to the group of people who are the focus of the study and from which the sample is drawn. Psychologists must decide exactly who the study is about. For example if you were doing research on revision techniques you might specifically look at year 12 VCE students.
Sample:
A sample is a smaller group of people taken from a larger population to take part in a study. Researchers use samples because it’s usually too difficult to study everyone in the population. For example, instead of studying all Year 12 VCE students, a researcher might study 100 students as the sample. Samples should be representative, meaning they accurately reflect the population (e.g. similar mix of characteristics). A sample is more representative if it is larger and if good sampling methods are used.
Allocation:
Allocation is how you decide the number of people/items to select from each group (stratum) in a sample. Eg; If a population is 60% female and 40% male, allocation decides how many females and males go into your sample (e.g. 60 females, 40 males in a sample of 100).
types of data: Primary vs secondary
Primary: Primary data is that which is sourced firsthand, for the purpose of addressing the research question. It could be sourced through experimentation, observational studies, or self report.
Secondary: Secondary data is that which is sourced through someone else’s research or data sources. It could be sourced through a literature review or through data modelling.
types of data: subjective vs objective
Subjective: Data that relies on assumptions or personal experience.
Objective: Data that can be directly observed or measured.
types of data: qualitative vs quantitative
Qualitative data: Data that is descriptive.
Quantitative data: Data that are numerical and categorical.
types of measure of center
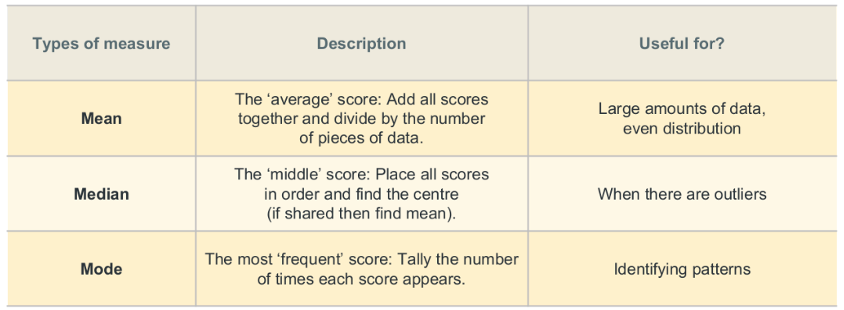
measures of spread
Range: difference between the highest and lowest scores in a distribution.
Standard deviation: measures the spread of scores around the mean. The higher the standard deviation, the greater the range of values within the sample.
ways to show data
Tables: Tables are a way of organising data and/or summary statistics to clearly compare the results of different groups in a study. If data cannot be presented in one or two sentences, then a table should be used instead of explaining the data in the text of a report. Tables are useful to highlight important data for the reader to find quickly. They are used instead of graphs when showing precise values is more important than showing trends and patterns.
Bar graphs: (also known as bar graphs or column graphs) are used to display data that has discrete categories. The height of each bar represents the measured value of one data category. Bars can be drawn vertically or horizontally and should not touch because they represent separate categories. charts should have a legend or key to clearly show what the subsections represent. You can compare several categories quickly using a bar chart and they are most useful for presenting data that has larger differences among categories.
Line graphs: Line graphs are used when data is numerical and continuous. The straight line shows how one data point continues to the next, and estimates the values between the points. Line graphs are useful in tracking small changes over time to visualise overall trends and patterns in data.
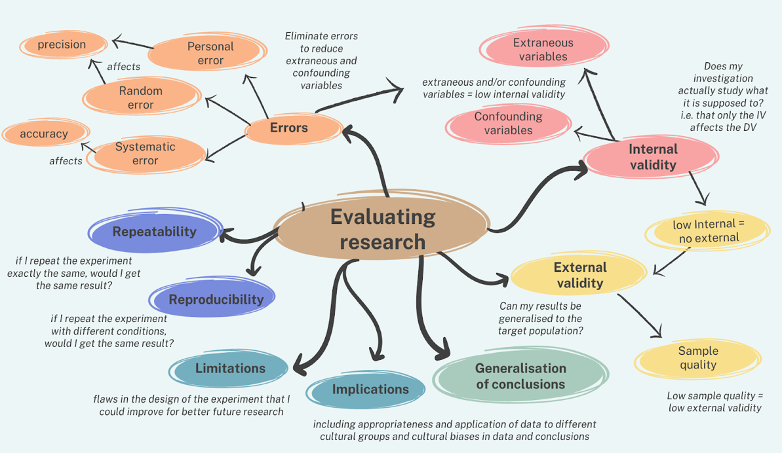
types of variable that are sources of uncertainity
Extraneous: Any variable, not the independent variable, but may affect the results (dependent variable) of the research. Should be controlled, or monitored, so that they do not threaten internal validity of the investigation. Might have impacted results.
Confounding: Variables that have affected the results (dependent variable), apart from the independent variable. May have been an extraneous variable that has not been controlled for, or variable that cannot be controlled for. Interfere with internal validity of investigation. Has had an impact on results.
error and true value
Errors: difference between measured value and true value of what is being measured (not a ‘mistake’).
True value: The value or range that would be found if the quantity could be measured perfectly. Obtaining would require no error to occur when using instruments to take measurements and collect data and when processing and reporting the data. Cannot always be determined. Sometimes, instruments can be calibrated against their true value to test whether they are measuring perfectly.
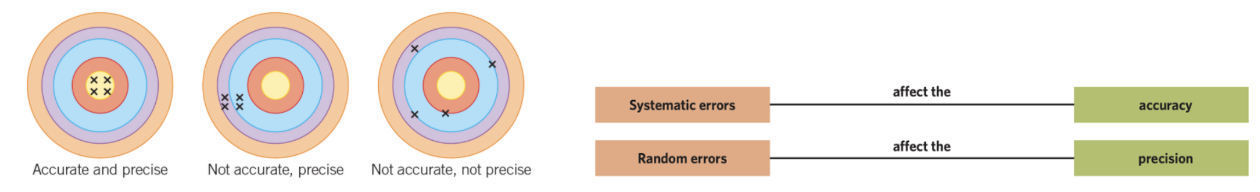
ACCURACY AND PRECISION: measure of correctness of measurement.
Accuracy: how close a measurement is to the true value of the quantity being measured. (In psychology, accuracy is not numerically; measurement values are simply described as more accurate or less accurate).
Precision: how closely a set of measurement values agree with each other.
gives no indication of how close measurements are to true value
Possible for accurate but imprecise, and possible for a measurement to be precise but inaccurate.
REP: random, each other (relative to), precision.
SAT: systematic, accuracy, true value (relative to)
types of errors
Personal errors: Personal errors are avoidable human mistakes (carelessness, bias, misreading) that skew results, often acting as a form of systematic error. (misreading a scale on a thermometer as 35 oC rather than 25 oC)
Random errors: are unavoidable, unpredictable, small fluctuations caused by environmental changes or instrument limitations that vary in direction. Affect precision (consistency) of measurements and occur in almost all measurements (except counting).
You can reduce random errors by:
repeating measurements and finding the average (mean)
increasing the sample size
improving the method or technique
Example:
If someone repeats a memory test over time, boredom might randomly affect their scores, making them sometimes higher or lower than their true ability.
Systematic errors: affect the accuracy (correctness) of measurements. Their bias results in one direction, meaning values are consistently too high or too low compared to the true value. They are caused by things like:
Incorrectly calibrated or misused instruments
Environmental interference
Observational errors
Flawed experimental methods
These errors produce a consistent difference from the true value (not random spread). Important: Repeating measurements does NOT fix systematic errors. You can reduce them by:
checking and calibrating instruments properly
understanding instrument limitations
improving and correcting the experimental method
Example:If an EEG machine is miscalibrated, all readings may be consistently too high or too low. Or, if participants expect a probiotic to reduce anxiety, their reported improvement may be biased (not due to the actual treatment).
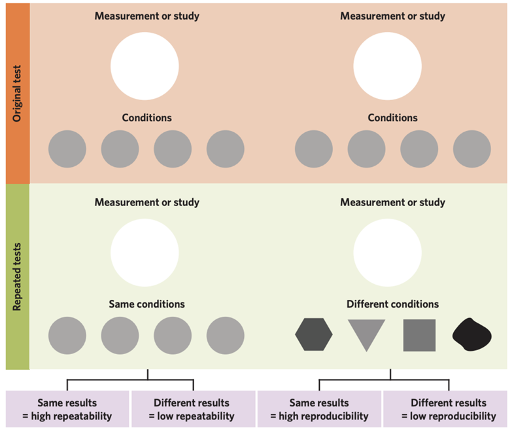
Repeatability and Reproducibility
Repeatability: the extent to which measurements or studies produce the same results when carried out under identical conditions within a short period of time. If results can be reproduced by different researchers with different methods of measurement, measuring instrument, location, time /culture, the results are called true findings. For example, if one research team determined one set of findings and the second research team determined a different set of findings from a similar investigation, then OG results are not reproduced. May be due to an error in one of the studies or an undetected difference in the way the second study was conducted, which should be considered before determining the overall credibility of the investigation.
Reproducibility: is extent to which measurements or studies produce the same results when repeated under different conditions. A study can be considered in terms of whether it is replicable, or whether it lacks credibility because it is irreplicable. If results from a study are to be meaningful, they should be reproducible and replicable, with the same findings being determined when the study is reproduced or replicated under different conditions by a different researcher.
Repeatability measures the consistency of results produced by the same team, using the same methods and equipment, in a short timeframe. Reproducibility measures if independent researchers can obtain the same results using different teams, instruments, or locations. Essentially, repeatability tests consistency, while reproducibility tests verification.
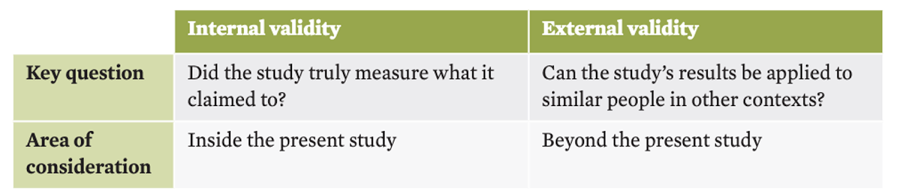
Types of Validity:
Validity: extent to which psychological tools and investigations support their conclusions. A valid measure is one that measures what it intends to measure. Two distinct types of validity: internal validity and external validity
Internal validity: extent which investigation truly measures what it claims to. When lacking, results may not be true and a conclusion cannot be drawn.
To achieve internal validity need to consider:
the adequacy of measurement tools and procedures
the adequacy of the experimental design.
the adequacy of sampling and allocation procedures.
whether the independent variable truly affected the dependent variable
External validity: is only considered when internal validity is present. Extent to which results can be applied to similar individuals in different settings. External validity can be improved by:
●Using sampling procedures that create a more representative sample
●Having broad inclusion criteria
●Using a larger sample size.