Correlation (I)
1/16
There's no tags or description
Looks like no tags are added yet.
Name | Mastery | Learn | Test | Matching | Spaced | Call with Kai |
|---|
No analytics yet
Send a link to your students to track their progress
17 Terms
Predicting correlation between variables (practice vs performance)
Relationship: Positive association results from:
Variables: Practice ↔ Performance
Meaning: As practice increases, performance improves
Direction: Bidirectional link (they influence each other)
Key idea: More maths practice → better maths performance
Do changes in one variable tend to be associated with specific changes in the other variable?
Variables measured:
Practice (hours/week), mean = 4.6
Performance (problems solved), mean = 6.2
Research question: Do the variables covary?
Key idea: Looking for association, not just averages
Method implication: Need to compare patterns across individuals (not means alone)
Conclusion: Cannot tell from means alone whether practice and performance are related; need correlation/relationship analysis
How do we assess the relationship between two variables?
Goal: Determine if two variables are related (e.g., practice & performance)
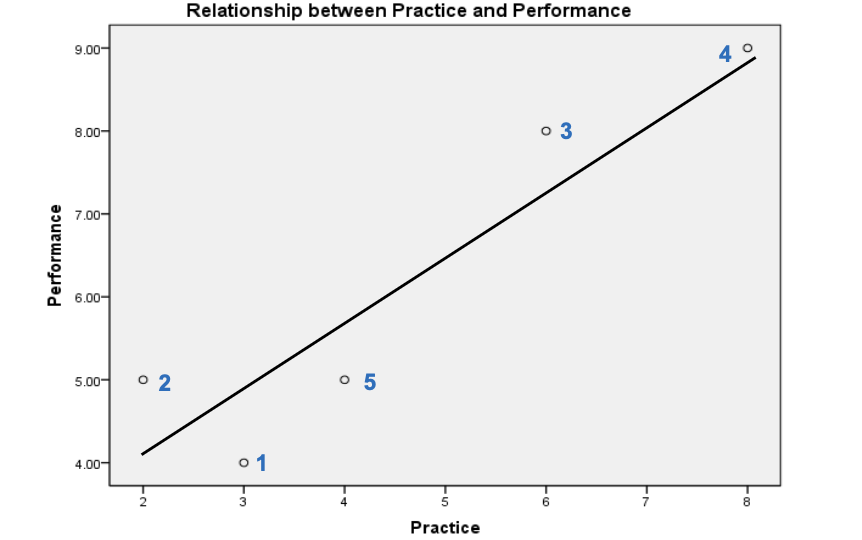
Pictorial method: Scatterplot
Shows pattern of association visually
Numerical method: Correlation coefficient
Quantifies strength and direction of relationship
Key idea: Use both visual and statistical approaches for full understanding
How do you create a scatterplot in IBM SPSS?
Go to Graphs → Legacy Dialogs → Scatter/Dot
Select Simple Scatter → Define
Assign variables:
Drag first variable to X-axis (IV in experiments)
Drag second variable to Y-axis (DV in experiments)
For correlations, either variable can go on either axis
Click OK to produce scatterplot
What types of relationships can be seen in a scatterplot?
Positive association: Higher practice → higher performance
Negative association: Higher practice → lower performance
Perfect positive association: Exact match; increases in practice perfectly predict increases in performance
Perfect negative association: Exact match; increases in practice perfectly predict decreases in performance
No association: No consistent pattern between practice and performance
Non-linear association: Relationship exists but follows a curved (not straight-line) pattern
What three aspects of a relationship can a scatterplot show?
Direction:
Upward trend (bottom-left → top-right) = positive
Downward trend (top-left → bottom-right) = negative
Strength:
Points tightly clustered around a line = strong relationship
More scattered points = weaker relationship
Form:
Straight line fit = linear relationship
Curve fits better = non-linear relationship
How do we interpret a scatterplot and quantify the relationship?
Direction: Upward line (bottom-left → top-right) = positive relationship
Strength: Points closely clustered around the line = strong relationship
Form: Straight-line fit = linear relationship
Numerical assessment: Use Pearson’s correlation coefficient (r)
Important condition: Pearson’s r is only appropriate for interval-scale data
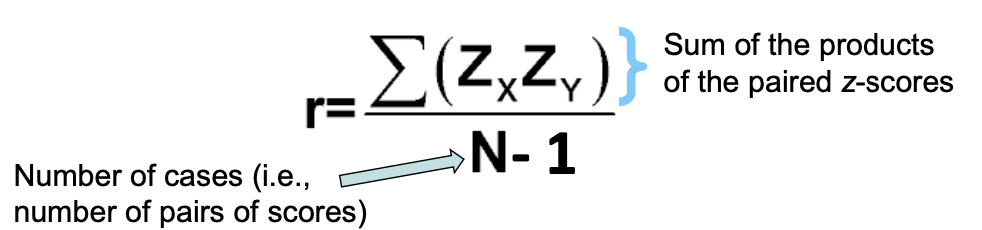
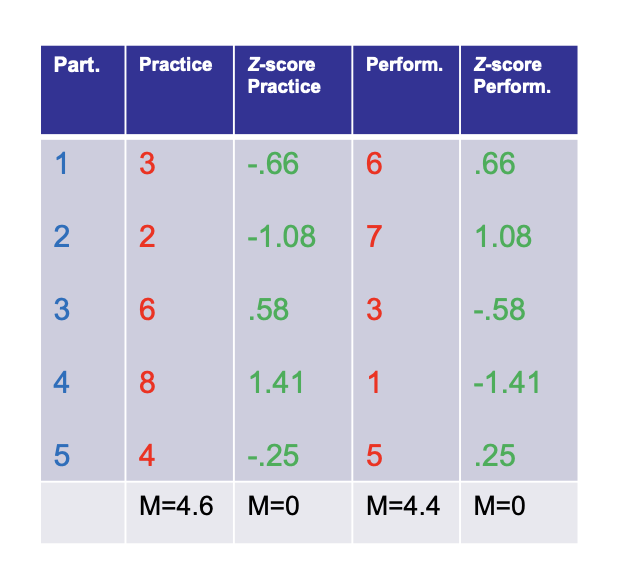
How do you calculate Pearson’s r using Z-scores?
1. Convert all raw scores to Z-scores
2. Multiply paired Z-scores for each participant
3. Sum all products of Z-score pairs
3. (a) Divide by (number of cases − 1)
Example: (0.66 + 0.59 + 0.48 + 1.82 + 0.14) ÷ 4 = 0.92
What are key steps and rules when calculating Pearson’s r using Z-scores?
Z-score formula: (Raw score − Mean) ÷ SD
Purpose of Z-scores: Standardises data (Mean = 0, SD = 1) to show distance from the mean
Interpretation: Larger distance from mean → larger impact on correlation
Multiplying Z-scores:
Both positive or both negative → positive product
One positive + one negative → negative product
Key idea: Pearson’s r is based on the pattern of these Z-score products across participants
What is Pearson’s r formula and how do we interpret it?
Range: -1 to +1
+1 = perfect positive correlation
-1 = perfect negative correlation
0 = no linear correlation
Positive r: Most Z-score products are positive (both scores same sign)
Negative r: Most products are negative (opposite signs)
Strength idea: Farther from mean → larger product → stronger r
Note: Different formulas exist, but all give the same Pearson’s r result
When does a perfect positive correlation occur?
Occurs when Pearson’s r = +1
Each participant has equal Z-scores for both variables (ZX = ZY)
Both variables deviate from their means by the same amount and in the same direction
Pattern: as one variable increases, the other increases perfectly in step
Key idea: identical standardized deviations → perfect positive association
When does a perfect negative correlation occur?
Occurs when Pearson’s r = −1
Each participant has equal Z-scores in magnitude but opposite signs (ZX = − ZY)
Both variables are equally distant from their means but in opposite directions
Pattern: as one variable increases, the other decreases perfectly in step
Key idea: mirror-image standardized deviations → perfect negative association
When is a correlation undefined in a scatterplot?
Occurs when one variable has no variation (all scores identical)
Scatterplot becomes:
Horizontal line (if Y is constant)
Vertical line (if X is constant)
No relationship can be calculated because covariance is zero/undefined in this case
Result: Pearson’s r cannot be computed
In SPSS: output shows correlation is undefined or not computable
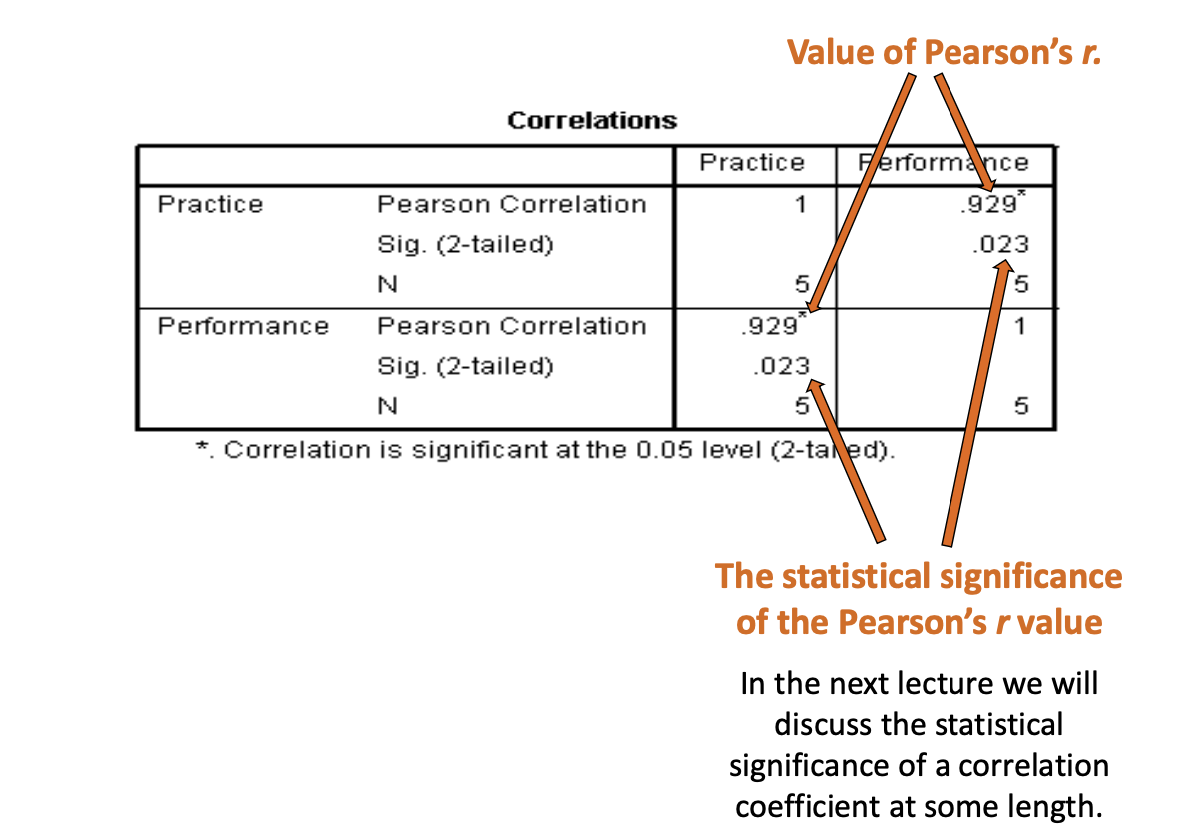
How do you obtain Pearson’s r in IBM SPSS?
Go to Analyze → Correlate → Bivariate
Move variables into the Variables box
Select Pearson under Correlation Coefficients
Choose one-tailed or two-tailed test of significance
(Optional) Click Options to request:
Means
Standard deviations
Cross-product deviations
Covariance
Click OK to run the analysis
How to understand the IBM-SPSS output for Pearson’s r?
How do you report results of a Pearson correlation?
State that a Pearson correlation was conducted
Describe the relationship (e.g., positive/negative association)
Report whether it is statistically significant
Include key details:
r value (strength/direction)
sample size (n)
p-value (significance level)
one- or two-tailed test
Example format: r = .93, n = 5, p < .05, two-tailed
Outline how to describe results of correlation?
A Pearson correlation was computed for the relationship between maths practice and performance. This revealed that these variables were, as predicted, positively related and that the correlation was statistically significant (r = .93, n = 5, p < .05, two-tailed).