AP microecon unit 2
1/92
There's no tags or description
Looks like no tags are added yet.
Name | Mastery | Learn | Test | Matching | Spaced | Call with Kai |
|---|
No analytics yet
Send a link to your students to track their progress
93 Terms
Law of Demand
If ↑ price then ↓ quantity demanded
If ↓ price then ↑ quantity demanded
market =
forms when multiple parties exchange things of value
strong property rights =
exclusively owned
enforceable against thieves
transferrable
demand =
all demand in the economy, the entire downward sloping curve
quantity demand =
# of goods demanded at a certain price point on demand curve
factors affecting demand
expectations of future price
income
population
preferences
substitution
normal good =
w/ more money ppl buy more, w/ less money ppl buy less
inferior good =
more money ppl buy less, buy more of another better good
market graph (draw)
expectations of future price (D)
expect to be higher = demand inc
expect to be lower = demand dec
income (D)
income inc = demand inc
income dec = demand dec
*only for normal goods
population (D)
pop inc = demand inc
pop dec = demand dec
preferences (D)
preference/popularity inc = demand inc
preference/popularity dec = demand dec
substitution
other products prices go up = demand inc (ours is cheaper)
other products prices go down = demand dec (theirs is cheaper)
substitution effect
people may not actually want more of a good, it might be a better deal compared to other goods
law of supply
If price inc → quantity supplied inc
If price dec → quantity supplied dec
factors affecting supply
price of input
price of related goods
# of suppliers
technology
expected future prices
taxes/subsidies
price of input aka land,labor,capitol (S)
price of inputs inc = supply dec
price of inputs dec = supply inc
price of related goods (S)
price of related good inc = supply dec (more lucrative to produce other good)
price of related good dec = supply inc (more lucrative to produce our good)
number of suppliers (S)
number of suppliers dec = supply dec
number of suppliers inc = supply inc
technology (S)
tech devolves = supply dec
tech evolves = supply inc
expected future prices (S)
prices expected to inc = supply dec (sell later at higher price)
prices expected to dec = supply inc (sell now at higher price)
taxes/subsidies (S)
inc taxes/dec subsidies= supply dec
dec taxes/inc subsidies = supply inc
*subsidies mean govt gives money
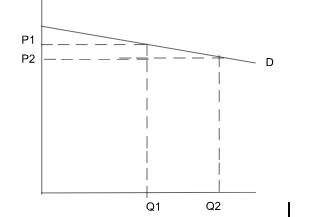
Elastic (D) =
small price change → big quantity change
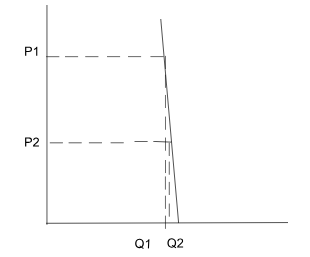
Inelastic (D) =
big price change → small quantity change
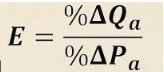
price elasticity of demand =
measuring how sensitive quantity is to price changes (very sensitive = elastic, not sensitive = inelastic)
high elasticity =
more horizontal demand curve
low elasticity =
more vertical curve
determinants of price elasticity of demand
substitutes
timeframe
income share
luxury v. necessity
narrowness do the market
substitutes (PEoD)
Many = more elasticity
Few = less elasticity
timeframe (PEoD)
Short time frame = less elasticity
Long time frame = more elastic
income share (PEoD)
Lower income share (less of ppl’s budget) = less elastic
Higher income share (more of ppl’s budget) = more elastic
luxury v. necessity (PEoD)
Necessity = less elastic (b/c need it so always need similar amount like prescriptions)
Luxury = more elasticity
narrowness of market (PEoD)
Narrower definition of market (apples) = more elasticity
broader definition of market (food) = less elasticity
perfect inelasticity
(within reason) any change in price will not change the quantity purchased
perfect inelasticity =
0
perfect elasticity =
infinity (∞)
constant unit elasticiy
% dec/inc in price = % inc/dec in quantity
Ex. 10% dec in price → 10% inc in quantity
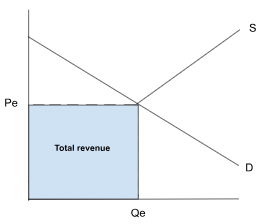
total revenue =
price * quantity
When elastic, a change in price means
Price dec = total revenue inc
Price inc = total revenue dec
When inelastic, a change in price means
price dec = total revenue dec
Price inc = total revenue inc
When unit elastic, a change in price means
total revenue stays the same between the 2 prices
region between 2 numbers is unit elastic
midpoint =
unit elastic
above midpoint =
elastic
below midpoint =
inelastic
Price Elasticity of Demand formula (write =
Q = quantity demanded
inelastic situation =
|E| < 1
elastic situation
|E| > 1
unit elastic situation
|E| = 1
% change =
(new-old)/old *100
explanation for elasticity
when price of inc/dec by %, quantity demand of dec/inc by %
elastic & taxes
producers assume most of the burden (b/c quantity demanded dec but price stay the same)
some DWL, but only from producerse
inelastic & taxes
consumers assume most of the burden (b/c have to buy same amount but more expesnive
no DWL
Price Elasticity of Supply (write) formula
Q = quantity supplied

Price elasticity of supply determinants
time frame
time frame (PEoS)
long run = more elastic (b/c can get more resources)
short run = less elastic (b/c can’t get more resources)
Income Elasticit of Demand (formula)
determins normal v. inferior goods
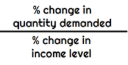
pos v. neg elasticity (IEoD)
positive elasticity = normal good
negative elasticity = inferior
elastic & positive (IEoD)
normal luxury
inelastic & positive (IEoD)
normal necessity
Cross Price Elasticity of Demand
determines if substitutes, complements, or unrelated
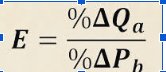
perfect substitutes (CED)
E = infinity/ E>0 = near perfect substitutes
complements (CED)
E<0 & negative
demand of A and price of B are inverse
no relation (CED)
E = 0
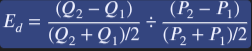
midpoint elasticity formula
works for all types of elasticity
* use ALL THE TIME
Total Revenue Test (check elasticity)
elastic = P & TR are inverse
inelastic = P & TR go in same direction
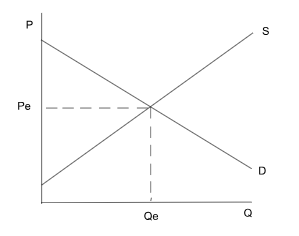
market equilibrium (draw)
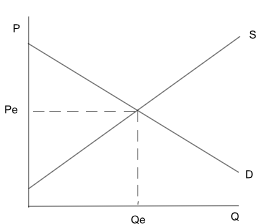
consumer surplus
total marginal benefit that consumers get above price paid (equilibrium)
b/c you could have paid higher (willingness) but you paid less (equilibrium price) so you “save money” so you have a benefit
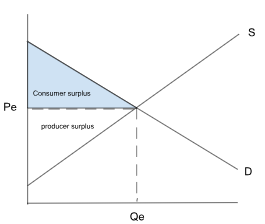
producer & consumer surplus formula
½(b*h)
producer surplus
total marginal benefit above supply line (below supply curve = marginal cost) & below price
Needed certain price to produce a certain quantity (supply line) but are getting paid more to produce same quantity (b/c of equilibrium) so get more money aka benefit
consumer & producer surplus graph
total revenue graph
shifting supply & demand
changes P or Q
if inc/dec on both graph = inc/dec
one will always be indeterminate (on one graph inc, on another dec)
Price Ceilings =
max price set by government
*usually below equilibrium
Dead Weight Loss (DWL)
surplus loss b/c of price control (not efficient)
non-binding v. binding price ceilings
non-binding = doesnt prevent market from reaching equilibrium
binding = prevents market from reaching equilibrium
Price ceiling graph
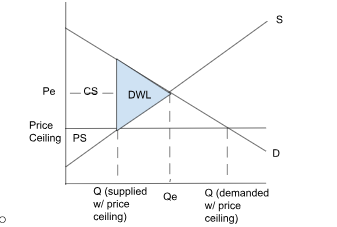
shortage =
Qd > Qs
shortage amount =
Qd - Qs
price floors =
minimum price set by govt
*usually above equilibrium (has no effect below)
price floor graph
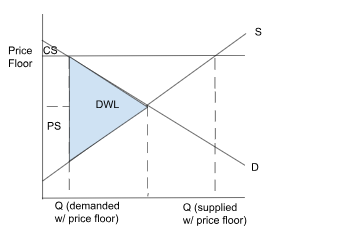
surplus =
Qs > Qd = surplus
surplus amount
Qs - Qd
who suffers in price floor/ceiling
price ceiling = most producers suffer b/c sell at lower price
price floor = all consumers suffer b/c high prices
*ASK GPT
Tax Graph
Pt = price consumers pay
Ps = price suppliers pay
Qt = quantity supplied q/ tax
CS & PS dec
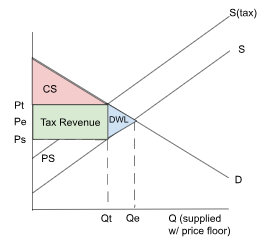
total tax revenue =
size of tax * Qt
tax incidence (burden of tax on market)
(old price - new price) * quantity
shared by buyers & sellers, shows how much surplus dec from CS & PS to become tax revenue
tax on seller/buyer
ta on seller = supply curve move up/down
tax on buyer = demand curve move up or down
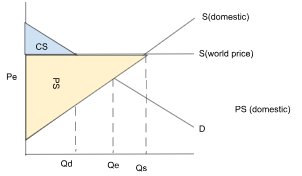
country exporting =
producers win, consumers lose (consumers pay higher price b/c new equilibrium, but producers sell more product)
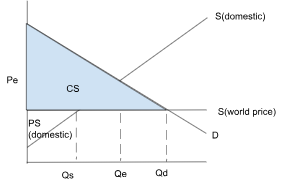
country importing =
consumers win, producers lose (consumers pay lower price, producers don’t get as much revenue)
country import graph
beneficial to everyone except domestic producers b/c total surplus increases
shortage, so importing meets consumer demand
country export graph
beneficial to everyone except domestic customers b/c total surplus increases
surlus, so exporting meets producer needs
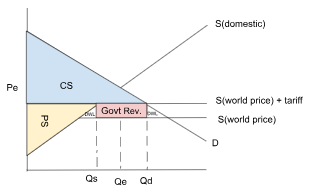
trade w/ tariffs graph
total tariff/govt rev. = size of tariff * import amount (Qd-Qs)