Biostats Final
 Call Kai
 Learn
Learn Practice Test
 Spaced Repetition
 Match
Match Flashcards
 Knowt Play
1/157

There's no tags or description
Looks like no tags are added yet.
Name | Mastery | Learn | Test | Matching | Spaced | Call with Kai |
|---|
No analytics yet
Send a link to your students to track their progress
158 Terms
two main ways parametric and nonparametric tests differ
estimation of parameters/nonparametric does not
nonparametric tests use ranks rather than directly using the raw data
draw a scatter plot for a non-representative data set and a non homogenous data set
non-representative: hourglass shaped
non-homogenous: funnel shaped
what do confidence intervals tell us about how the data collected relates to populations compared to hypothesis testing?
both help us estimate the mean. The p value tells us: how surprising is it that we get this sample mean given it represents the population? The confidence interval then can help us estimate where the mean lies given the sample mean. However, CIs do not involve statistical analysis and are not as strong as p value.
wwhy is it better to have equal n’s
maximize statistical power. If unequal, smaller group have larger standard error. Risks not having homogeneity of variances
p value
The probability of obtaining a test statistic as extreme or more extreme than the one obtained given that the null hypothesis is true
when do you reject the null
when p is less than or equal to alpha
alpha
critical probability/p-value (a probability in which it is too rare to occur just due to chance)
little p variable meaning
expected probability
chi squared equation
sum((O-E)²)/E
how to formally write p value
_ < p < _
what does a probability density function measure
area under a bell curve
what does it mean if the chi square value is zero
oberserved and expected values are equal
critical value of chi square
the chi square value at a specific degree of freedom that creates a rejection zone (ex. 3.84 for 1 degree of freedom)
three types of error (just name them)
experimentor error
chance error
statistical error
experimentor error
accumulating inaccuracies through carrying out an experiment, caused by the experimenter themselves
chance error (how does it relate to standard error)
error due to small sampling. Can be mitigated by increasing n. This decreases standard error because it equals s/√n
statistical error
type I: aka alpha error, you reject the null but it was actually true
type II: aka beta error, you retain the null but it was actually false
Is chi square a statistic?
yes
is a critical value a statistic
no
chi square goodness of fit test used when
there is one nominal variable, tests against model for random chance
chi square test for independence when
you have two nominal variables, calculates expected frequency from the data we collect
what does it mean when two things are independent
they have nothing to due with eachother
degrees of freedom formula for chi square goodness of fit
k-1 (possibilities minus one)
degrees of freedom formula for chi square test for independence
(#rows-1) (#columns-1)
conclusion vs hypothesis
the hypothesis is simple and uses more statistical language, such as “independent of” “does not differ from” “are equally likely”
the conclusion answers the question asked in the experiment, not the hypothesis. It elaborates on/applies the hypothesis to what the experiment seeks to find.
steps of hypothesis testing
state the hypothesis (both null and alternative)
conduct statistical test (such as chi square)
find p value
conclusion
when is Tcv positive vs. negative?
positve when we load confidence to the right, negative when we load it to the left. This is because it should be the same sign as we expect t to be.
What are the appropriate hypotheses for each statistical analysis?
z scores do not involve hypothesis testing. You only convert a value to a z-score to find a probability/area under curve
chi square gof: the null is that the observed frequencies match the expected frequencies.
chi square indep: the null is that the first categorical variable and second categorical variable are independent of each other.
one sample t test: is our sample actually apart of the population we are trying to measure? Null is that the population mean and sample mean are the same.
two sample t test: Compare the means of two independent groups. Null is that the means of two samples are the same.
paired t test: Compares the means of two related measurements. So the null is that the difference between the two means is zero.
Mann Whitney U: Non-parametrically compared the means of two independent groups. Null is that the two groups are the same (not their means!!)
ANOVA: Compares the means of more than two independent groups. The null is that the means of each group are the same.
Tukey: means of each pairing are the same
what exactly does the z score/distribtion tell you?
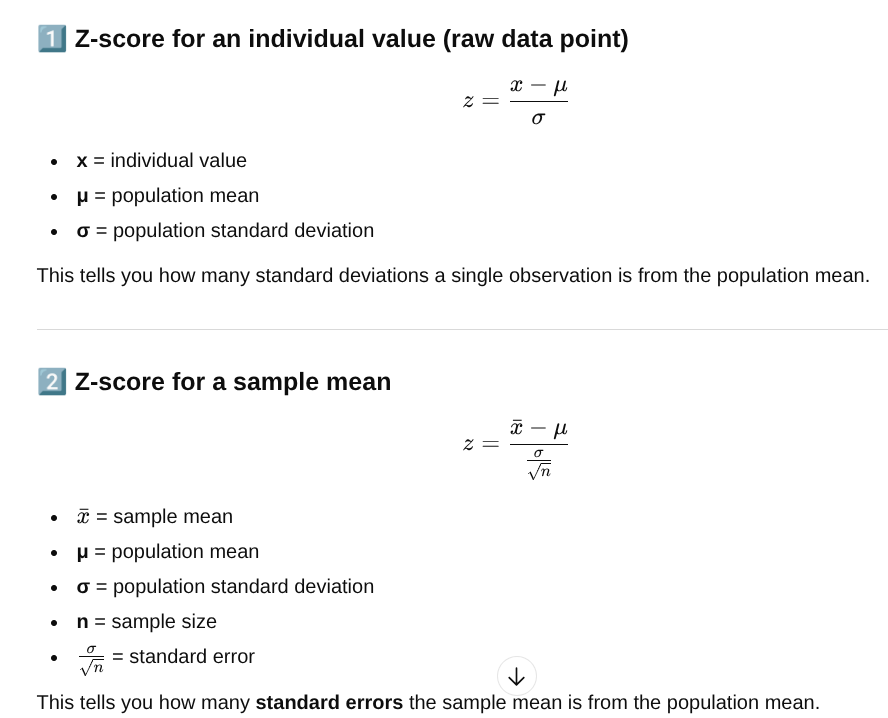
it tells you how far away a value (either a value obtained from an individual in the sample, or a sample mean) is from the mean, specifically in standard deviations. From it you can obtain the probability of a test statistic to the extreme of z occuring, given null is true.
Every z score corresponds to a specific area under the curve (+ or -). The table will tell you the area under the curve to the extreme of the z score. So if you have a negative z score, the table tells you the area to the left of that. If you have a positive z score, the table tells you the area under the curve to the right of that.
what exactly does the t score/distribtion tell you, how does it relate to p?
How many standard errors your sample statistic is away from another mean (population or other sample)
A t value measures how many standard errors the sample mean is away from the hypothesized population mean, or how far away it is from the null expectation. That t value is then used to calculate a p-value, which represents the probability of observing that t value or one more extreme given the null hypothesis is true. (asking: how surprising is it that we got this t value?)
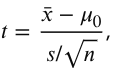
one sample t test
tells you whether the sample came from the population we are trying to test. Null is that there is no significant difference between the two, and the sample came from the pop.
two sample t test
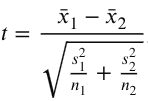
compares whether experimental population represents a different population than the control, or whether two independent groups are different from eachother (NO OVERLAP BETWEEN GROUPS). The null is that there is no difference between the two. (example drug vs. control in different patients, male vs female students)
Can’t just add the two standard errors because it inflates variability. This formula helps avoid assumption of equal variances between the two 2 samples.
paired t test
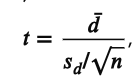
Compares whether two related/non-independent groups are significantly different from each other. Null is that there is no difference. (example: brain vs. body temp in the same animal, same patients before and after a drug, identical twins with one receiving drug a and one receiving drug b)
how to calculate different confidence intervals
one sample: y bar ± t (subscript CV) x SEy
for Tcv find the critical value with the df
two sample
y bar 1 - y bar 2 ± t(CV) x (SEy1-SEy2)
paired
same as one sample but with d not y
what exactly is the definitition of a confidence interval
for estimating Mu and making a confidence interval: Mu at 95% confidence is between +2SEy and -2SEy from y bar
for sampling distribution/meta experiment: 95% of y bars in a sampling distribution lie between ±2SEy from Mu
for a population distribtuon: 95% of yi’s in a population lie between ±2sigma of Mu
strategy of finding d in a paired t test??
It depends on what you are looking for in an experiment and what your null hypothesis is. You can technically do either, you just have to make sure your wording is consistent. You can set the t equation to give you a positive t, which means that the mean of the first group is HIGHER than that of the second group (aka there was a decrease from the first to second group).
You can also set the equation to give you a negative t, which means the mean of the first group is LOWER than the second group (aka there was an increase from the first to second group)
critical value/how to interpret it
A critical value is a threshold that tells you how extreme a test statistic has to be to reject the null hypothesis.
when to use a(1) vs a(2) in a t-dist
depends on where you want to load confidence. If you only load it into one tail, you want to see if a mean is less than or more than, rather than just different. If the hypothesis is not directional and you want to test both extremes, you can load it into two tails to see if the mean could be less or more, you are testing for both here not just less than or more than (is the sample mean unequal to the pop. mean)
example: use a(1) when you want to test if the sample mean is larger than the population mean. Therefore you would load confidence to the left, because you are looking for a probability of the sample mean being in that area aka above the population mean.
making conclusions???
Include whether there is a significant difference between the two means. Then apply that if possible. What could be causing the absence/presence of this difference?
define a normal distribution and its equation
a continuous probability distribution describing a bell shaped curve, and can be used to approximate frequency distributions.
Qualities of the normal distribution
has a function for a bell curve
mean=median=mode
empirical rules apply
no kurtosis
(can be applied to the probability density function → probability of a variable falling into a specific range across the distribution, the porb. density is highest at the mean)
list the empirical rules in the context of a confidence interval and estimating mu
ȳ±1(SEȳ) →_a_<μ<_b_
I am 68% CONFIDENT that μ is between a and b.
ȳ±2(SEȳ) →_a_<μ<_b_
I am 95% CONFIDENT that μ is between a and b.
ȳ±3(SEȳ) →_a_<μ<_b_
I am 99.7% CONFIDENT that μ is between a and b.
list the empirical rules in the context of a sampling distribution
~68% of sample means (y-bars) should lie within ±1SE of µ
~95% of sample means (y-bars) should lie within ±2SE of µ
~99.7% of sample means (y-bars) should lie within ±3SE of µ
list the empirical rules in the context of a population distribution
~68% of values in the population (yi's) should lie within ±1σ
of µ
~95% of values in the population (yi's) should lie within ±2σ
of µ
~99.7% of values in the population (yi's) should lie within ±3σ
of µ
The four moments
location, measured by the mean
spread, measured by variance and standard deviation
symmetry, measured by skewness, how close mean and median are.
Positively skewed is the outliers are high (mean is bigger)
neg skew is outliers are low values
peakedness, measured by kurtosis
can be leptokurtic (positive kurtosis, high peak)
platykurtic (negative kurtosis, flat curve)
types of errors
experimenter error (accumulating inaccuracies through carrying out an experiment, caused by the experimenter themselves)
chance error (error due to small sampling. Can be mitigated by increasing n. This decreases standard error because it equals s/√n)
statistical error (type I: aka alpha error, you reject the null but it was actually true
type II: aka beta error, you retain the null but it was actually false)
Power
the ability to reject the null when you should be
can be affected by
raising sample size (increases power)
increasing alpha (increases power)
increasing effect size (increases power, decreases standard error)
inherent variability (decreases power)
Definition of P-value
The probability of obtaining a test statistic as extreme or more extreme than the one obtained given that the null hypothesis is true
Why do we never use confidence intervals to test hypotheses?
A 95% CI is equivalent to a two-tailed test at α = 0.05. If your hypothesis is one-tailed, the CI doesn’t match your α correctly.
doesn’t give you an exact p-value
however if t is more extreme than tcv usually the null is rejected
What is standard deviation? What is standard error? What do they tell us about data?
s=typical distance of values from sample mean
SEy=standard error of the mean, measures how precisely sample mean represents population mean
chi square gof vs test for independence
sum((O-E)²)/E
goodness of fit: there is one nominal variable, tests against model for random chance
independence: you have two nominal variables, calculates expected frequency from the data we collect
4 assumptions of a t test
representative samples
each sample in the study is normally distributed
if more than 1 sample, the samples a independent (for a two sample t test not paired)
if more than 1 sample, there are equal variances among samples
z sub .7 meaning
z score at which the area to the right is .7 (so it is asking for 30th percentile)
what does ANOVA stand for
analysis of variance
underline method strat
groups should be ordered from largest to smallest
how to calculate degrees of freedom
one sample: n-1
paired: n-1
two sample: N-2
none for Mann Whitney U because it is nonparametric. Degrees of freedom involves estimating parameters
graph for 1 nominal and 1 continuos variable
bar graph with standard error
degrees of freedom in 2 sample t test
N-2
standard deviation
typical deviation of data from the mean, has to do with spread
what letter distribution does ANOVA use? Turkey? Mann Whitney U?
F
q
U
what does F statistic/distribution tell you
ratio of between-group variance to within-group variance
MS
the average variance. It measures the variances between the different samples, and can be done in respect to model or error.
criteria for ANOVA
Parametric, normal distribution, 3+ quantitative samples
Nominal x cont. Y
anova is a ___ analysis of difference
one way, because it doesn’t tell you what group mean is statistically different from the others, given the null is rejected. AND BECAUSE IT IS ONE TAILED
2 forms of ANOVA hypotheses
Conceptual: the normal one we do
Statistical: compares model vs. error variance, tells you if there is more signal than noise
assumptions of ANOVA (4)
Representative samples (represent the population they were obtained from)
Normally distributed data from all samples (each group fits the equation of a normal distribution)
Data is all independent within and between samples
Homogeneity of variances (equal variance amongth samples)
grand mean
overall average of data across all groups
is variance or sum of squares additive?
SS, adding variances inflates variability
model:
variation explained by the independent variable, reflects how different the groups are from each other, is the “signal”
error
reflects unexplained variation within groups, is the “noise”
I/K
number of groups in ANOVA
F ratio
a ratio of variance/mean squares, decide whether group means are actually different or just different due to randomness. If it is much larger than one there is likely significant difference
ratio of signal over noise. If there is more signal than noise we know at least one group is different
sum of squares/what do the different kinds tell you
measure of total variation, tells you how spread out the data is by adding up squared differences.
Model: variation explained by group differences, how far group mean is from overall mean
Error: unexplained variation, how far each individual value if from its group mean
Total: total variation in all data
2 sample t test modeling type
Nominal x, cont. Y
how to calculate a confidence interval
use formula, for two sample t tests you collect it for the difference between two population means (M1-M2, instead of just M like a one sample).
Ex. I am 95% confident that the difference between population mean 1 and 2 lies between these values.
what is important about the sign of t in a two sample t test
When you load confidence, make sure of the sign of your t matches your hypotheses (ex. If cocaine increases running time as opposed to saline, ensure your t will be positive given the alt. Is true)
Or if medication decreases depression scores, your t will be negative given the alt. Is true
Be careful that if you don't load confidence your t value is both + and -
strat for Whitney U
Always use the larger U value (so pick the smaller between R1 and R2)
what does the q value tell us
In tukey test, tells us how far apart two group means are relative to the variability in your data.
conclusion for two sample t test vs Whittney
two sample t test can give you conclusions about parameters, Whitney cannot! Don’t talk about average/mean in your Mann Whitney conclusion
how to find Fcv
you don’t find it idiot, if your ANOVA is significant you use the q distribution
Observational study
a scientific study like experimental, but group being studied is uniform/all being treated the same way. Don’t need hypothesis testing or manipulation
what does the main affect of A graph tell you
does A (ex. gender) impact Y? (you are not looking at B, B should be parallel with a slope and lines close together)
same slope: removing interaction of B
what does the main affect of B graph tell you
does B (ex.medication type) impact Y? (you are not looking at A, lines should be parallel between the two A’s and one should be above the other so show one B is higher)
same slope: removing interaction of A
what does the main affect with B interaction graph tell you:
which B is overall higher and lower? Do they get more different or more similar between A1 and A2?
slopes should not be parallel but moreso converging in one way
what does the interaction of A and B graph tell you
interaction: for each A is B1 or B2 higher? (shows all the means and all interactions)
what does a sampling distribution look like if increased your sample size?
it would be tall and narrower because of the small sample size. The x axis would be the means for each sample. This is because increases your sample decreases standard error and the spread of the graph, making it narrower.
dispersion
measured by s, SEy, s², and IQR, tells us how spread the data is from the center. s specifically tells us the dispersion of data around the mean of a single sample, whereas SEy tells us the precision of a sample mean in estimating M.
central tendency
identifies the center of a dataset, can be measured by median or mean. Involves the first moment (location), where the most middle/probable value is
interaction
when the effect of one independent variable (factor) on a dependent variable depends on the level of another.
Two variables combine to affect the response.
How is a sampling distribution obtained? What are the components of a sampling distribution
which differ from a population?
It is done by repeatedly taking samples from a population and gathering data, usually y bars.
It differs from a population distribution because the many y bars, rather than population values, are used to estimate Mu. The middle of the graph is the mean of all the y bars instead of the actual Mu, and the spread is measured by standard error of the mean rather than standard deviation.
Pr[X|Y]
probability of X given Y
Experimental Study
has a control and a changed thing in an experimental group. x variable must be manipulated.
hypothesis testing uses what kind of statistics
uses inferential statistics
statistics: descriptive v inferential
statistics: study of methods to describe and measure aspects of nature from samples. Used to test hypotheses and make inferences
Descriptive: describe and summarize data you actually collected (mean, standard error, variance, standard deviation)
Inferential: use sample data to make the conclusion about a population (estimate parameters, use t-tests, p values, etc)
precision/consistency
standard error, about consistency rather than accuracy. You want less deviation and measurements that are consistent with each other. Doesn’t require being close to the true value. You’re measurements are the same/close each time you do the experiment.
accuracy
(getting at the true value/state) how close your data is to the true population, how close your estimate of mean weight of crayfish is to the M =
order of scientific method (explain)
Ask questions: in present tense (does/do/is), “do students in bio and psych class differ in height?” “do antidepressants raise dopamine levels in mice?”
Form hypothesis: ex. Students in bio and psych class differ in height
Make an inference: and if/then statement, where you make a specific prediction about your sample. “If I measure 8 students in each class with a tape measure, then their heights will differ” “If I give a group of 10 mice oral antidepressants, their dopamine levels will be higher than the control of 10 mice”
Design the experiment: implement controls, design how you will collect data and analyze your statistics
Carry out the experiment/collect data: need to determine the modelling type to collect data correctly. x and y can be nominal (a name/category) or continous (a value/number)
Statistically analyze data
Make conclusions