Quantitative Research Final
1/63
There's no tags or description
Looks like no tags are added yet.
Name | Mastery | Learn | Test | Matching | Spaced | Call with Kai |
|---|
No analytics yet
Send a link to your students to track their progress
64 Terms
random assignment
ensures that each participant has an equal chance of being placed in a condition
random sample
ensures that each member of the population has an equal chance of being chosen for a study
are random sampling and random assignment the same thing?
No, if you don’t have random sample, you can use random sampling to still be considered a simple random sample
validity
concerned with accuracy, how well researchers measure what they intend to measure… is argued for conceptually
reliability
concerned with consistency, measuring something in a consistent and stable manner… is assessed numerically
internal validity
accuracy of conclusions drawn from a particular study
external validity
the generalizability of the findings from a research study
one tailed hypothesis
predicts a significant difference in one direction (ex. dogs are more intelligent than cats… our projects)
two tailed hypothesis
predicts a significant difference without indicating the direction (ex. there will be a difference between dogs and cats in terms of intelligence)
null hypothesis
makes a prediction about NO difference or NO relationships
alternative hypothesis
makes a prediction about a difference or a relationship
hypothesis of difference
predicts a difference (causation)
hypothesis of relationship
predicts a relationship (correlation)
variable level: nominal
categories (ex. types of sports)
variable level: ordinal
ranked but don’t know difference (ex. relationship status 0-6 months, 6-12 months, 12+ months)
variable level: interval
ranked and know magnitude of difference between categories (ex. likert scale)
variable level: ratio
categories are ranked, know difference, and has absolute zero point (ex. anything that can be counted and be zero, exam scores, temperature, age)
If P is greater than .05 there is…
no difference or no relationship
if P is less than .05 there is…
a difference or a relationship
what is the purpose of a t test?
to determine if 2 groups means significantly differ on an interval/ratio level
what is the first question you ask when interpreting a t test output file?
is there a difference between the variances (is data spread out around its mean)
when answering the first question of a t test what do we want to find?
we want no difference in the variances so we can assume equality (P> .05, data is spread out evenly around mean)
where to find answer to question 1 of t test
look at sig under levene’s test for equality of variances
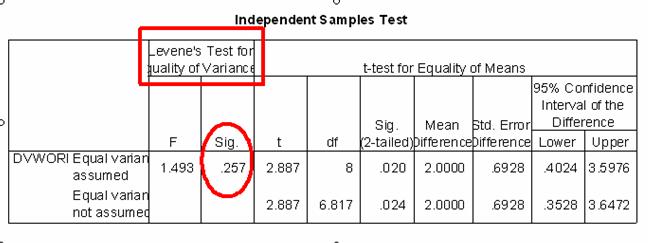
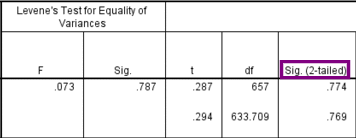
what is the second question when interpreting a t test output file?
is there a difference between the means
what do we want to find when answering question 2 of t test
we want to find a difference P<.05 (statistically significant difference between the two variables)
how to find answer to question 2 of t test?
look at box labeled t-test for equality of means and find sig 2-tailed column
what is the third question when interpreting t test output file?
what is the effect size?
what do we want to find when answering question 3 of t test?
bigger is better but anything will do (cohens d)
what are the sizes of cohens d?
small=.2, medium= .5, large=.8
how to report t test information?
The study revealed that IV1 (M=mean) are more/less DV than IV2 (M=mean), t(df)= t#, P sentence…, cohen’s d= #. Thus the hypothesis was supported/not supported.
what is the purpose of an ANOVA test
to determine if 3 or more groups means significantly differ an an interval/ratio level
what is the first question you ask yourself when interpreting an ANOVA output file?
is there a difference between the means of the IVs (write out the three levels)
what do we want to find when answering question 1 of ANOVA?
we want to find a difference between the means P<.05
how to find answer to question 1 ANOVA
look at the Tests Between Subjects Effects box, find sig column, use IV row
what is second question when interpreting ANOVA and what do you want to find?
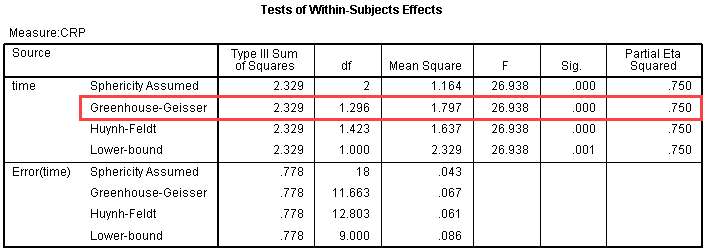
what is the effect size… bigger is better but anything with do (partial eta squared)
ANOVA levels of partial eta squared
small=.01, medium=.06, large=.14 (look at partial eta squared box for IV column

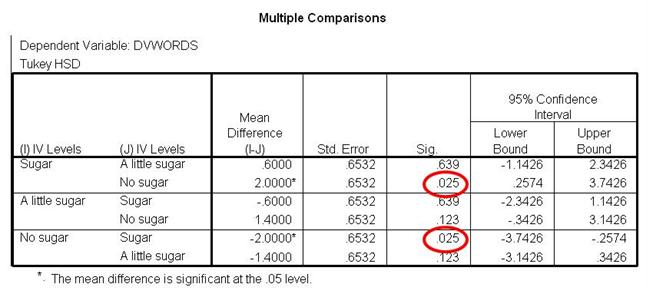
what is the third question when interpreting an ANOVA output and what do we want to find?
where does the difference lie… we want to be in line with our hypothesis
how to find answer to question 3 ANOVA
look at multiple comparisons box in sig column for any p-value less than .05… if you find one see which IV levels are involved then check descriptives statistics box to see which mean is higher to find answer
How to report ANOVA findings?
This study revealed that IV1 (M=mean#) are more/less DV than IV2 (M=mean#), F(df#, error#) = F#, p sentence>/<, partial eta2= eta#. Thus, the hypothesis was partially supported.
what is the goal of a correlation test
to determine if there is a relationship between two interval/ratio variables
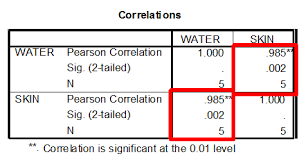
what is the first question you ask when interpreting a Correlation output and what do you want to find?
is there a relationship, we want a relationship (p<.05)
how to find answer to question 1 Correlation?
look at sig row in the box that crosses both variables

what is the second question for correlation output and what do we want to find
what is the direction, we want it to be in line with the hypothesis
how to find answer to question 2 correlation
look at pearson correlation # to see if it is positive or negative
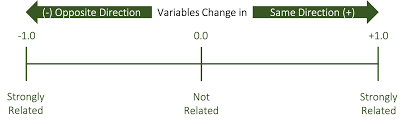
what is the third question when interpreting a correlation output?
what is the strength -1 — 1 continuum
what do we want to find when answering question 3 of correlation?
stronger is better but anything will do (closer to -1 or 1 than 0 then strong in that direction, if closer to 0 than weak relationship)
how to report correlation findings?
This study revealed that as one variable increases/decreases, their other variable increases/decreases, r(N-variable#)= pearson’s correlation#, p sentence.
research validity
accuracy of project as a whole, what you concluded, how accurate it was
measurement validity
how accurate researchers measure what they intend to measure
content validity
do the items properly sample the entire topic/what we intent to measure
criterion related validity
does the technique used match results of previous different techniques (use two different techniques then match scores)
construct validity
does the instrument measure what it is supposed to? (ex. give old validated likert scale and new one to see if scores are related)
ways to manipulate the IV
experimental vs control group, written materials, audio/visual materials, confederates (people in study), and hypothetical scenarios/role playing
4 features of an experimental design
random assignment 2. manipulation of the IV 3. measurement of DV 4. control
things that affect control
threshold effect, experimenter effect, hawthorne effect, extraneous variables
threshold effect: affects control
idea that manipulation of IV needs to reach a certain threshold before it changes the DV (ex. video games are violent but only after 4 hours of play)
experimenter effects: affects control
something related to the experimenter impacts the results of the study
hawthorne effect: affects control
doing an observational study and the participants figure out they are being observed and behave differently
extraneous variables: affects control
something unrelated to the study causes a change in the DV
historical flaw: threat to validity
something unrelated to study is happening in the world and causes participants to behave differently (ex. study on alcohol but student dies from alcohol)
maturation: threat to validity
idea that participants matured naturally and not as a result of manipulation of IV
testing flaw: threat to validity
problem when you give measurement more than once and participants become test wise
selection threat to validity
participants participate in study for nefarious reasons (ex. $100 reward so don’t take study seriously)
attrition threat to validity
when people drop out of your study because it is too long, too personal, etc (happens in longitudinal study)