C5.2 - Controlling reactions
1/45
There's no tags or description
Looks like no tags are added yet.
Name | Mastery | Learn | Test | Matching | Spaced | Call with Kai |
|---|
No analytics yet
Send a link to your students to track their progress
46 Terms
What is rate of reaction?
How quickly reactants are converted into products
Formula for rate of reaction
rate = amount of reactant used or product formed ÷ time
Rate triangle
[DRAW: rate on top, amount + time at bottom]
![<p>[DRAW: rate on top, amount + time at bottom]</p>](https://assets.knowt.com/user-attachments/868d2ae9-0118-4e85-a451-6a1e371c45db.png)
Units for rate
g/s, cm³/s, mol/s depending on measurement
How can rate be measured?
By change in mass, volume of gas, or formation of precipitate
Measuring rate by mass change
Reaction releasing gas → mass decreases over time
Mass change diagram
[DRAW: conical flask on balance losing mass as gas escapes]
![<p>[DRAW: conical flask on balance losing mass as gas escapes]</p>](https://assets.knowt.com/user-attachments/3628efe6-b67b-41da-8a28-d650e84ec0c6.png)
Measuring rate by gas volume
Collect gas in syringe or measuring cylinder over water
Gas volume diagram
[DRAW: flask → tube → gas syringe]
![<p>[DRAW: flask → tube → gas syringe]</p>](https://assets.knowt.com/user-attachments/048ac7ef-ea1a-4737-9e37-1b9ab7f68b7c.png)
Measuring rate by precipitate formation
Reaction forms solid → obscures mark under flask
Precipitate example
Na₂S₂O₃ + 2HCl → 2NaCl + SO₂ + S + H₂O
Cross method diagram
[DRAW: flask with cross visible → cross disappears as precipitate forms]
![<p>[DRAW: flask with cross visible → cross disappears as precipitate forms]</p>](https://assets.knowt.com/user-attachments/9d0011d1-1e7f-4555-af0a-a112890dc80b.png)
What do rate graphs show?
How amount of reactant or product changes over time
gradient of tangent = rate at that point
Reactant graph shape
Downward curve (reactant decreases)
Product graph shape
Upward curve (product increases)
Gradient meaning
Steeper gradient = faster rate
When graph levels off
Reaction finished
Mean rate formula
mean rate = change in quantity ÷ change in time
Example mean rate
48 cm³ gas in 40 s → 48 ÷ 40 = 1.2 cm³/s
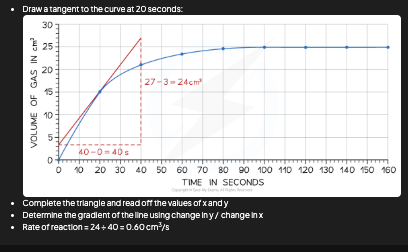
Rate at a particular point
Draw tangent → gradient = rate
Tangent diagram
[DRAW: curve with tangent line at chosen point]
![<p>[DRAW: curve with tangent line at chosen point]</p>](https://assets.knowt.com/user-attachments/a80d2968-0a26-4f76-9e18-2d668e7a43a5.png)
Comparing rates
Steeper curve = faster reaction
Rate from reaction time
rate = 1 ÷ reaction time
Factors affecting rate
Concentration/pressure, temperature, surface area, catalysts
Increasing concentration or pressure
More particles per volume → more frequent collisions
Concentration/pressure graph
[DRAW: high vs low concentration curves]
![<p>[DRAW: high vs low concentration curves]</p>](https://assets.knowt.com/user-attachments/f38d771b-f0dc-497f-b7c1-911e51845e84.png)
Increasing temperature
Particles have more kinetic energy → more frequent + energetic collisions
At higher temperature → more particles have energy ≥ activation energy
Temperature graph
[DRAW: high vs low temperature curves]
![<p>[DRAW: high vs low temperature curves]</p>](https://assets.knowt.com/user-attachments/e13bea9e-fe47-4532-8c34-c184966733c2.png)
Increasing surface area
greater surface area → more collisions per second
Surface area diagram
[DRAW: large cube vs small cubes]
![<p>[DRAW: large cube vs small cubes]</p>](https://assets.knowt.com/user-attachments/e82e892a-b6a8-4550-80a3-042665563746.png)
Collision theory
Reactions occur when particles collide with enough energy to overcome activation energy
Activation energy definition
Minimum energy needed for reaction to occur
Successful vs unsuccessful collisions
Successful = energy ≥ activation energy
Collision diagrams
[DRAW: particles colliding with/without enough energy]
![<p>[DRAW: particles colliding with/without enough energy]</p>](https://assets.knowt.com/user-attachments/e94fbd15-e28c-48e4-a2e5-1837b9357655.png)
Effect of concentration/pressure
More particles → higher collision frequency → faster rate
Effect of temperature
Higher kinetic energy → more collisions with sufficient energy
Effect of surface area
More exposed particles → more collisions
Effect of catalyst
Provides alternative pathway with lower activation energy
Catalyst definition
substance that speeds up rate of reaction but does not get used up and can be reused
Catalyst energy profile diagram
[DRAW: energy vs reaction coordinate; catalysed curve lower peak]
![<p>[DRAW: energy vs reaction coordinate; catalysed curve lower peak]</p>](https://assets.knowt.com/user-attachments/6bf8bfae-a46b-4a4e-9902-11f1793976b8.png)
Catalyst industrial importance
Allows lower temperature + pressure → saves energy + cost
Catalyst equilibrium effect
Does not change position of equilibrium
What is an enzyme?
Biological catalyst speeding up reactions in living organisms
How enzymes work
Substrate fits into enzyme’s active site forming enzyme–substrate complex
Enzyme specificity
Each enzyme catalyses one type of reaction
High temperature → enzyme denatures (active site changes shape)
Factors affecting enzyme activity
Temperature, pH, substrate concentration