4.3 AD/AS Analysis
1/44
There's no tags or description
Looks like no tags are added yet.
Name | Mastery | Learn | Test | Matching | Spaced | Call with Kai |
|---|
No analytics yet
Send a link to your students to track their progress
45 Terms
What does the word 'aggregate' mean
Total
What is Aggregate Demand (AD)
The total spending on all goods and services in an economy at different price levels over a given time period.
- The total demand for an economy's goods and services at a given price level in a give time period
- Total spending of consumers (households), firms and the government plus foreigners' spending on exports minus the economy's spending on imports
What are the components of AD
AD = C + I + G + (X – M), where C = consumption/consumer expenditure, I = investment, G = government spending, X – M = net exports.
What is consumption/consumer expenditure (C) in AD
Spending by households on goods and services to satisfy current wants e.g. spending on food, clothing, travel & entertainment
What is the main influence of consumption
The level of disposable income
- When income rises, total spending also usually rises (with rich people spending more than poor people)
What is dissaving
When consumer expenditure exceeds income, with people or countries drawing on past savings, or borrowing
What is saving
Income minus consumption
Apart from income, what other factors influence consumption + how (5)
Distribution of income (more distributed = more spending)
- The rate of interest (lower interest rates = more spending as returns from saving are reduced)
- The availability of credit (Easier to obtain loans = more spending)
- Expectations (unlikely to spend/borrow if pessimistic about the future)
- Wealth (Rise in wealth, e.g. rise in home values, = increase in spending)
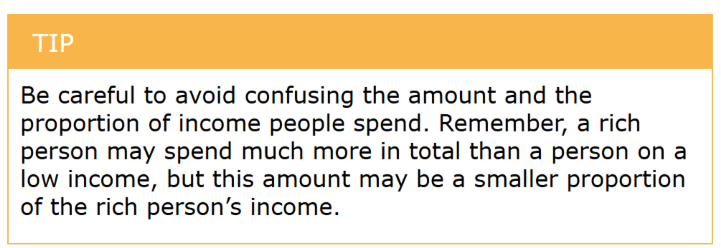
tip - don’t confuse amount and proportion of income people spend
What is investment (I) in AD
Private sector spending by firms on capital goods, including additions to inventories, such as factories, offices, machinery and delivery vehicles
What is investment influenced by (6)
Changes in consumer demand
2. Rate of interest
3. Technology
4. The cost of capital goods
5. Expectations (optimistic about economic conditions or no
Tip
What is government spending (G) in AD
Expenditure by the government on public goods and services such as health, education, and infrastructure.
- The total of local and national government expenditure on goods and services
What is government spending influenced by (3)
Government policy - gov wants to raise economic activity = raise in spending
2. Tax revenue - higher tax revenue = higher spending without the need to borrow
3. Demographic changes - pressure for a rise in spending may come from an increase in children (education) or elderly people(healthcare)
What is net exports (X – M) in AD
Exports minus imports; spending by foreigners on domestic goods minus domestic spending on foreign goods.
- The difference between the value of exports of goods and services and the value of imports of goods and services
What are net exports influenced by
The country's GDP - GDP rises = increase in demand for imports
2. Other countries' GDPs - Incomes rise abroad = demand for country's exports is likely increase
3. The relative price and competitiveness of the country's products - improved competitiveness = more exports
4. Exchange rate - Exchange rate falls in value = exports cheaper, imports more expensive
What does the AD curve show
The different quantities of total demand for the economy's products at different prices
What causes a movement along the AD curve
A change in the price level.
- Rise in price level = contraction in AD, Fall in price level = extension in AD
What is the difference between the relationship between demand and price level for aggregate demand vs demand for an individual product
For an individual product, demand changes as its relative price changes while other prices stay constant, whereas for aggregate demand, the overall price level changes with most prices moving in the same direction.
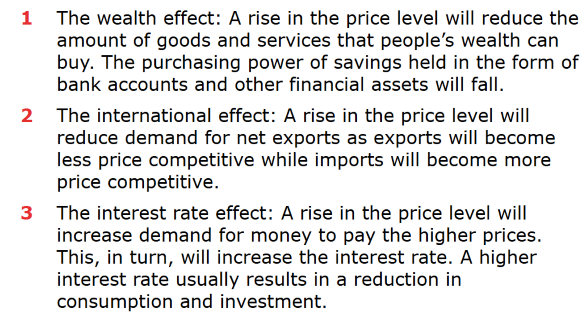
Why does AD fall when the price level rises and vice versa (3)
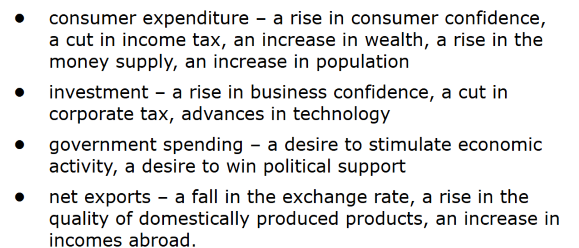
What causes a shift in the AD curve (4)
Any non-price level influence
- Changes in consumption, investment, government spending, or net exports (other than price level).
What is the shape of the AD curve (diagram) + what is on the axis
Downward sloping, because higher price levels reduce total spending.
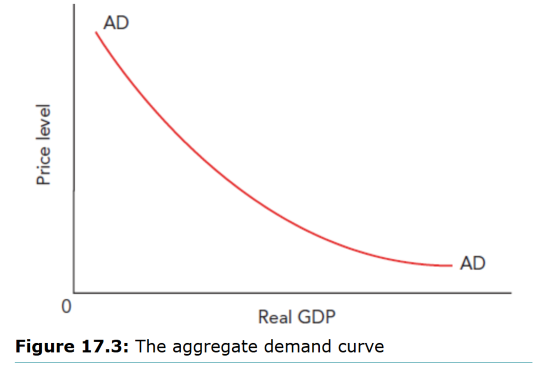
Why is the AD curve downward sloping (3)
Due to the wealth effect, interest rate effect, and net export (international) effect.
What is Aggregate Supply (AS)
The total output (real GDP) of goods and services that producers in an economy are willing and able to supply at different/given price levels in a given time period.
- Can differentiate between short run and long run
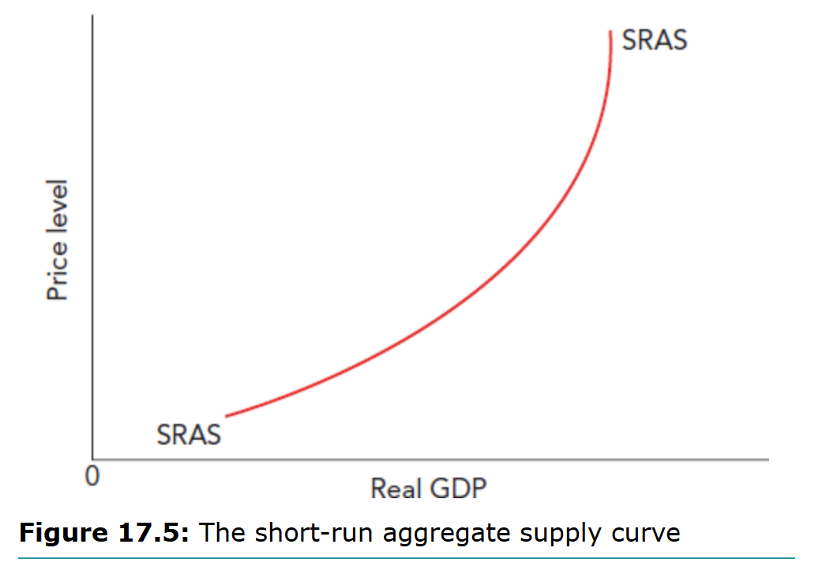
What is the short-run aggregate supply (SRAS) curve + diagram
Upward sloping; shows how firms supply more output as the price level rises while some costs are fixed.
- The total output of an economy that will be supplied when there has not been enough time for the prices of factors of production to change
As the price level rises, producers are willing and able to supply more goods and services. What are the three possible reasons for this positive relationship
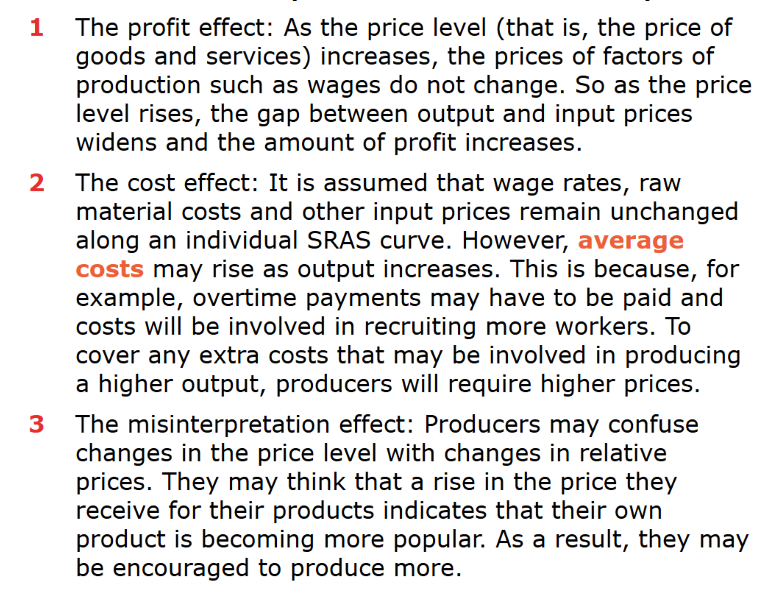
What are average costs
The cost per unit of output
What shifts the SRAS curve (4)
The factors that will cause an increase in the quantity of resources in the long run will also increase SRAS
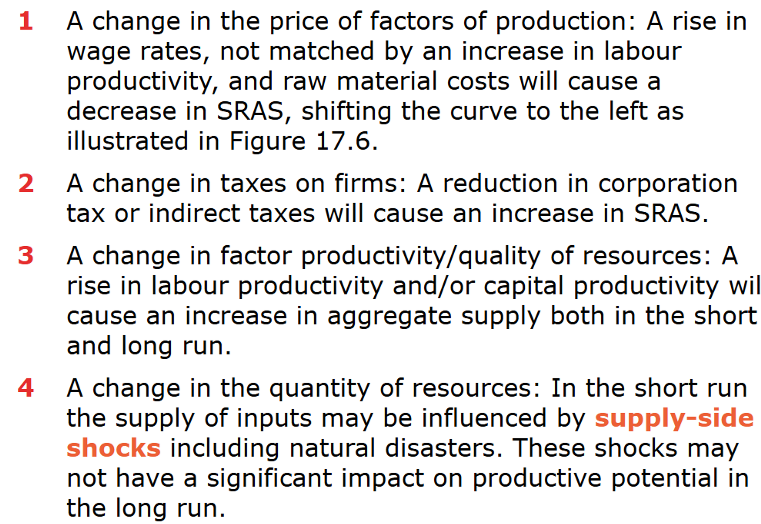
What are supply shocks
Large and unexpected changes in short-run aggregate supply
What is the long-run aggregate supply (LRAS) curve
Vertical at the economy’s full employment output (potential GDP); shows output is determined by resources, technology, and productivity.
- The total output of a country supplied in the period when prices of factors of production have fully adjusted
- Shows the relationship between real GDP and changes in price level when there has been time for input prices to adjust to changes in AD
What are Keynesians
People who agree with the view of the economist John Maynard Keynes that government intervention is needed to achieve full employment
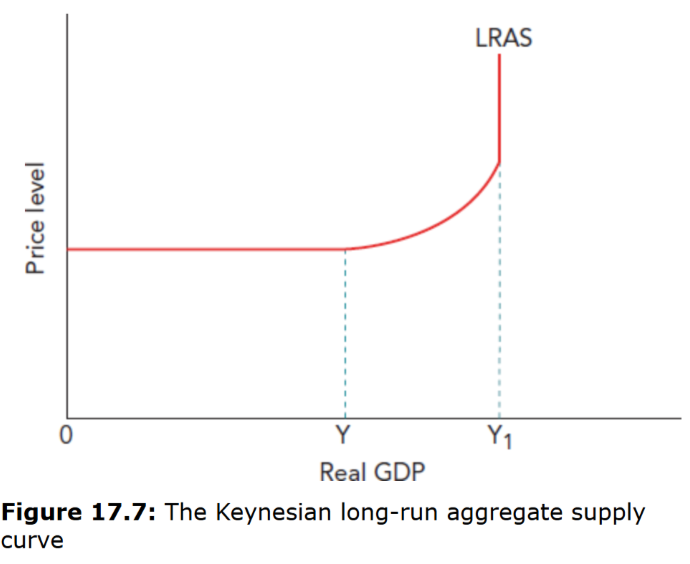
How do Keynesians represent the LRAS curve + diagram + why
Perfectly elastic at low rates of output, then upward sloping over a range of output and finally perfectly inelastic.
- This is to emphasise their view that, in the long run, an economy can operate at any level of output and not necessarily at full capacity.
- When output and hence unemployment are low, firms can attract more resources without raising their prices
- As output rises from Y to Y1, firms begin to experience shortages of inputs and bid up wages, raw material prices and price of capital equipment
- Y1 = full capacity/producing maximum output with existing resources
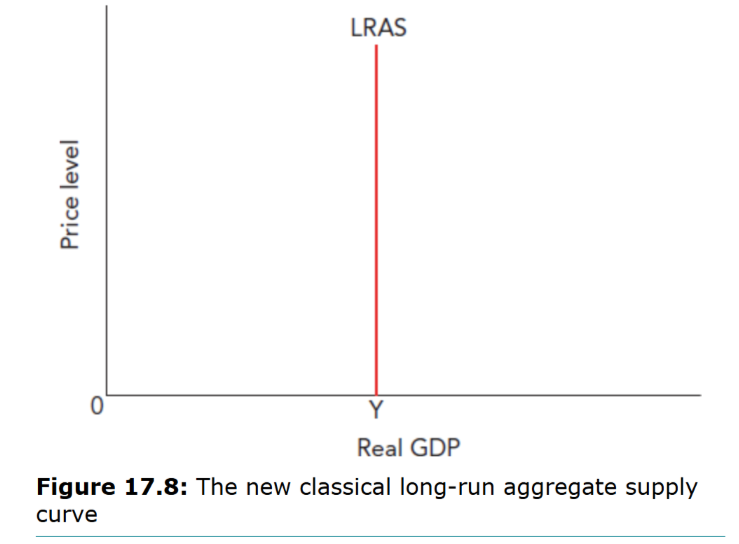
How do new classical economists illustrate the LRAS curve + why (diagram)
Illustrate the curve as a vertical line
- This is because they think that in the long run the economy will operate at full capacity
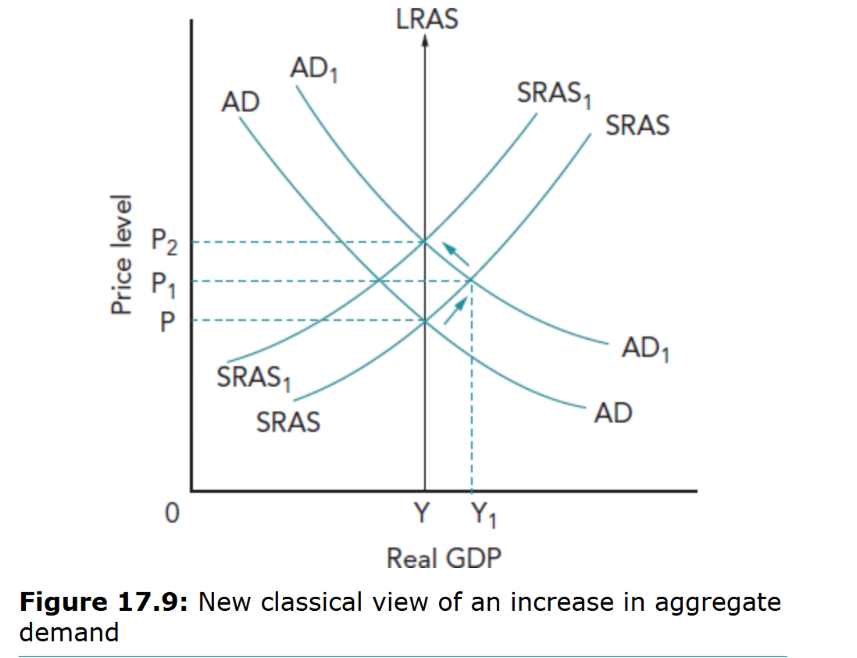
According to new classical economists, what is the effect of an increase in aggregate demand in the short run and long run (diagram)
In the short run, an increase in aggregate demand raises output as firms use resources more intensively e.g. workers working overtime; in the long run, higher costs from intensive use of resources will shift SRAS left so output returns to its original level (LRAS) but at a higher price level.
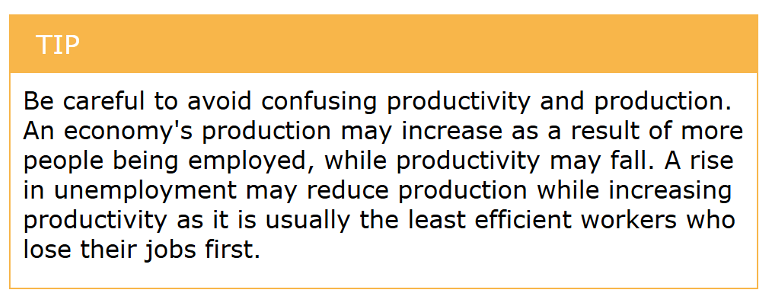
Tip
What 2 changes shifts the LRAS curve
Both Keynesian and new classical economists agree that causes of shift in LRAS curve are a change in the quantity and/or quality of resources (factor productivity)
- Both of these will increase the productive potential of the economy.
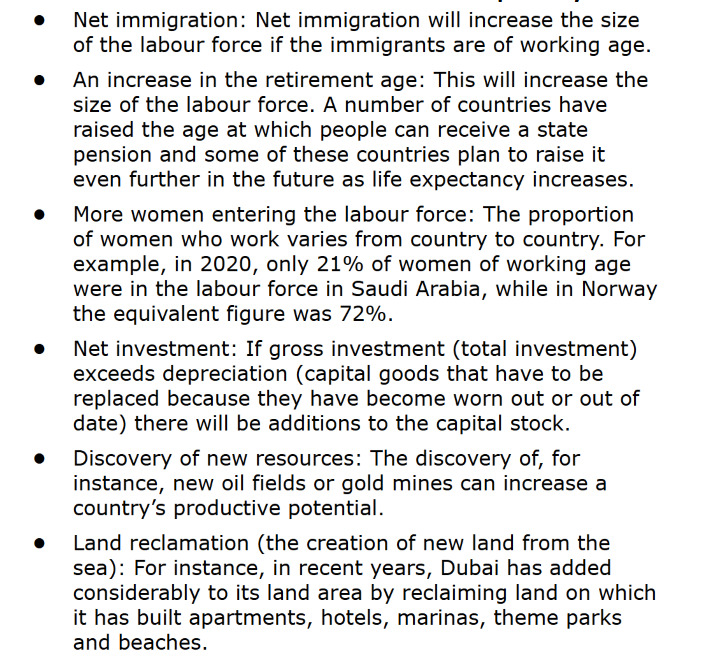
What are the causes of an increase in the quantity of resources in the long run (6)
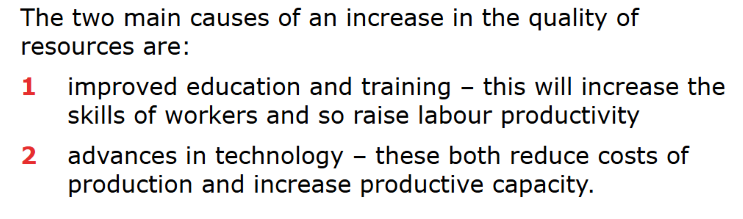
What are the main causes of an increase in the quality of resources
What is the difference between a movement along and a shift of AD/AS
Movement = change in price level; shift = change in determinants other than price.
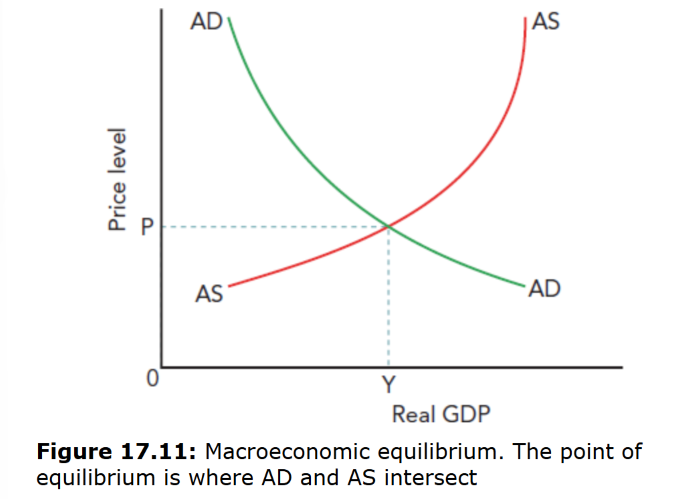
What is macroeconomic equilibrium + diagram + explanation about P
The point where AD intersects AS, determining real output, price level, and employment.
- The output and price level achieved where AD equals AS
- If the price level was initially below P, there would be macro disequilibrium. The excess demand would push the price level back up to the equilibrium level. If the price level was above P, some goods and services would not be sold and firms would have to cut their prices.
What happens if AD shifts right
Output rises, price level rises, employment rises; may cause demand-pull inflation.
What happens if SRAS shifts right
Output rises, price level falls, employment may rise; reduces cost-push inflation.
What happens if SRAS shifts left
Output falls, price level rises, unemployment may rise; causes cost-push inflation.
What happens if LRAS shifts right
Potential output increases → long-term economic growth without necessarily changing the price level.
Why are AD/AS diagrams important in exams
They visually show the effects of changes in spending or supply on output, prices, and employment.