Business analysis and planning MT1
1/30
There's no tags or description
Looks like no tags are added yet.
Name | Mastery | Learn | Test | Matching | Spaced | Call with Kai |
|---|
No analytics yet
Send a link to your students to track their progress
31 Terms
Analysis vs. planning
Analysis and planning are closely connected and both essential for a business to function effectively. Analysis helps us understand the current situation in the company and its environment, which is necessary before creating a plan. Once the plan is made and put into action, analysis is again used to check progress, find reasons for success or failure, and set new goals.
In short, analysis is involved at every stage of the planning process.
Object and subject; definition and examples
Object of analysis is what is being examined or studied. For example, in a business analysis, the object could be the performance of an enterprise. This includes internal and external factors affecting the business, such as departments, operations, assets, investments, and efficiency.
Subject of analysis is the specific part or aspect of the phenomenon being analyzed. For instance, the subject of analysis could be the company’s assets, which are a part of the broader phenomenon of enterprise performance.
Object: The overall performance of a business.
Subject: The company’s assets, such as fixed and current assets, which are part of the business performance.
Types of analysis - know the types and examples (6)
1. Extensive and Intensive:
· Extensive: A broad, general overview, like evaluating the overall market conditions.
· Intensive: A detailed and precise examination, such as analyzing the financial records of a specific department.
2. Complex and Partial:
· Complex: Analyzing the entire business or an organization as a whole, like assessing the overall performance of an enterprise.
· Partial: Analyzing specific segments or aspects of the business, like examining only the sales or financial situation.
3. External and Internal:
· External: Conducted by an outsider, often more extensive, such as a market research firm analyzing industry trends.
· Internal: Performed by someone within the company, often more intensive and detailed, like an internal auditor evaluating the company’s budget.
(e.g SWOT), (ERP for internal - Enterprise Resource Planning)
4. Permanent and Temporary:
· Permanent: Ongoing, regular analysis, such as monthly financial reporting.
· Temporary: Sporadic, done as needed, like analyzing a specific project’s performance at its completion.
5. Short and Long-run:
Long-term (strategic 5+y R&D companies) and short-term (operational 1-2 years)
6. Strategic and operative :
Phases of analytical process (4)
1. Determining the tasks of analysis: This phase involves defining the goals of the analysis, usually determined by management or external entities. The analysis can be constant (like profitability, liquidity, or sales) or periodic
2. Preparation of the analysis process: The goal is to ensure the analysis task is completed successfully. This phase includes defining the form of results, gathering comparative data, and observing the phenomena.
3. Examination of the facts: This phase involves analyzing the collected data in detail and drawing conclusions. It follows a sequence: Establishing facts, Identifying deviations, Determining the causes of these deviations, Drawing conclusions about the phenomenon.
4. Displaying the results of analysis: The results are typically presented in writing to inform the principal. This includes an introduction, statements about the object of analysis, and conclusions, usually in the form of judgements, assessments, diagnoses.
Analysis by period
Short-term analysis (Operational analysis)
· analysis during the business year (operative)
· analysis at the end of the business year
Long-term analysis (Strategic analysis)
· the tendency of a trend, causes and measures
· characteristic of the phenomena for each business year - degree of realization, causes and measures
· characteristic and dynamics of phenomena for future period- compliance with goals
Big data and Key aspects
- all the data in a company, internal not in ERP, external to be used.
Key Aspects of Big Data:
The 5 V's:
Volume: Immense amounts of data (terabytes to zettabytes) generated daily.
Velocity: The high speed at which data is created and processed.
Variety: Diverse types, including text, video, audio, and sensor data.
Veracity: The trustworthiness and accuracy of the data.
Value: The ability to turn data into insights that provide business or social benefit.
Stores data from other companies (can be used to compare to competitors)
ERP, BI, KPI
Are closely connected and play a crucial role in effective business management. ERP systems help organizations manage and integrate core processes such as finance, supply chain, and operations. BI tools analyze data from the ERP system to generate insights and support decision-making. KPIs are metrics used to measure performance and success, and they are tracked using data provided by ERP and analyzed through BI. Together, these systems ensure informed decisions, efficiency, and strategic alignment.
Main purpose of planning
The main purpose of business planning is to think ahead and systematically design future actions to achieve specific objectives. It involves outlining the steps required to reach set goals and directing business development in a conscious and structured way. In an enterprise, business planning is target-oriented, with a focus on business strategy and strategic goals, which form the basis for operational goals.
The planning process consists of three main phases (3)
1. Goal (Objectives) Planning – involves defining general and specific goals, creating a hierarchy or pyramid of goals.
2. Planning of Measures – includes elaborating specific objectives and strategies to achieve the goals, answering how the plan will be realized.
3. Realization – focuses on implementation, monitoring, and analyzing deviations from the plan.
There are several types of plans, categorized by different criteria
· Time: long-term, medium-term, and short-term plans.
· Hierarchical level: strategic, operational, and tactical plans.
· Responsibility and competence: by functional organization or by division.
· Information system and environmental conditions: plans in terms of safety and uncertainty.
Projection vs forecasting
P: What will happen if; it's a guess, longer than 3 y. Estimated guess
F: gives an answer to what might happen. Max 3 years. Current business condition
Types of decision-making analysis
1) Previous (preventive)
2) Subsequent (corrective)
Is analysis predominantly preventive or corrective?
→ preventive
The main difference between strategic and operational planning
lies in their scope and time frame. Strategic planning focuses on the long-term direction of an organization, setting overall goals and determining actions to achieve sustainable success. It answers broad questions like what the organization aims to achieve, who it serves, and how it plans to meet stakeholder expectations. On the other hand, operational planning is short-term and more detailed, focusing on how to implement the strategic plan in day-to-day activities. It translates the strategic vision into specific tasks, responsibilities, and workflows to reach defined milestones.
Strategic analysis
is mostly dealing with prediction of environment in which a business may have to operate. In other words, strategic analysis is conducted for assessing potential markets and the competitive position of the firm in those markets
Operational analysis
refers mainly to the period of one year and are therefore often referred as short -term.
The phases of the decision-making process (4)
1. Preparation – This phase involves gathering and processing information about external factors, analyzing possible options, elaborating on alternatives, and designing proposals.
2. Decision-Making – Here, the proposition is analyzed and the actual decision is made.
3. Realization – The chosen decision is put into action and evaluated using relevant information.
4. Control – This final phase involves analyzing causes and ensuring actions are aligned with regulations, which helps correct potential deviations and improve future decisions.
Rationality
methodical decision-making process of using logic, data, and objective criteria to select the best possible course of action among alternatives, aiming to maximize benefits or utility. MAX INPUT ( investment) WITH MAX OUTPUT (revenue).
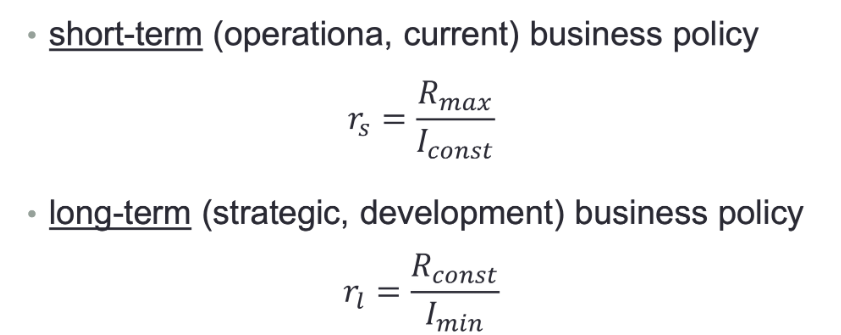
Short-term (operation, current) business policy
Long-term (strategic, development) business policy
Normal + how to determine it
represents the potential capability of the company and the plan and norms represents a compromise between these possibilities and assessment of future business situation. Normal should be understood as a business operations in which business results (quantity of products or services, revenue and financial result) and investments (long-term and short –term assets, labor and expenses) are harmonized.
Normal can be set up:
1. Absolute
2. Relative
calculated as average : all values summed up and divided by their quantity
Basic possibilities of establishing the normal:
1. Based on an optimality study of individual (specific) procedures and elements of a business processes
2. Based on the best indicators of the company(ies) used for comparison (benchmark)
3. Based on legal and other regulations
Norm (normative)
is an estimation; a standard/ model or pattern regarded as typical
Average coefficient (or rate) of growth (ACG) + how to calc?
There are 3 ways to calculate ACG:
1. Ordinary average
2. Average rate
3. Least squares method
The most precise rate - Least squares method
Least correct - ordinary
Indicator systems term + differentiation
is a goal-oriented set of economic indicators used to systematically evaluate a specific area or policy outcome.
What makes it an “indicator system” (not just random data):
Indicators are selected based on a goal
They are used together, not separately
They give a multi-dimensional view of one problem
The two main types of indicator systems are deductive and inductive systems
· Deductive systems are built using a logical, top-down approach. They start from a main indicator that represents the firm’s primary goal, and then break it down into supporting indicators that further define and specify the main indicator’s components. This structure forms a pyramid, where each lower-level indicator is derived from the one above it. A well-known example is the Du Pont system, which analyzes profitability. (Deductive; often shaped as a pyramid; qualitative)
· Inductive systems, on the other hand, are based on empirical, data-driven analysis. They use mathematical and statistical methods to select indicators that best describe certain characteristics of a firm, often for predicting financial crises or inefficiencies. These systems are based on multi-year data from many companies. Examples include Altman’s Z-score, Beaver, Kralicek, and Zmijewski models. (quantitative)
The Du Pont system
is a financial analysis model that breaks down Return on Equity (ROE) into three components: profit margin, asset turnover, and equity multiplier. The Du Pont system is mostly used because it provides a comprehensive and clear breakdown of a company’s profitability, helping managers and analysts understand how different financial elements interact to affect the return on equity (ROE).
The main difference between forecasting and projections lies in their time frame and purpose.
Forecasting is typically used for medium-term planning (up to 3 years) and is based on realistic assumptions derived from historical data, expert knowledge, and statistical methods. It helps management deal with uncertainty and plan future operations using tools like the Delphi method, moving averages, or regression analysis.
Projections, on the other hand, are used for long-term planning (at least 5 years) and are based on hypothetical “what if” scenarios. They explore possible future developments of the enterprise and are mainly used to evaluate opportunities for strategic planning.
Ways of calculating average coefficient of growth
1. Ordinary average - This method calculates the arithmetic mean of individual growth rates over a period. It’s simple but does not account for compounding effects between periods.
2. Average rate - Also called the geometric average growth rate, this method considers the compounding nature of growth. This is more accurate for growth over time.
3. Least squares method - This is a statistical method that fits a trend line (linear regression) through the data points to minimize the sum of squared deviations. The slope of this trend line indicates the average growth rate.
Analysis term
dividing or joining. clarification , judgement, assessment, conclusion = investigation of facts and phenomena relevant to the subject of analysis. working procedure in which the analyst came to a certain conclusion based on available data and info, and observation.
Basic methods of analysing of a phenomena (4)
Method of decomposition (share)
Used in quantity and qualitative research (value (in hrk) or nature)
By time
year/month - share by %
Object
By products - still have a share
Organisation
Has branches
Location
Category
Combined decomposition
Two dimensions (e.g. time and object)
Method of comparison (index)
Two phenomena
Problems : unequal standards/time periods; changes in values of monetary units
Method of isolation and elimination
It's a complementary method after decomposition and comparison. (to isolate and analyse more deeply). Focusing on one factor at a time
Outlier - pick not desired, but different and analyse - why its so; what changed, which are not in line.
Correlation method
If there is a connection. Studying whether two variables move together. Shows relationship, not cause.
Principle of rationality
Eliminate the data which doesn't fit or needed
Determination coefficient
its a coefficient which tells how one phenomena is precise to another
Numbers and indicators as a means of analysis: absolute vs relative
Absolute :
Essential numbers: raw number to analyse (in total on a list)
Derived numbers: result after the analysis (actually participating)
Relative numbers:
Unified sets (one phenomena 60%)
Structured (60%, 40%) =100%
Different phenomena (pass the exam: failed – 4:1)
Average growth rates (y1: 25; y2: 30; y3: 35 – calc the average)
Absolute terms: difference and multiple by 100 %
Relative : calc an index (realisation/ plan) * 100%