research exam three
1/107
There's no tags or description
Looks like no tags are added yet.
Name | Mastery | Learn | Test | Matching | Spaced | Call with Kai |
|---|
No analytics yet
Send a link to your students to track their progress
108 Terms
independent variable
the characteristic or manipulation the researcher wants to study
the factor we manipulate
dependent variable
the observations or measures a researcher obtains
the outcome that you measure to see if it changes as a result of the independent variable
experimental research designs
identify one or more factors to manipulate or control during the study
*the way to describe how many limitations there are to your study
true experimental designs
consists of at least one manipulable variable and true random assignment of participants to groups
examples of a true experimental design
pre-posttest randomized control group
posttest only randomized control group
pre-posttest randomized treatment groups
posttest only randomized treatment groups
solomon randomized four-group
switching replications design
factoral designs
mixed model designs (similar to a pretest-posttest design)
posttest-only randomized control group design
experimental design where participants are randomly assigned to treatment groups and tested after treatment
*involves a control and experimental group
R ◻ X O
R ◻◻O
posttest-only randomized treatment group design
researchers randomly assign participants to different treatment groups, implement the different treatments, then observe and measure their participants’ behavior
R ◻ X O
R ◻◻ O
pre-posttest randomized control group design
researchers observe and measure their participants’ behavior twice: at the beginning of the study before participants receive treatment and again at the end of the study after participants complete the treatment step
*involves a control and experimental group
R O X O
R O ◻ O
pre-posttest randomized treatment group design
comparison involves measures from different participants, or a between-subjects factor
R ◻ X1 O
R ◻ X2 O
solomon randomized four-group design
experimental design with two treatment groups and two control groups, one of each has only a posttest, and one of each has a pretest and posttest
problem with this: needs more participants
R O X O
R O ◻ O
R ◻ X O
R ◻ ◻ O
switching replications design
participants are randomly assigned to treatment and control groups to start the study
experimental design where two groups take a pretest, one group receives treatment, both are post tested, and then the other group receives treatment before both groups take a final posttest
R O X O ◻ O
R O ◻ O X O
factorial design
manipulate two or more different independent variables simultaneously in the same study
determine how each independent variable affects the outcomes
also, determine how the independent variables work together or influence one another
ex: two and three way ANOVA
mixed model design
another term for pretest-posttest randomized group designs
mixed design means the study has both within and between subject factors
treatment and control comparison involves measures from two different groups of participants
quasi-experimental designs
lack random assignment of participants to groups
CONVENIENCE SAMPLE
both experimental and quasi-experimental designs incorporate this one feature:
researcher manipulation of a variable
group studies
focus on behavior of typical group members, assume subjects respond the same
• have subjects participate in just one condition
- provide controls for order, sequence events
report typical behavior of group (mean)
analyze data with many, well-developed statistical tests
typically, recruit a minimum of 10 participants per group
what is the purpose of experimental research?
to explore cause and effect relationships
in most levels of evidence models, what kind of evidence is at the highest level and what kind is at the lowest level?
highest: randomized clinical trials and meta-analyses
lowest: expert opinion
what are the levels of evidence from highest to lowest
meta-analysis/systematic review
randomized clinical trial
nonrandomized control study
other quasi-experimental study
non-experimental study
expert opinion
internal validity
extent to which researchers’ conclusions about cause and effect relationships are accurate
threats to internal validity
history, maturation, pretest sensitization, statistical regression, instrumentation, selection, and mortality
history
outside influence occurred during the course of a study
maturation
increases in performance due to the participants’ growth and development
pretest sensitization
knowledge gained from taking a pretest or changing one’s behavior due to taking a pretest that changes the scores of the posttest
statistical regression
phenomenon that occurs when retesting persons who initially scored very high or very low on a test
tendency for persons who received extreme scores when first tested to score closer to the mean when retested
instrumentation
changes in either physical equipment or human observers between the pretest and posttest
selection
groups differ in a systematic way, rather than in a random way, prior to a study
quasi-experimental designs susceptible to this threat
mortality
participants drop out before the end of a study
*loss of participants more significant when it is not random
quasi-experimental study
a study that manipulates some factors but uses existing groups rather than randomly formed groups
lacks random assignment
pretest-posttest nonequivalent control group design
a type of quasi-experimental design that compares two groups: one that receives a treatment and one that does not
-both groups are measured before and after the treatment
N O X O
N O◻ O
pretest-posttest nonequivalent treatment group design
N O X1 O
N O X2 O
switching replications nonequivalent control group design
N O X O ◻O
N O◻ O X O
double pretest nonequivalent control group design
N O O X O
N O O◻ O
single subject design
a quasi-experimental design that requires only one or a few subjects in order to conduct an entire experiment, and researchers report the results for each individual participant separately
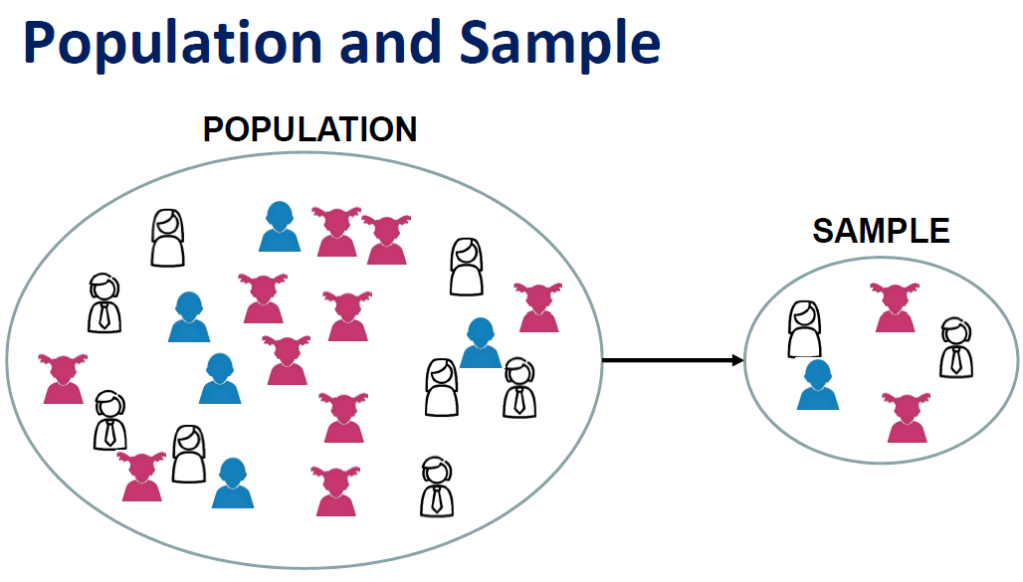
population vs. sample
the population is all of the persons of interest for a particular study
the sample is the smaller group of persons from the population who actually participate in a study
census vs. inference
the census is the information gathered from an entire population
the inference is the information from a sample applied to an entire population
parameter vs. statistic
the parameter is the numerical summary based on an entire population
the statistic is the numerical summary based on a sample from a population
unbiased vs. biased sample
unbiased - all members of a population have an equal opportunity of being selected
biased - some members of a population have an unequal opportunity, or perhaps no opportunity, of being selected
what are sources of bias in sampling?
failing to identify all members
using convenience samples
volunteerism (unavoidable source of bias)
sampling method types
simple random sample
systematic sampling
stratified random sampling
cluster sampling
multistate sampling
purposive sampling
simple random sample
procedure in which every member of a population has an equal chance of being selected as a participant
systematic sampling
procedures in which every nth numbered person from a list is selected
stratified random sampling
procedure in which researchers use population characteristics or “strata” such as gender, age, socioeconomic status (ses), ethnicity, geographic region, urban/suburban/rural in random sampling
cluster sampling
procedure in which researchers obtain a random sample of predefined groups such as medical centers, classrooms, or communities
multistage sampling
procedure that combines cluster sampling and simple random sampling
purposive sampling
procedure in which researchers actively recruit participants who have a predetermined characteristic (or characteristics)
random assignment
procedure for dividing participants into groups
*equal opportunity for assignment to treatment or control group
key characteristic of a “true experiment”
precision of a sample size
how well/accurate/precise a sample is at representing a population
larger samples yield greater precision
bias in a sample
occurs in the selection process and reduces how well sample represents a population
larger sample does not reduce bias if your selection process is flawed
percentage of a population in a sample
recruit higher percentage from small populations and lower percentage from large populations
when should you increase your sample size?
if behavior being measured is highly variable (e.g., large group standard deviations), the behavior or trait occurs rarely in the population, or if the difference between groups was expected to be smaller
pilot study
used with a small number of participants and conducted to test the feasibility, design, and methods of a larger research project before the main study begins
nominal (name) level
name or label an attribute or trait, assign instances to a category
nominal level (mutually exclusive)
for an attribute or trait, an instance or person fits only one category
nominal level (exhuastive)
for an attribute or trait, an instance or person fits into a category
ordinal (order) level
rank order attributes or traits
interval level
measure how much of an attribute or trait is present, determine by how much persons or instances differ (no direct comparisons or ratios), manipulate using addition, subtraction, multiplication, division
ratio level
measure how much of an attribute or trait is present relative to total absence, manipulate numbers in all the ways of interval level (addition, subtraction, multiplication, division) plus compare values directly in ratios
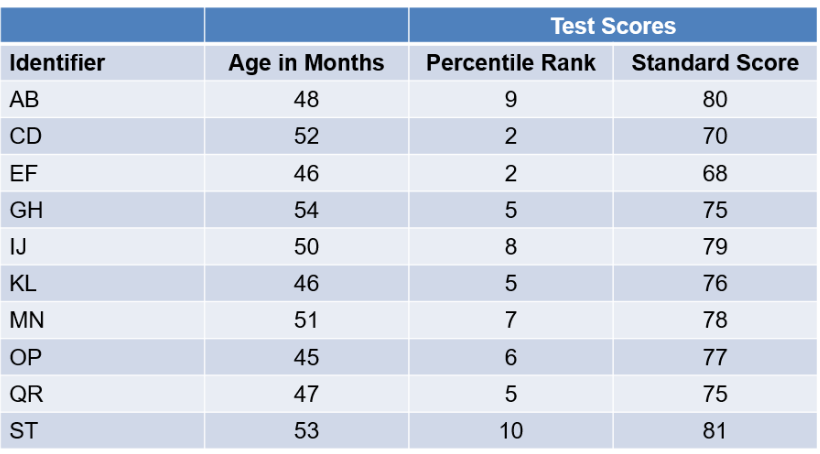
data can be represented through a
table
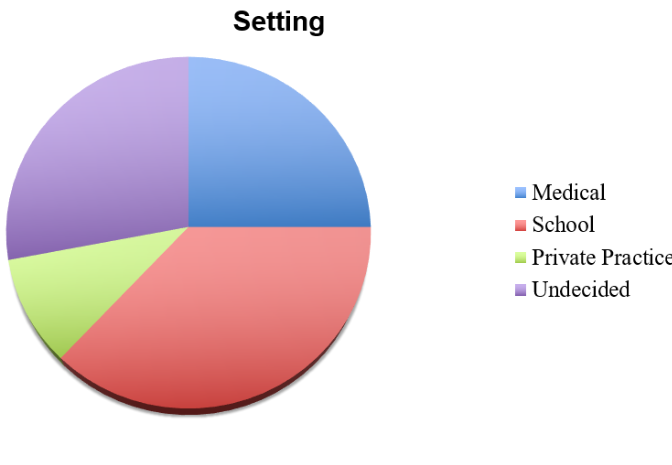
pie chart
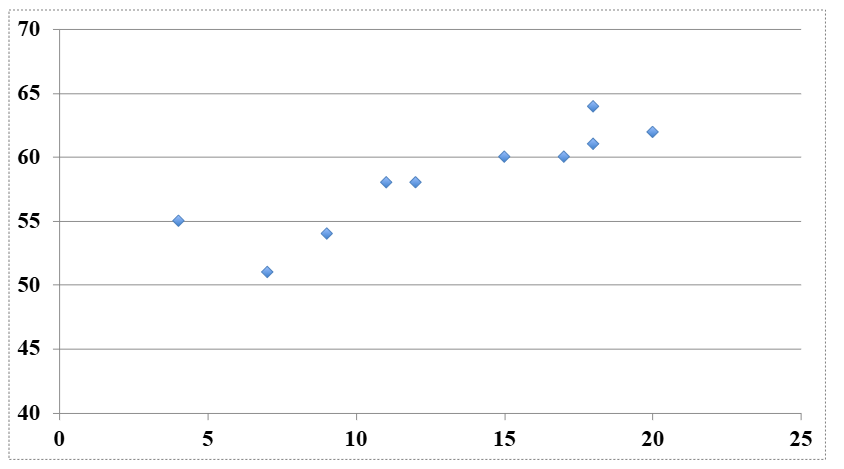
scatterplot
column graph
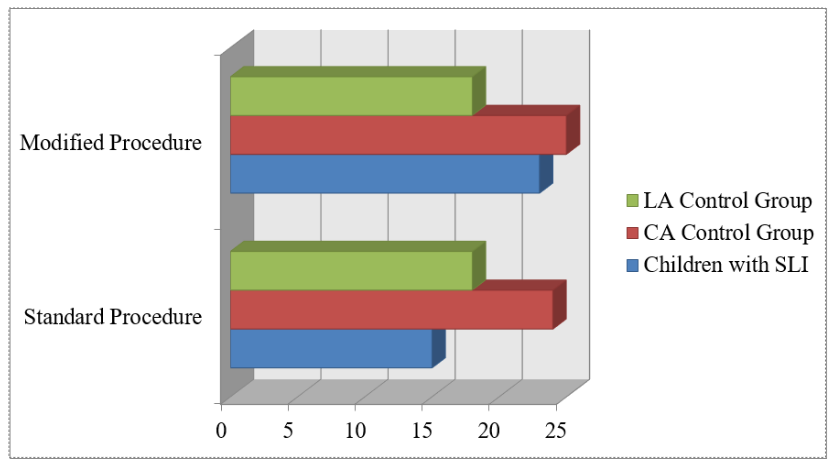
bar graph
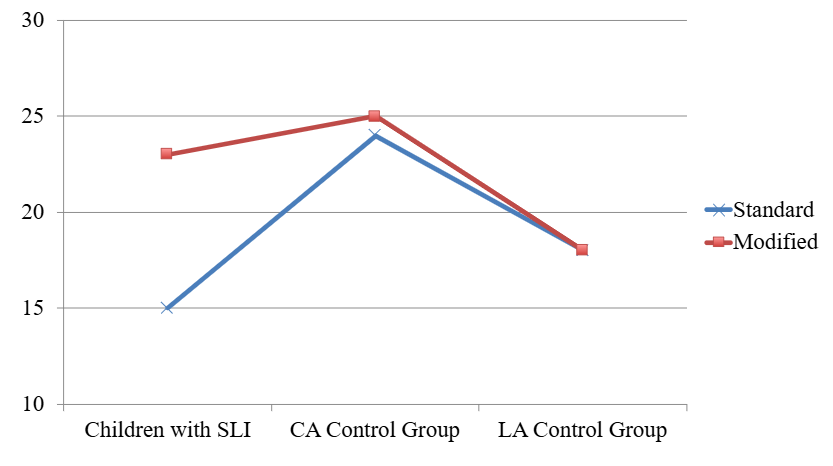
line graph
table
pie chart
useful for illustrating the percentages or proportions of observations that fit particular categories
*data must equal 100% or 1.0
scatterplot
useful for illustrating the relationship between two, and even three, continuous measures
column graph
useful for illustrating the relationship between two, and even three, continuous measures
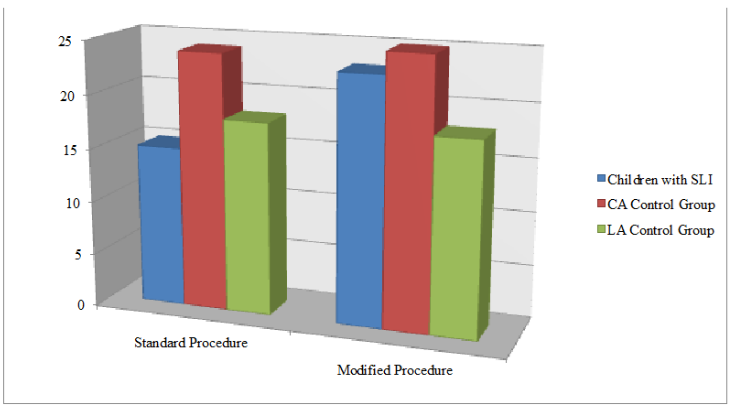
bar graph
useful for illustrating the relationship between two, and even three, continuous measures
line graph
useful for illustrating the relationship between two, and even three, continuous measures
frequencies and percentages
measures that convey how often phenomena occurred in a data set
*primary descriptive statistic for nominal level measurement
measures of central tendency
measures that convey information about typical and usual responses
ex: mode, median, mean
*scores that fall toward the middle of a set of scores
positive skew vs. negative skew
positive skew - data clusters on the lower end, tail is longer on the right
negative skew - data cluster on the higher end, tail is longer on the left
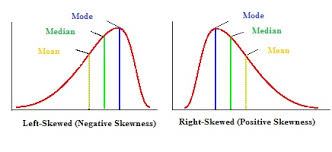
mode
the category, response, or number that occurs most frequently
median
number that occurs at the midpoint of a distribution
mean
average of the scores
measures of variability
minimum and maximum scores
range and interquartile range
standard deviation and variance
minimum and maximum scores
simplest way to convey variability is to report the minimum and maximum scores
50, 50, 55, 60, 65, 70, 70, 75, 75, 80, 85, 90, 95
minimum score is 50
maximum score is 95
range
the difference between the the minimum and maximum scores
interquartile range
the difference between scores at the 75th quartile and 25th quartile
standard deviation is
for dispersion of scores around the mean
square root of the variance
the levels of measurement include
nominal, ordinal, interval, and ratio levels
interaction effects
the effects associated with the way the independent variables work together
occur in a factorial research design when the outcomes associated with one independent variable are different depending on the level of the other independent variable
the importance of experimental control
increase the validity of conclusions regarding cause-and-effect relationships
a control group and random assessment is need, because without a control group or random assessment, the case for a cause-and-effect relationship between the independent variable and observed changes in the dependent variable is weak
threats to internal validity
evidence-based practice
an approach in which clinicians use the best available scientific evidence to guide their decisions about how to evaluate and treat persons with communication disorders
when clinicians engage in evidence-based practice, they are making decisions about how to serve their clients effectively based on multiple sources of information: (1) the best available evidence from systematic research, (2) their own professional experience and expertise, and (3) client and/or family considerations
descriptive statistics include
-frequencies and percentages
-measures of central tendency
-measures of variability
-means as estimates
-shapes of distributions
shapes of distribution
normal skew, positive skew, and negative skew
margin of error
a way to acknowledge possible errors in estimation
steps in calculating margin of error
obtain standard error (se), decide on level of confidence, enter values in the formula for margin of error
inferential statistics
analysis to determine the likelihood that the findings from a sample represent the situation in a population (level of confidence, probability of error, statistical significance)
type i error vs type ii error
i: reject the null hypothesis when it is correct
ii: fail to reject the null hypothesis when it is incorrect
differences between two samples tests
parametric tests - normal distribution, interval/ratio data
–independent t test
–paired t test
nonparametric tests - ordinal, small sample, or non-normal data
–mann-whitney u
–sign test
–wilcoxin matched-pairs signed-rank test
independent t test (parametric)
for independent samples, persons randomly assigned to each group
paired t test (parametric)
for related samples, persons tested twice or matched samples
mann-whitney u test
nonparametric test to examine the difference between two independent groups, used with ordinal level data or scores converted to ranks, often used with small groups, used for data with non-normal distributions
sign test
nonparametric test to examine the difference between two related sets of scores
used for two scores from the same participant or for matched pairs
wilcoxin matched-pairs signed-rank test
nonparametric test to examine the difference between two related sets of scores
use with paired scores from matched samples
difference between three or more samples test
parametric tests for one-way designs
–one-way analysis of variance (ANOVA)
–repeated measures analysis of variance
•parametric tests for factorial designs
–two-way analysis of variance
–mixed model analysis of variance
one-way analysis of variance (ANOVA)
procedure to test for differences among three or more independent groups, calculation based on variability within and across groups, controls for increased in experiment-wise error rate
repeated measures analysis of variance (ANOVA)
procedure to test for differences among three or more related sets of measures
–measures from the same participants
–participants serve as their own comparison
two-way analysis of variance (ANOVA) for factorial designs
two independent variables, independent variables have different "levels" (2 by 2 and 2 by 3)
mixed model analysis of variance (ANOVA) for factorial designs
two-way analysis of variance for a randomized pretest-posttest design, repeated measure for the pretest- posttest, between-group factor for comparison of treatments, analysis for randomized clinical trials
additional tools for analyzing clinical data
effect size measures for treatment studies
–cohen’s d
–effect size r
–number needed to treat (NNT)
•effect size measure for diagnostic studies
–sensitivity and specificity
post hoc tests
follow-up statistical analyses conducted after a significant ANOVA to identify which specific group means differ
measures of association
show relationship between variables
correlation (r) → strength + direction
positive = both increase, negative = opposite
chi-square → relationship between categories
regression → predicts one variable from another
correlation ≠ causation
r ranges from 0 to ±1