ALL SL IB ECO
1/136
Earn XP
Description and Tags
Name | Mastery | Learn | Test | Matching | Spaced | Call with Kai | Chat |
|---|
No analytics yet
Send a link to your students to track their progress
137 Terms
What is economics
Economics is the study of the choices that people make in overcoming the problems that arise because resources are limited, while needs and wants are unlimited (problem of scarcity).
scarcity
Scarcity is the problem of having infinite wants, or unlimited desires, while having only finite resources, or limited means, to fulfill these wants.
This problem of scarcity is the economic problem.
Choice
The scarcity of resources means that not all economic wants can be fulfilled. Choices must thus be made. Economic decision-makers continually make choices between competing alternatives, and economics studies the consequences of these choices, both present and future.
Efficiency
(Scarce) resources must be used with minimal wastage to produce combinations of goods and services to satisfy the many wants of members of society. This is known as allocative efficiency.
Equity
This refers to the concept of fairness. Policies that seek to achieve equity often aim for a more equal distribution of income, wealth or human opportunity.
Economic well-being
This refers to the living standards (quality of life) of residents and citizens in a country. The dimensions of economic well-being include:
present and future financial security
the ability to meet basic needs
the ability to make economic choices to achieve personal satisfaction
the ability to maintain adequate income levels over the long term.
Sustainability
This is the ability to use scarce resources without compromising their availability for future generations. Economic activities are sustainable when they do not incur environmental damage, resource depletion or degradation that will negatively affect future generations.
Change
The economic world isin a continual state of flux, and economists must be aware of this and adapt their thinking accordingly.
Interdependence
Consumers, firms, households, workers and governments (all economic actors) interact with each other within and, increasingly, across nations in order to achieve economic goals. The greater the level of interaction, the greater the degree of interdependence. In a highly interdependent economic world, decisions by certain economic actors will generate many, and often unintended, economic consequences for other actors. A consideration of possible economic consequences of interdependence is essential when conducting economic analysis.
Intervention
Governments need to intervene in markets when they fail to achieve certain societal goals, such as equity, economic well-being or sustainability.
The solution to the economic problem
In order to solve the economic problem, we must make choices between the different alternatives we are faced with. In a general economy these choices must be made on:
• What to produce?
• How to produce?
• For whom to produce?
Means of answering the economic questions
The free market economy is an economy where the factors of production are privately owned. The market forces (demand and supply) determine what and how much to produce, how to produce and for whom to produce.
The planned economy exists where factors of production are owned by the state (except labour). The state determines what and how much to produce, how to produce and for whom to produce.
The mixed economy has elements of planned and free market economies. In reality, all economies are mixed. What differs is the degree of state intervention from country to country.
Opportunity cost
scarcity necessitates choice. The value of the next best alternative that is lost while making a choice. (what you give up in order to have something else.)
A free good is a good with zero opportunity cost. This means it can be consumed in as much quantity as needed without reducing its availability to others
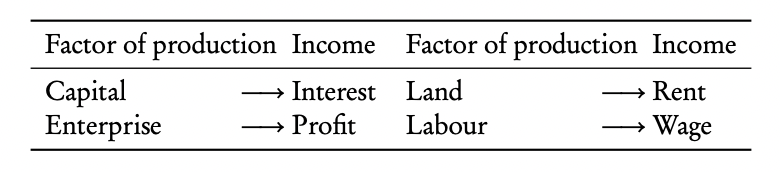
The factors of production that are used to produce goods and services
Land: Land includes all the resources provided by nature that are used to produce goods.
Labour: Labour includes all the human resources used in producing goods and services. It is the physical and mental contribution of the existing workforce to production.
Capital: Capital is the factor of production that includes all the buildings, offices, factories, machines, tools, infrastructure and technologies that are used to produce goods and services.
Entrepreneurship (management): Management is the organizing and risk-taking factor of production. Entrepreneurs organize the other factors of production - land, labour and capital — to produce goods and services. They may use their personal money and the money of other investors to develop new ways of doing things and new products, buy the factors of production, produce the goods and services and, hopefully, make a profit.

The production possibilities curve model (PPC)
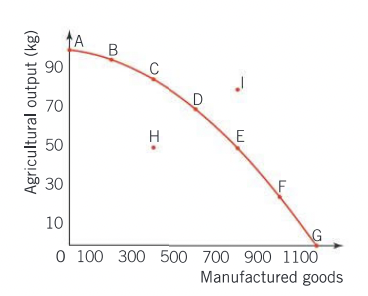
This simple model may be used to illustrate the concepts of scarcity, choice, opportunity cost and efficiency. The definition of a production possibilities curve is that it is a curve showing the maximum combinations of two types of output that can be produced in an economy in a given time period, if all the resources in the economy are being used efficiently and the state of technology is fixed.
The PPC model contains several assumptions:
It is assumed that the economy produces only two goods.
It is assumed that the resources and state of technology are fixed.
It is assumed that all the resources in the economy are fully employed.
The PPC model shows the following:
Due to scarcity, it is impossible to produce outside the PPC: point I is unattainable, meaning it is not possible to produce that combination of goods.
Due to scarcity, it is necessary to make choices: the economy that has full employment and is efficient must choose its point of production; any point on the PPC.
Choice gives rise to opportunity cost: It is not possible to increase production of one good without decreasing production of the other good.
Efficiency: Point H illustrates unemployment of resources, or inefficient use of resources. By using the factors of production more efficiently, the economy could move closer to the PPC, increasing its output of agricultural output and manufactured goods. Any points underneath the PPC are possible, but would indicate a lack of efficiency, and some waste of resources.
If there is an improvement in the quality or an increase in the quantity of the factors of production, or technological advancements, then the PPC would shift outwards
constant vs increasing opportunity cost
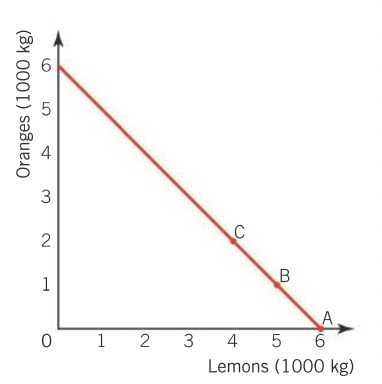
A straight line PPC indicates constant opportunity costs, whereas the concave PPC indicates increasing opportunity costs.
If the opportunity cost were constant, with each additional unit of manufactured goods costing the exact same amount of agricultural output.
The reason why the opportunity cost increases is due to the fact that not all the factors of production used to produce agricultural output are equally suitable for producing manufactured goods.
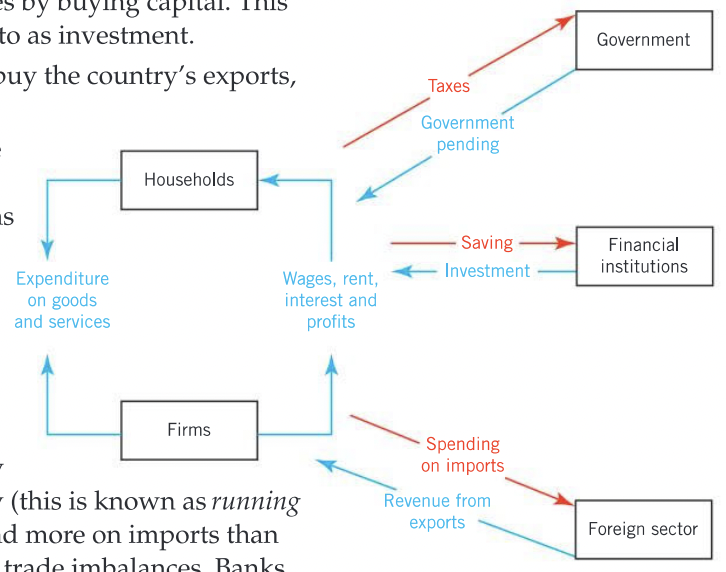
Circular flow of income model
Circular flow of income model can illustrate the interdependence between economic decision-makers interacting and making choices in an economy: households, firms, the government, the banks, financial sector, and the foreign sector (foreign firms and households)
Consumers do not spend all their income on domestically-produced goods and producers do not pass on all their income to the domestic households. The income that leaves is known as a leakage:
Taxes: some of the income from both households and firms goes to the government sector in the form of taxes.
Saving: both households and firms save some of their income in financial institutions. Examples of these include banks, stock markets and pension funds.
Imports: both households and firms spend some of their money on foreign goods and services.
The income that comes in is known as an injection:
Government spending: Governments at all levels (local district councils to national governments) spend on all kinds of things including education, health care, the maintenance of law and order, infrastructure and salaries for government workers.
Investment: The financial sector lends money to firms, which they use to start up or expand their businesses by buying capital. This spending by firms on capital is referred to as investment.
Exports: Foreign households and firms buy the country’s exports, injecting money into the economy.
Ceteris paribus
“all other things being equal”.
When economists want to test the effect of one variable on another, they need to isolate the effect of the one variable by assuming that there is no change in any of the other variables.
Origin of economic ideas in a historical context
18th century: Adam Smith and laissez faire (the market should be completely free to be led by the natural laws of supply and demand (capitalist economic system))
19th century: classical microeconomics (utility); the concept of the margin; Classical macroeconomics (Say’s law); Marxist critique of classical economic thought
20th century: Keynesian revolution; rise of macroeconomic policy; monetarist/new classical counter revolution
21st century: increasing dialogue with other disciplines such as psychology and the growing role of behavioural economics; increasing awareness of the interdependencies that exist between the economy, society and environment and the need to appreciate the compelling reasons for moving toward a circular economy
Market
The interaction of consumers (buyers) and producers (sellers) that determines the price for goods and services.
Demand (D)
The quantity of a good that buyers (consumers) are willing and able to buy at various prices over a time period, ceteris paribus
The law of demand
law of demand states that there is a negative causal relationship between price (P) and quantity (Q) of a good demanded: the higher the price, the lower the quantity demanded; the lower the price, the greater the quantity demanded. (when price goes up, ceteris paribus, quantity demanded goes down.)
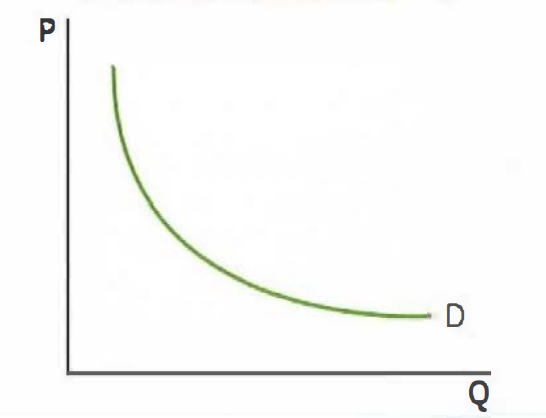
Demand curve
The law of demand is illustrated by the demand curve, which is downward sloping.
Consumers derive benefits from buying/consuming goods and services. The additional benefits derived from buying/consuming one more unit of a good are called marginal benefits (MB). As we buy more and more units of a good, the marginal benefits we enjoy decrease. Since MB decreases as Q consumed increases, consumers will be willing to buy more and more units of a good only if its price falls. Therefore as P decreases, Q demanded increases, and vice versa.
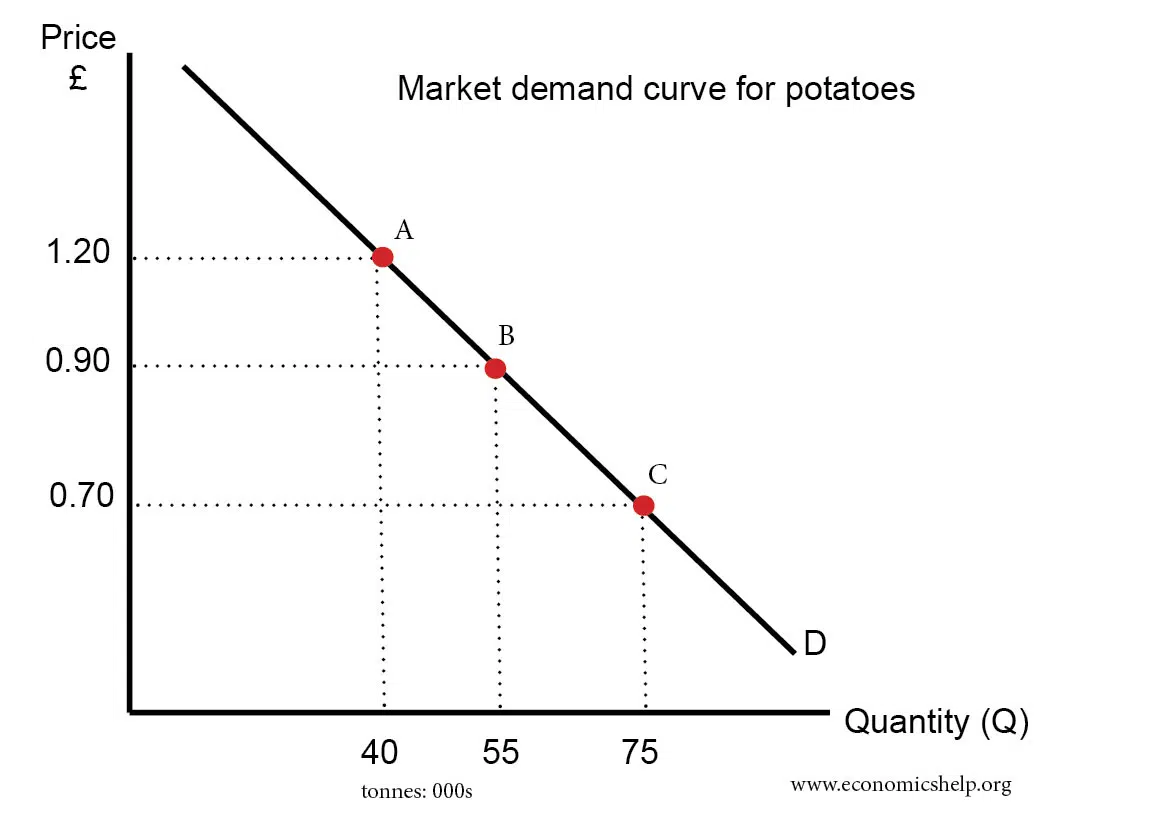
Individual consumer’s demand and market demand
Individual demand = the demand of a single buyer
Market demand = the demands of all the buyers in a market, found by adding up all the individual demands for each price. In a market with two buyers, market demand, Dm = D of Buyer 1 + D of Buyer 2.
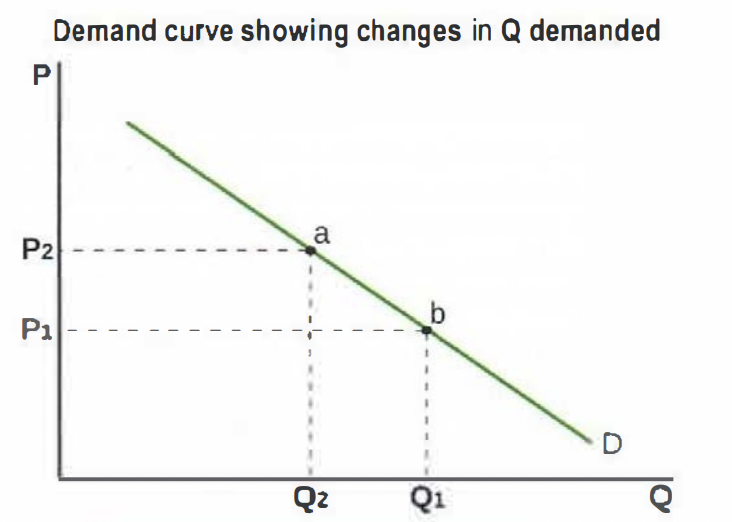
Movement along the demand curve
A movement along the demand curve for a good can be caused only by a change in the price of the good. according to the law of demand if price increases, Quantity demanded decreases and there is an upward movement (b→a) if price decreases and quantity demanded increases there is a downwards movement (a→b). The change in Q due to the change in P is called the change in quantity demanded.
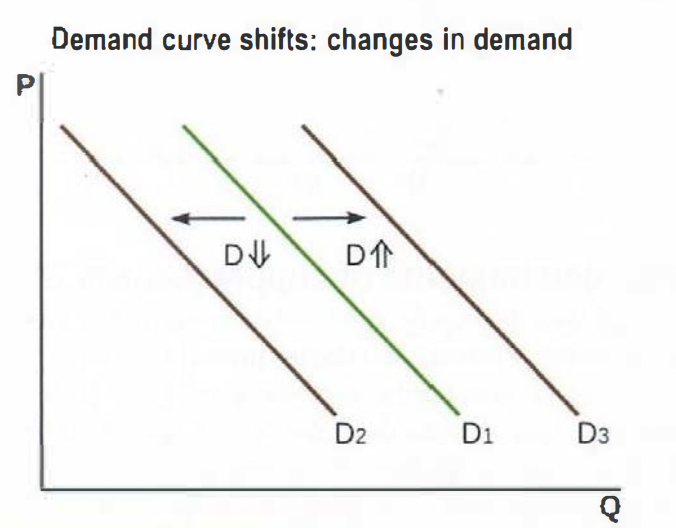
Shift of a demand curve
A shift of the demand curve for a good can be caused only by a change in any of the non-price determinants of demand. A rightward shift indicates an increase in demand and a leftward shift indicates a decrease in demand. The change in Q due to the shifts in D is called a change in demand.
Non-price determinants of demand
Changes in income: The effects on D depend on whether the good is:
(i) normal = demand for the good increases as consumer income increases: as income rises, D increases (shifts right); as income falls, D falls (shifts left)
(ii) inferior = demand for the good decreases as consumer income increases: as income rises, D falls (shifts left); as income falls, D increases (shifts right)
Changes in tastes and preferences: When tastes and preferences of consumers change in favour of a good, D increases (shifts right); if references change against a good, D decreases (shifts left)
Future price expectations: If consumers think that the price of a product will increase in the future, then D may increase in the present, taking advantage of the current lower prices (shift right). If consumers expect the price of a product to fall in the future, then D may decrease in the present, postponing their demand until a future date (shift left)
Changes in prices of related goods The effects on D depend on whether the related goods are:
(i) substitutes = goods that satisfy a similar need: as P of good A increases, D for good B increases (shifts right); as P of good A falls, D for good B falls (shifts left)
(ii) complements = goods that are used together: as P of good A increases, D for good B decreases (shifts left); as P of good A decreases, D for good B increases (shifts right)
Number of consumers: Changes in the number of buyers (demographic changes). If the number of buyers in a market increases, D increases (shifts right); if the number of buyers decreases, D decreases (shifts left)
Supply
supply (S) is the quantity of a good that sellers (firms) are willing and able to produce and sell at various prices over a time period, ceteris paribus
The law of supply
Law of supply states that there is a positive causal relationship between price (P) and quantity (Q) of a good supplied.
As the price of a product rises, the quantity supplied of the product will usually increase, ceteris paribus
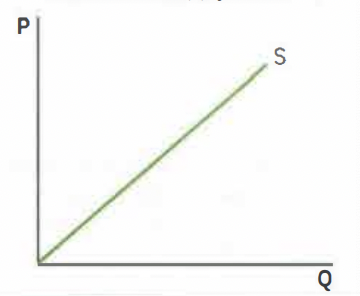
The law of supply is illustrated by the supply curve, which is upward sloping.
Supply curve
The price at which the firm sells its good determines the revenue of the firm. As the price of a good increases, the firm receives more revenue, production of the good becomes more profitable, therefore it is in firms' interests to increase the quantity they produce. The reason for greater profitability is that as price and revenue increase, firms are better able to cover the higher costs of production that arise from increased quantity produced. Therefore as P increases, Q supplied increases, and vice versa.
Individual supply and market supply
Individual supply = the supply of a single seller (firm)
Market supply = the supplies of all the sellers in a market, found by adding up all the individual supplies for each price. In a market with two sellers, market supply, Sm = S of Seller 1 + S of Seller 2.
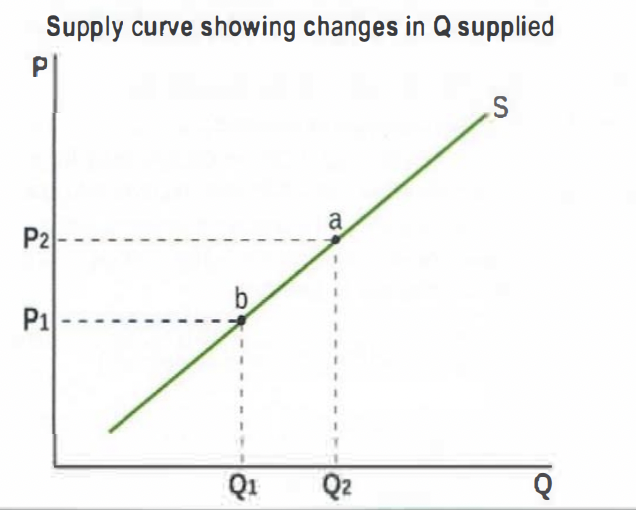
Movement along a supply curve
A movement along the supply curve for a good can be caused only by a change in the price of the good. According to the law of supply, if P increases, Q increases and there is an upward movement (b => a). The change in Q due to the change in P is called a change in quantity supplied.
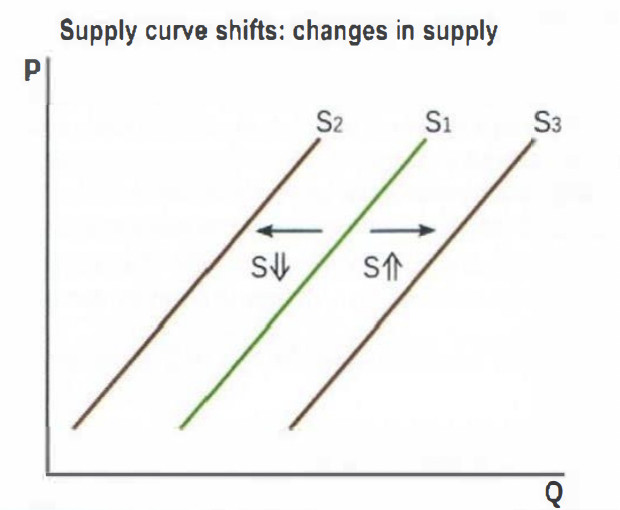
Shift of a supply curve
A shift of the supply curve for a good can be caused only by a change in the non-price determinants of supply. A rightward shift indicates an increase in supply and a leftward shift indicates a decrease in supply. The change in Q due to the shifts in S is called a change in supply.
Non-price determinants of supply
Changes in costs of factors of production (FOPs): if the prices of factors of production (labor, land capital, entrepreneurship) increase, S falls (shifts left), if factor prices decrease, S increases (shifts right)
Prices of related goods): The effects on supply depend on whether the related goods are in:
joint supply = when two or more goods are derived from a single product, it is not possible to produce more of one. If the price of product A falls, Q of product A produced decreases (downward movement along the S curve) and S of product B falls (S curve shifts left).
competitive supply = when two goods use the same resources it is not possible to produce more of one without producing less of the other. If the price of product A increases, the Q of product A produced increases (upward movement along the S curve) and the S of product B falls (S curve shifts left).
Indirect taxes and subsidies: if an indirect tax increases, S falls (shifts left). If a subsidy on the product of a firm increases, S increases (shifts right)
Future price expectations: if firms expect the future price of their product to increase, they supply less in the market in the present so they can sell more in the future at the higher price so S falls (shifts left)
Changes in technology: if there is a technological improvement, producers can produce more (less) efficiently S increases (shifts right)
Number of firms: When there are more competitors on the market, the producers will face increased competition, decreasing their market shares. This causes them to produce less (shifts right)
Market equilibrium
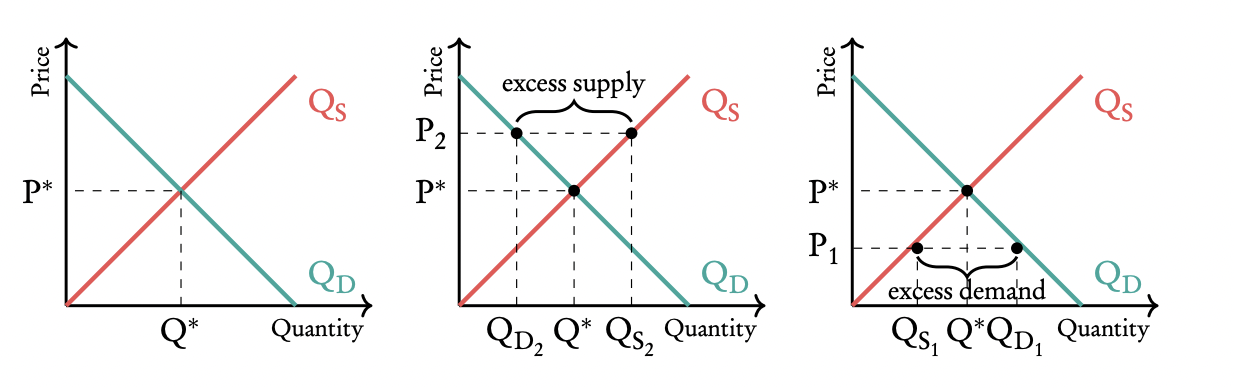
Market equilibrium is a position of balance between demand and supply, and occurs when quantity demanded is equal to quantity supplied. In the diagram, this point of equality is where the D and S curves cross each other, determining equilibrium price, Pe, and equilibrium quantity, Qe. At every price other than Pe, there is market disequilibrium.
If P > Pe => excess supply = surplus => Q demanded < Q supplied.
If P < Pe, => excess demand = shortage => Q demanded > Q supplied.
In a free, competitive market, where there is no interference with the forces of supply and demand, P and Q will always settle at their equilibrium values.
If there is a shortage, the excess demand will ensure that P increases to Pe.
If there is a surplus, the excess supply will ensure that P decreases to Pe.
Price mechanisms
The price mechanism in a free market economy is the way in which price changes affect quantity demanded and quantity supplied, thus determining resource allocation in a market.
Resource allocation
The signalling function of the price mechanism communicates important information to both producers and consumers. When prices rise, this acts as a signal that demand is increasing or supply is falling. This encourages producers to increase output and discourages consumers from overconsuming. Conversely, when prices fall, the signal is that there is too much supply or insufficient demand, prompting producers to reduce output and consumers to buy more. In this way, prices act like traffic lights in the economy, guiding behaviour to restore market balance.
The incentive function is closely tied to economic motivation. Rising prices serve as a financial incentive for producers to increase production because they can earn more profit. At the same time, higher prices discourage consumers from purchasing as much of the good. Lower prices work the other way around, motivating consumers to buy more and producers to supply less. These incentives lead to a reallocation of resources to where they are most demanded, helping markets self-correct and return to equilibrium.
The rationing function comes into play when there is scarcity. Prices help determine who gets access to limited goods and services. As prices rise due to excess demand, only those consumers who are both willing and able to pay can purchase the good. This means the good is rationed based on consumers' purchasing power. In extreme situations, governments may step in to ration goods directly, but in a free market, prices perform this role automatically.
Shifting the demand and supply curves to produce a new market equilibrium
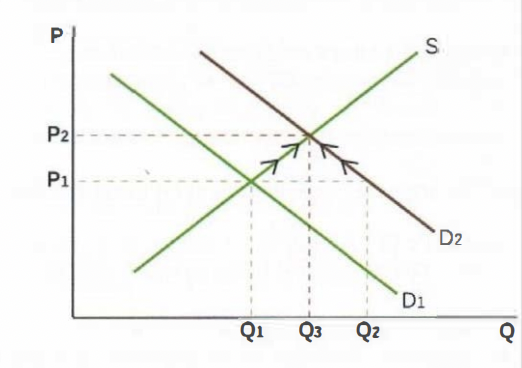
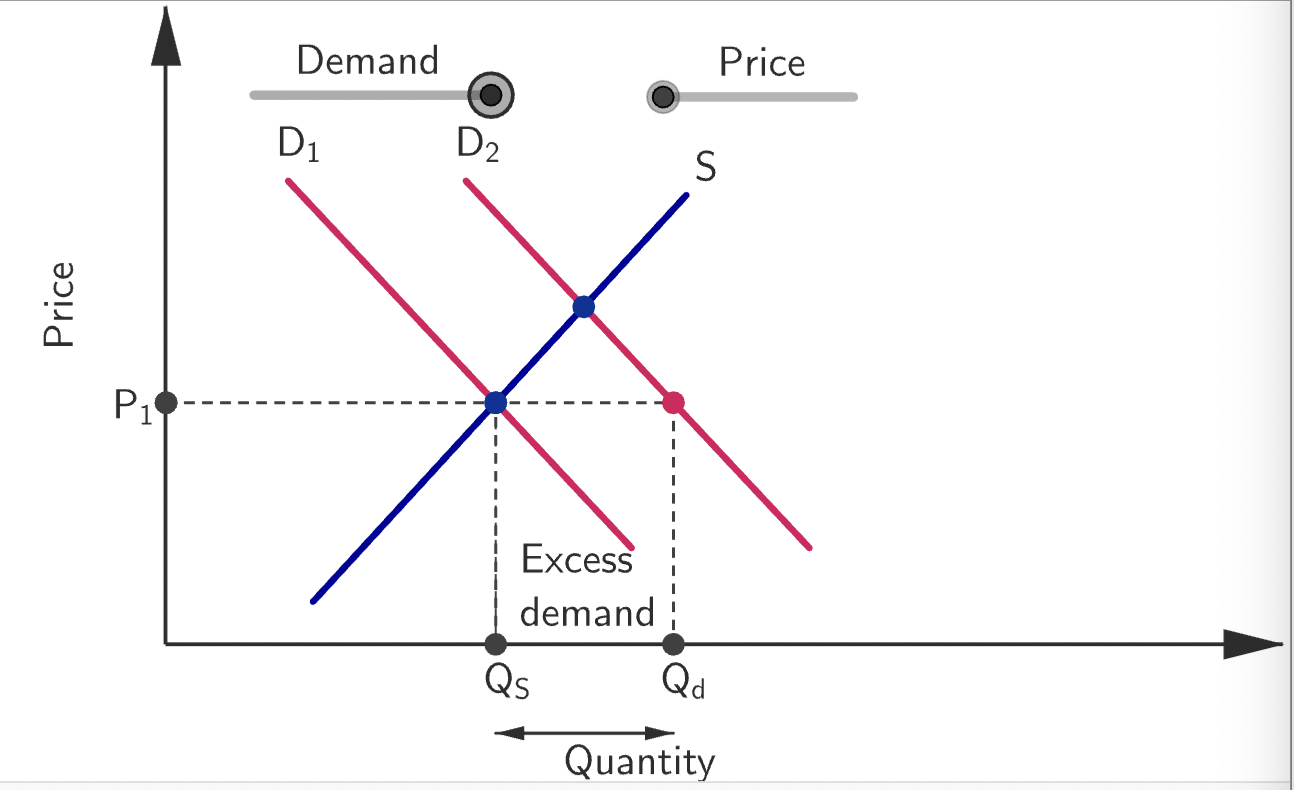
Prices determined in markets play a crucial role in allocating resources to the production of specific goods. The economy is initially at P1 and Q1. Suppose D increases from D1 to D2 (due to a change in a non-price determinant). At the initial price, P1, there is excess demand(= Q2 - Q1) => P begins to increase acting as:
a signal to producers and consumers that there is a shortage; i.e. the rising P provides information about the shortage to producers and consumers
an incentive to producers to produce more Q, leading to an upward movement along the S curve (Q supplied increases) because of firms' greater willingness and ability to produce as P increases; and an incentive to consumers to buy less Q than Q2, leading to an upward movement along the D2 curve (Q demanded decreases) because of consumers' lower willingness and ability to buy as P increases.
-The new market equilibrium settles at price P2 and quantity Q3.
-Resource reallocation has occurred, as some resources were taken out of production of other goods and brought into production of this good (Q3> Q1) .
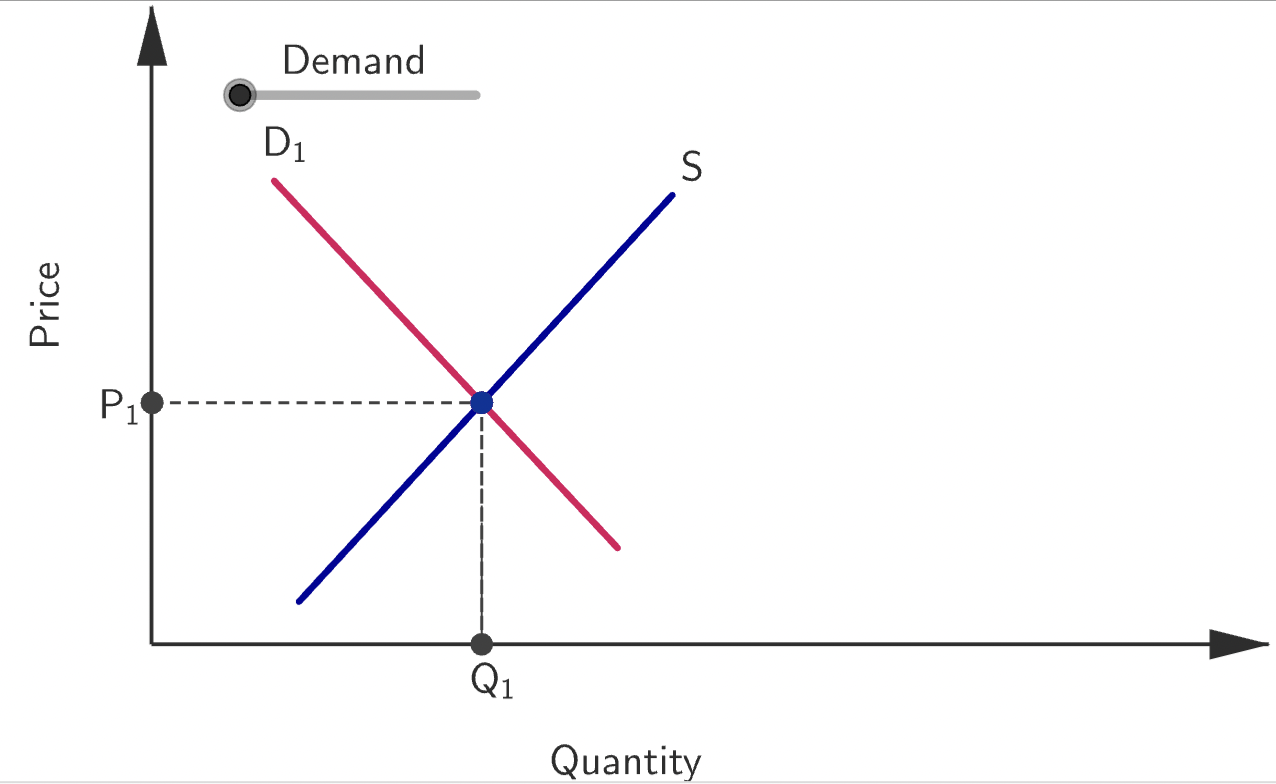
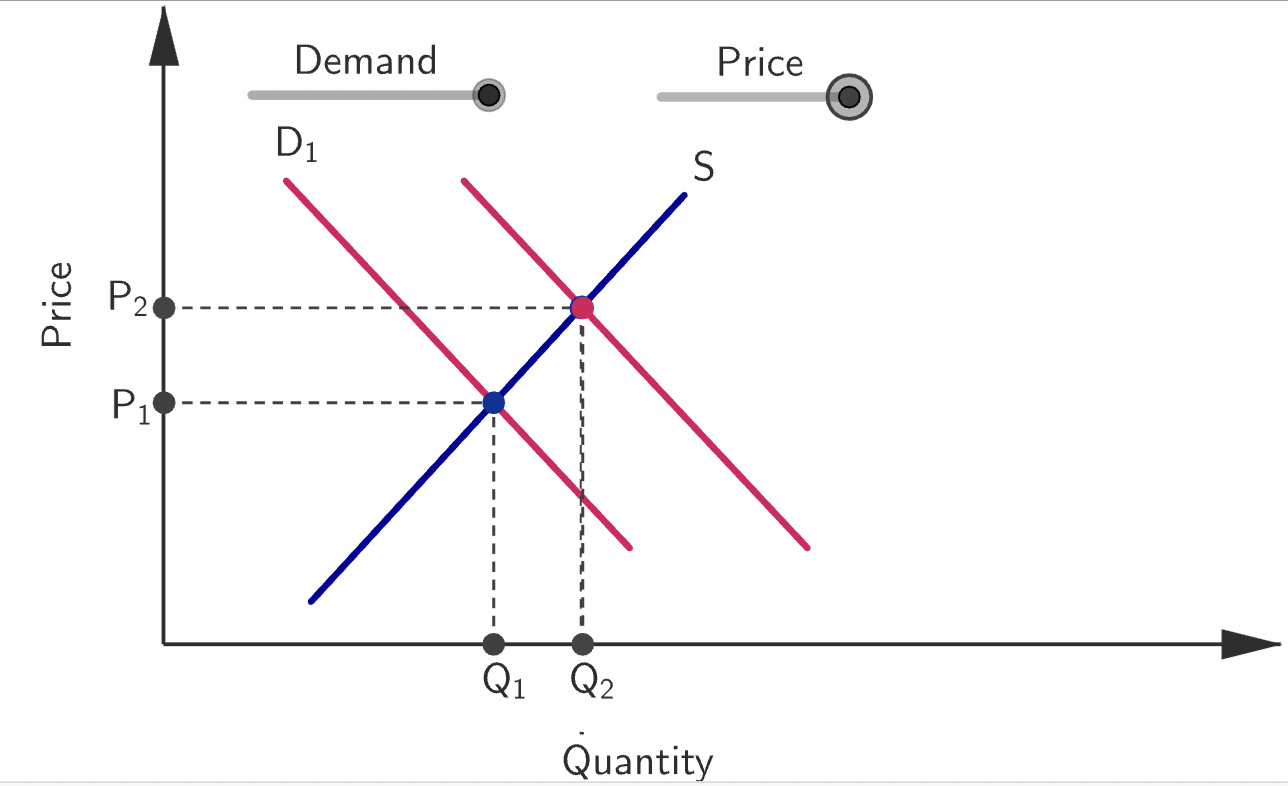
The market is at equilibrium with equilibrium price P1 and equilibrium quantity Qr.The quantity supplied is equal to the quantity demanded.
An increase in demand causes market disequilibrium. The quantity that consumers are willing and able to purchase at price P1 is more than the quantity available. In other words, the quantity demanded (Qd) is more than the quantity supplied (Qs). As a result, the price will increase.
The increasing price is an incentive for both consumers and producers to change their behaviour. Fewer consumers are willing and able to purchase the good or service, so the quantity demanded (Qd) decreases. At the same time, the increased price provides an incentive for producers to supply more, so the quantity supplied (Qs) increases. These changes in the behavior of both consumers and producers result in the market reaching a new equilibrium price (P2) at which quantity demanded and quantity supplied are equal (Q2).
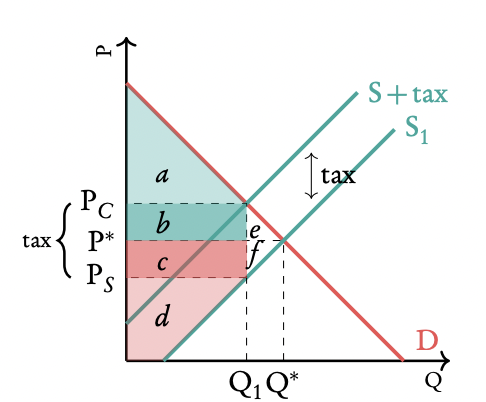
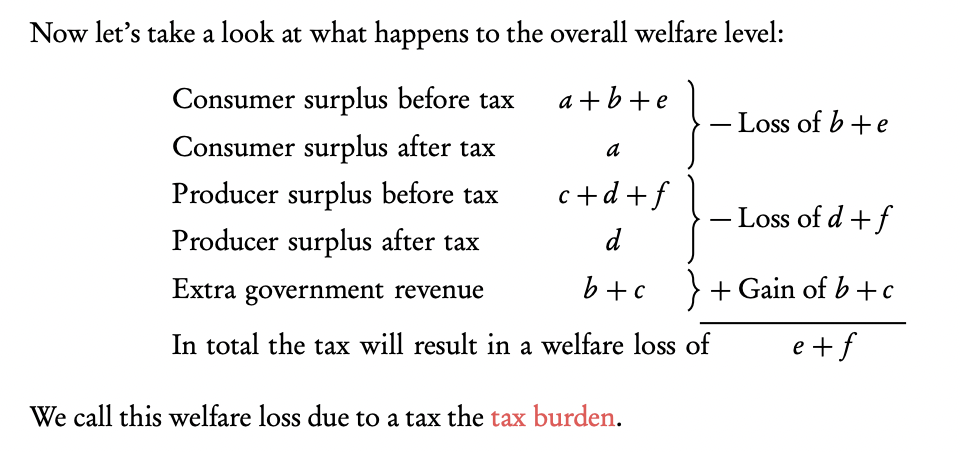
Consumer and producer surplus
consumer surplus = The extra satisfaction gained by consumers from paying a price that is lower than the price they were prepared to pay → total welfare gained from being able to consume.
producer surplus= The excess of actual earnings that a producer makes from a given quantity of output above the amount a producer would be willing to accept for that output → total welfare gained from being able to produce; equal to producer profits.
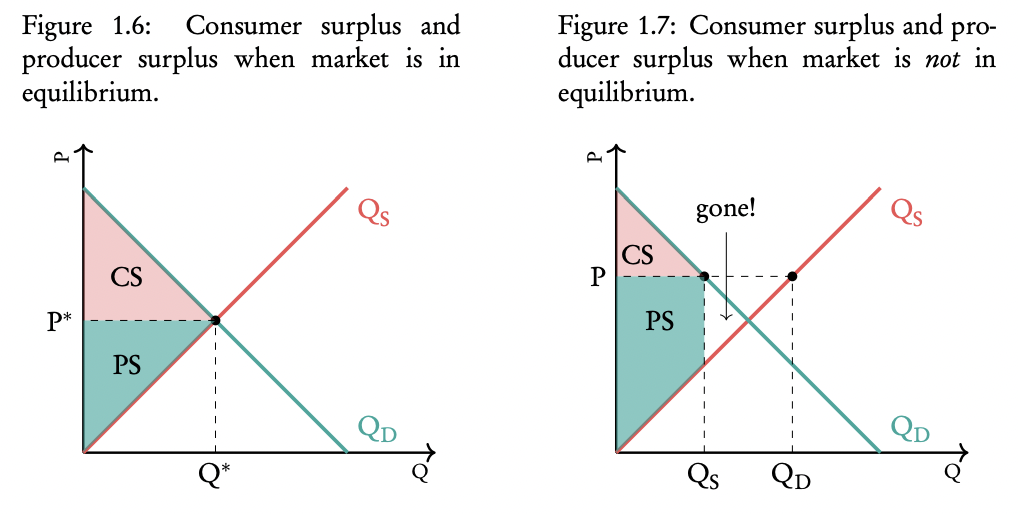
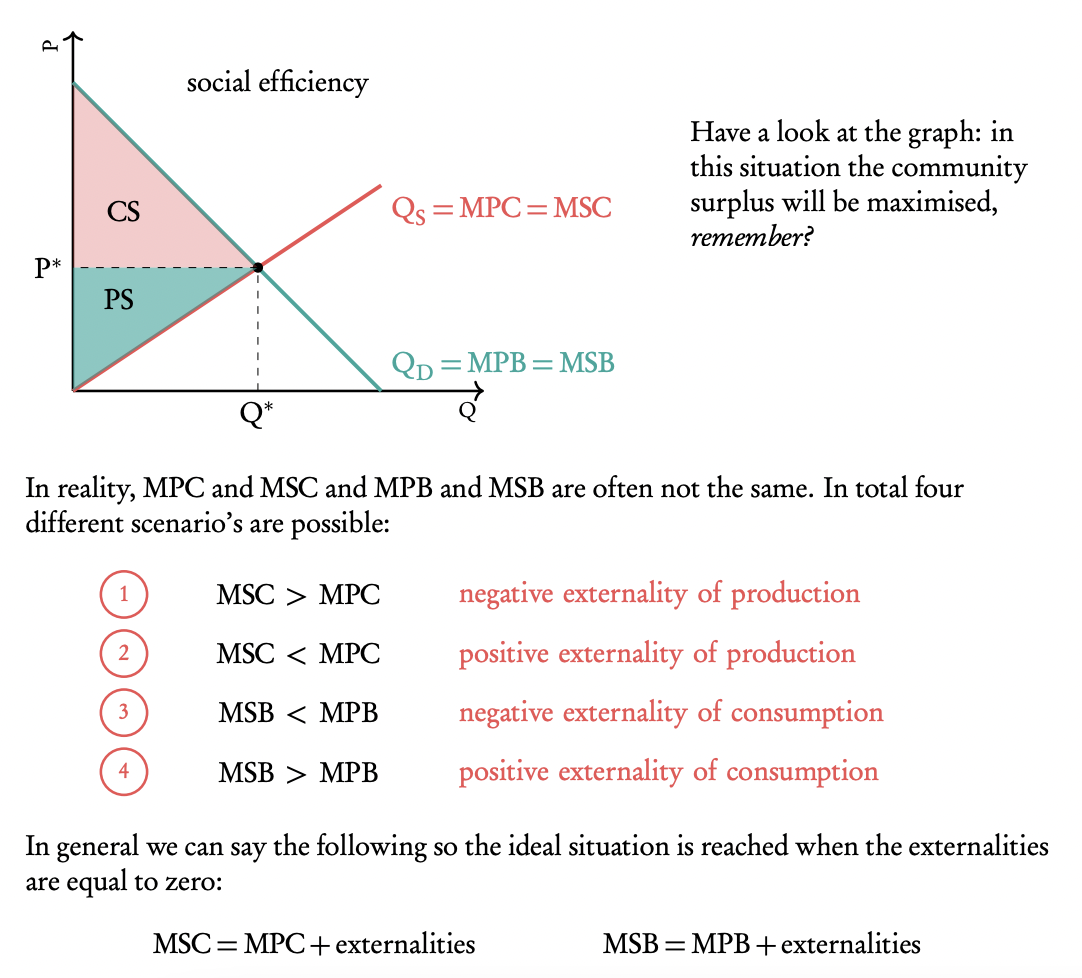
Social/community surplus
social surplus = the sum of producer and consumer surplus. In a free competitive market, social surplus is maximum.
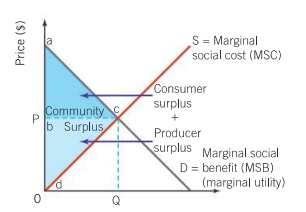
Allocative efficiency
Allocative efficiency occurs in a competitive market when resources are distributed in a way that maximizes the total benefit to society. This optimal outcome happens at the market equilibrium, where the quantity demanded equals the quantity supplied. At this point, marginal benefit (MB) — the additional satisfaction gained by consumers from consuming one more unit — is equal to marginal cost (MC) — the additional cost to producers of producing one more unit.
At equilibrium, community (or social) surplus, which is the sum of consumer surplus (the difference between what consumers are willing to pay and what they actually pay) and producer surplus (the difference between what producers receive and their costs), is maximized. This maximization of total surplus means that no other price or quantity combination could make society better off. Therefore, allocative efficiency represents the most desirable allocation of resources from society’s perspective, assuming no externalities. In efficiency terms, this is also where marginal social benefit (MSB) equals marginal social cost (MSC).
Elasticity
Economists use the concept of elasticity to measure how much something changes when there is a change in one of the determinants. Elasticity is a measure of responsiveness.
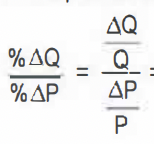
Price elasticity of demand (PED)
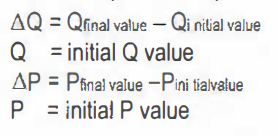
The price elasticity of demand is used to measure the effect a change in price has on the demand for a certain good. It can be calculated as follows:
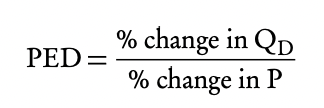
The outcome of PED is typically negative (because there is a negative relationship between price and quantity demanded) but in economics we do not write the minus symbol of the PED. What does the outcome mean? If price increases by a certain percentage, quantity demanded will decrease by PED × that percentage. (If for example PED = 2 and price increased by 10%, demand would decrease by 20%).
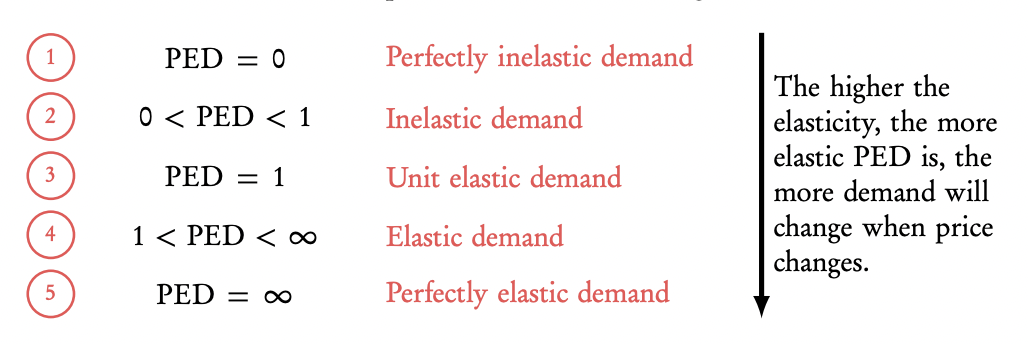
Price elastic demand: PED > 1: %ΔQ > %ΔP = the percentage change in Q demanded is greater than the percentage change in P (the change in Q is proportionately larger than the change in P)
Price inelastic demand 0 < PED < 1: %ΔQ < %ΔP = the percentage change in Q demanded is smaller than the percentage change in P (the change in Q is proportionately smaller than the change in P)
PED is different at each point of the demand curve. In the middle it is equal to 1. Left of the middle of the demand curve PED will be elastic; right of the middle of the demand curve it will be inelastic.
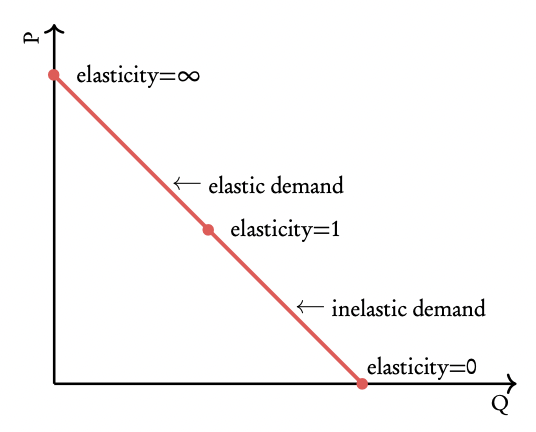
There are two exceptions to the rule above:
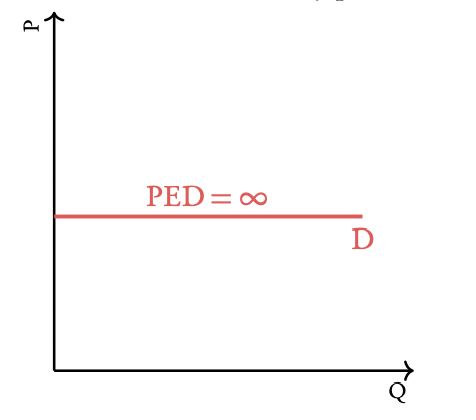
Perfectly inelastic demand: On a completely horizontal demand curve, PED = ∞ at every point. : the percentage change in Q demanded resulting from a change in P is infinitely large
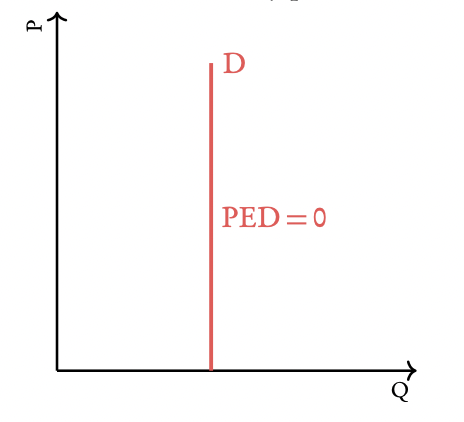
Perfectly inelastic demand: On a completely vertical demand curve, PED = 0 at every point. the percentage change in Q demanded is zero; no matter how high P rises, Q demanded does not respond
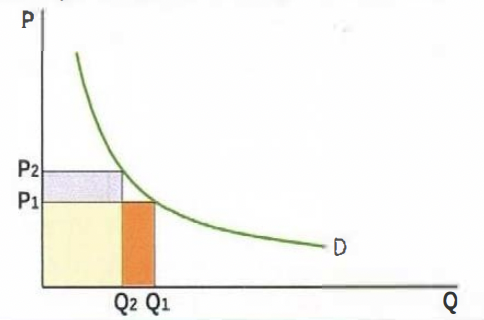
Unit elastic demand: PED = 1 at every point. the percentage change in Q demanded is equal to the percentage change in P (change in Q is proportionately equal to change in P)
Determinants of PED
The number and closeness of substitutes: The more substitutes, the higher PED. If there are a lot of substitutes, consumers can easily switch to another product when the price of the product increases.
The degree of necessity: The higher the need for the product, the lower PED. Consumers will buy goods they need anyway, regardless of the price.
The time period over which PED is measured: The longer this time period, the higher PED. In the long run, consumers have more time to look for alternatives / substitutes for a good. They will switch more often if the price of the good increases.
The proportion of income spent on the good: The smaller this proportion, the lower PED. When the proportion of income spent on a good is low, consumers will not notice or care about a price change and still buy the same proportion of the good.
Relationship between PED and total revenue
Total Revenue (TR) = Price (P) × Quantity (Q). How TR changes when price changes depends on the PED of the product:
When PED is elastic (PED > 1, % change in Q > % change in P), firms should lower their price to get more revenue because in that case demand will increase more than the price will decrease. (if price decreases, quantity demanded increases proportionally more so the total revenue will increase)
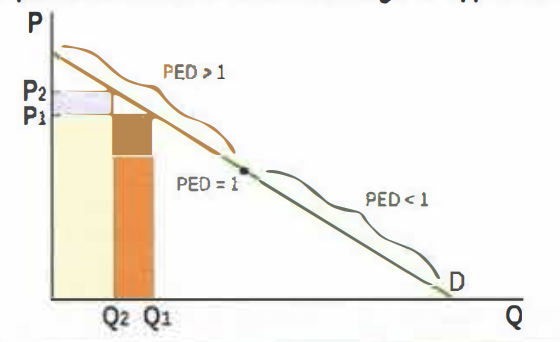
The opposite will be the case when PED is inelastic (PED < 1, % change in Q < % change in P). if price increases the quantity demanded decreases proportionally less so the total revenue increases.
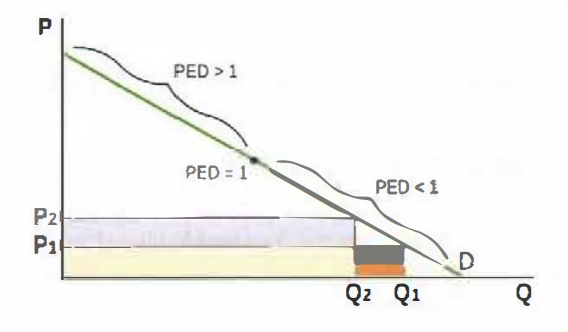
When PED = 1 (% change in Q = % change in P), the firm should leave the price at the current level; revenue is maximised at this point. the change in price will have an equal opposite effect on
quantity demanded so an equal effect on total revenue
PED and the governement
Governments want to tax goods with an inelastic PED because demand changes less than the price increase due to the tax, so they can make more tax revenue on these goods.
Indirect taxes= taxes on spending to buy particular goods, aid indirectly to the government through the seller of the good
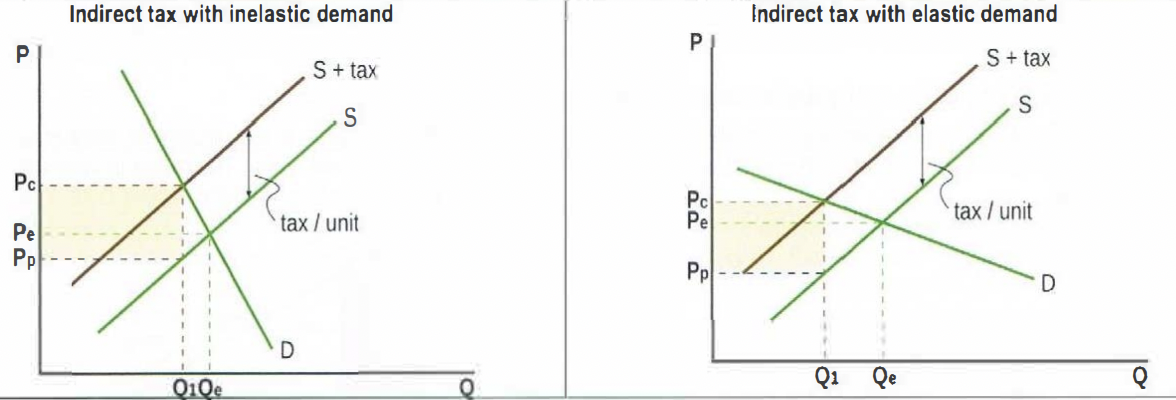
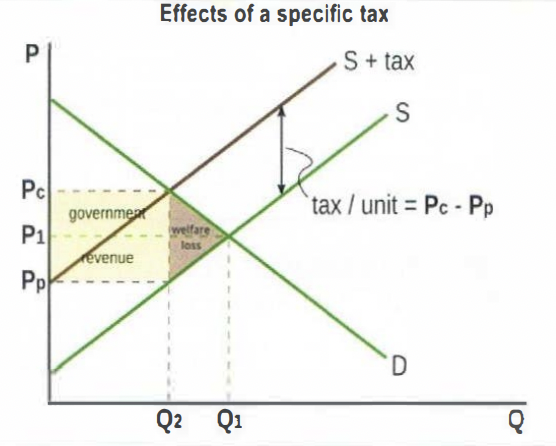
When an indirect tax is imposed, the supply curve shifts left/up, and the vertical gap between the original and new curves equals the tax per unit. After the tax, the price paid by consumers (Pc) rises, the price received by producers (Pp) falls, and quantity (Q1) drops. The tax per unit is Pc - Pp, and total government revenue is this amount multiplied by Q1.
The more inelastic the demand (lower PED), the smaller the drop in quantity, so tax revenue is higher.
Income elasticity of demand (YED)
The income elasticity of demand is used to measure the effect that a change in income of consumers has on the demand for a certain product. It can be calculated as follows:
The outcome of YED can be positive or negative:
+ If the outcome of the YED is positive, the good of which the YED is calculated is a normal good. When income increases, so does consumption of the good. (as income increases, D for the good increases (D shifts right))
− If the outcome of the YED is negative, the good will be an inferior good. When income increases the consumption of the good will decrease. (as income increases, D for the good decreases (D shifts left))
What does the outcome mean? If the income of consumers is increased by a certain percentage, the quantity demanded the good will increase by YED × that percentage. (If, for example, YED = −2 and the income of consumers has increased by 10%, demand for the good would decrease by 20%).
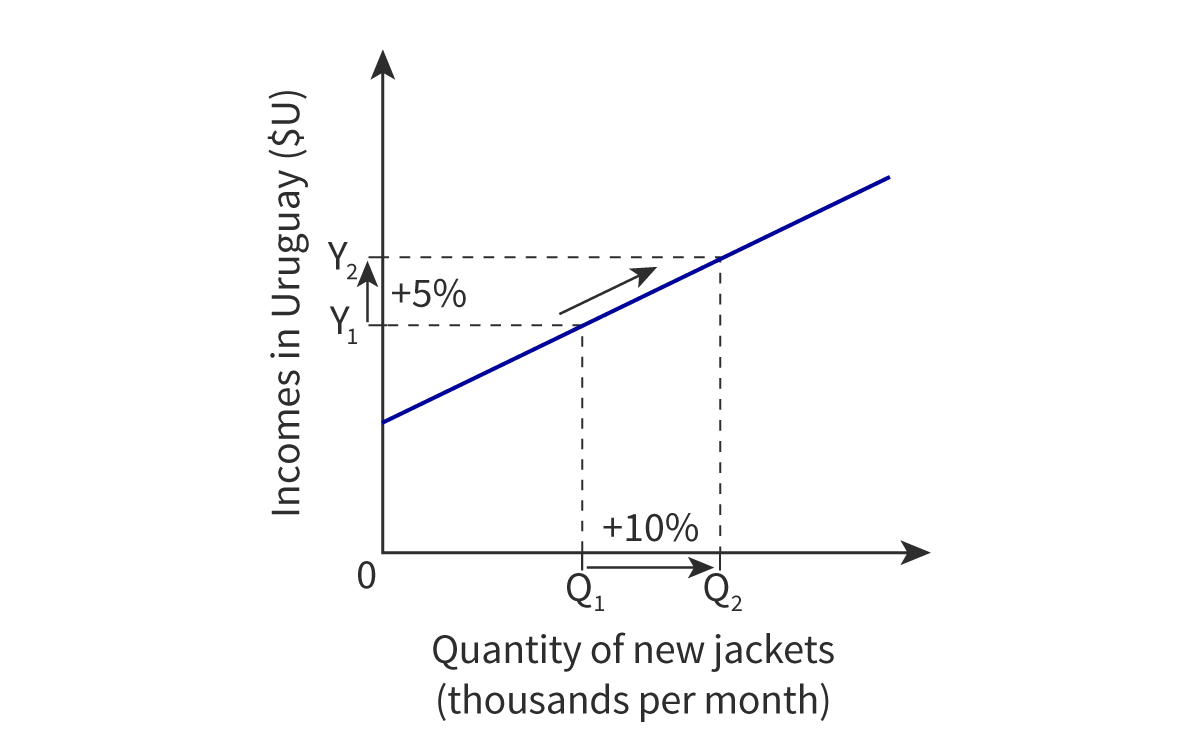
If YED > 1, (%ΔQ < %ΔY) YED is said to be income elastic and the good of which YED is calculated is a luxury good because an increase in income will lead to a spectacular increase in demand for these goods. Examples of luxury goods include jewelry and sports cars.
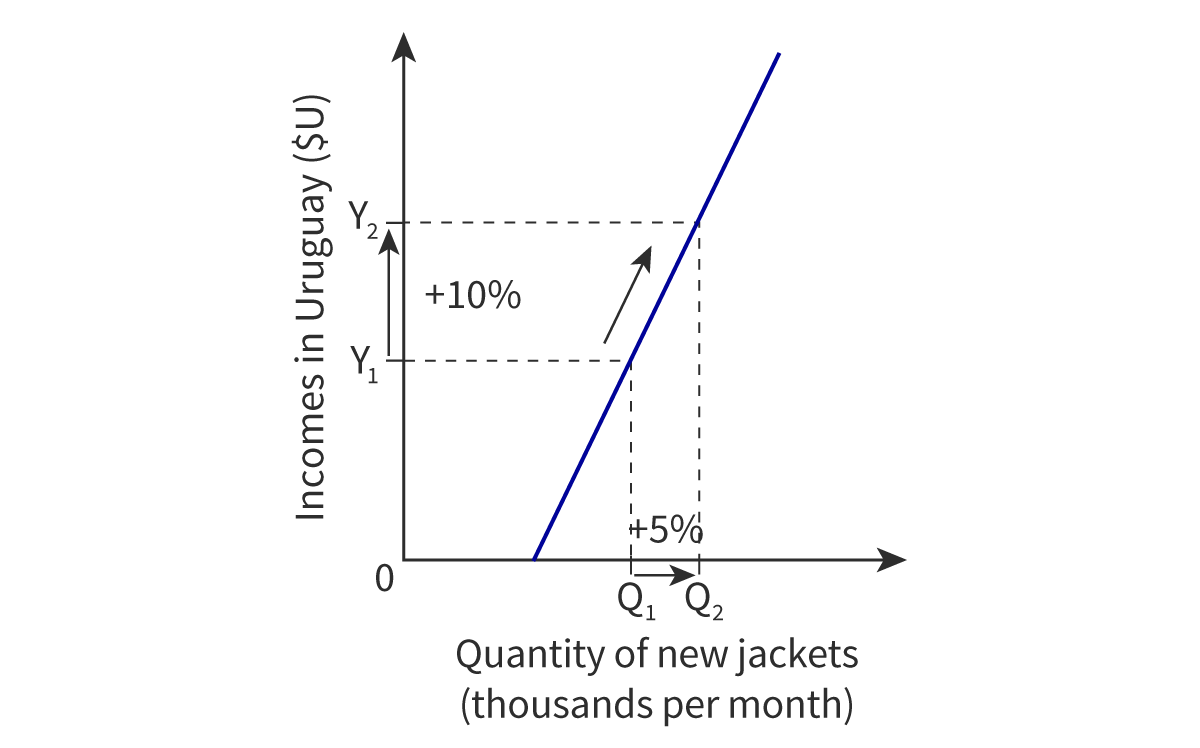
If YED < 1, (%ΔQ > %ΔY) YED is said to be income inelastic and the good of which YED is calculated is a necessity good because an increase in income won’t change the demand for these goods that much, consumers will need them anyway. Examples of necessity goods include food and medicine.
Price elasticity of supply (PES)
The price elasticity of supply is used to measure the effect a change in price has on the supply for a certain good. It can be calculated as follows:
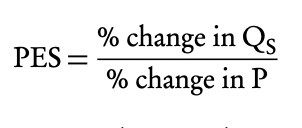
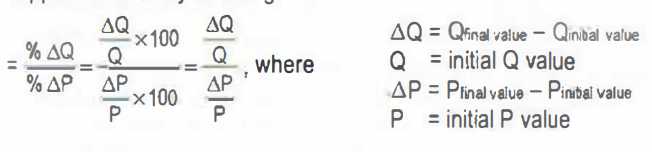
The outcome of PES is typically positive (because there is a positive relationship between price and quantity demanded).
If price increases by a certain percentage, quantity supplied will increase by PES × that percentage. (If for example PES = 2 and price increased by 10%, supply would increase by 20%).
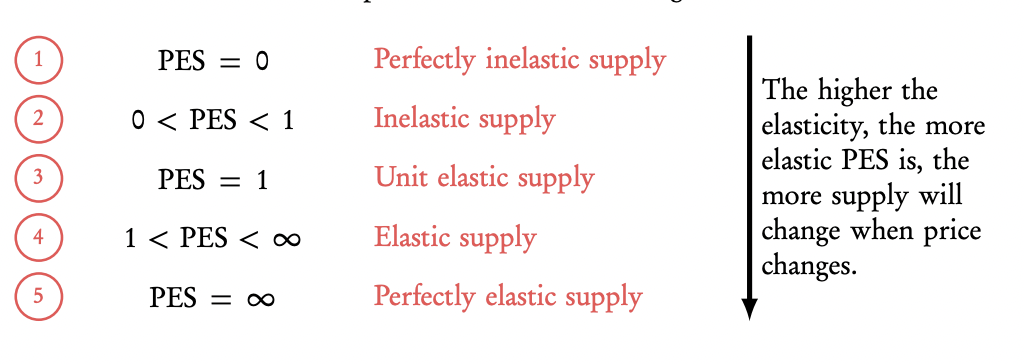
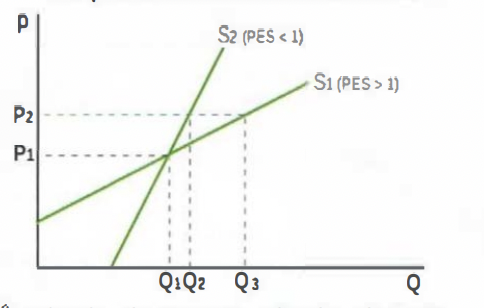
Price Elastic Supply (PES > 1): (%ΔQ > %ΔP) The percentage change in quantity supplied is greater than the percentage change in price — supply is very responsive to price changes.
Price Inelastic Supply (0 < PES < 1): (%ΔQ < %ΔP) The percentage change in quantity supplied is smaller than the percentage change in price — supply is less responsive to price changes.
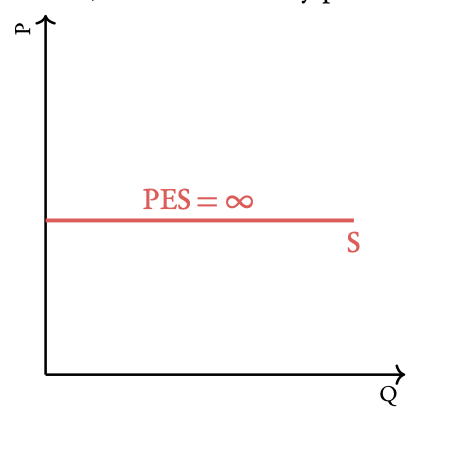
Perfectly elastic supply: On a completely horizontal supply curve, PES = ∞ at every point. The percentage change in Q supplied resulting from a change in P is infinitely large.
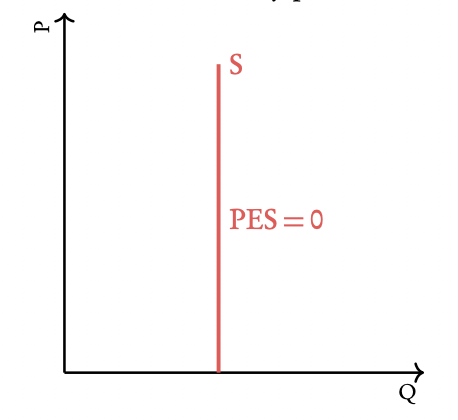
Perfectly inelastic supply: On a completely vertical supply curve, PES = 0 at every point. The percentage change in Q supplied is zero no matter how high P rises, Q supplied does not respond.
Unit elastic supply: PES = 1. the percentage change in Q supplied is equal to the percentage change in P.
Determinants of PES
Time: The time period over which PES is measured: PES will be higher when it is measured in the long run since companies will have more time to adjust production to price levels. In the short run producers often can’t change supply by that much.
Mobility of factors of production: The more quickly and easily necessary resources can be moved from one type of production to another where they are needed, the more elastic the supply.
Unused capacity: If firms have machines, equipment, or labor that are not being fully used, then it is easier to expand production in the event that price increases, simply by making use of the idle resources, and therefore the more elastic the supply
Ability to store: If a firm can store stocks easily and inexpensively, then in the event of a price increase it is more likely to have available stock that can be sold in the market, and the more elastic the supply.
Rate at which costs increase: the longer a producer has to respond to price changes the more elastic the supply. In a short period of time the producer may be unable to obtain all necessary resources and technology in order to increase output in response to price increase. as more time passes it becomes easier to do so.
Reasons for government intervention in markets
• Influencing market outcomes in order to:
earn government revenue
support firms
support households on low incomes
influence level of production
influence the level of consumption
correct market failure
promote equity.
Price control
price controls = government intervention in the market involving the setting of price ceilings (maximum prices) or price floors (minimum prices), thus preventing the market from reaching a market-clearing equilibrium price.
Price ceiling (maximum price)
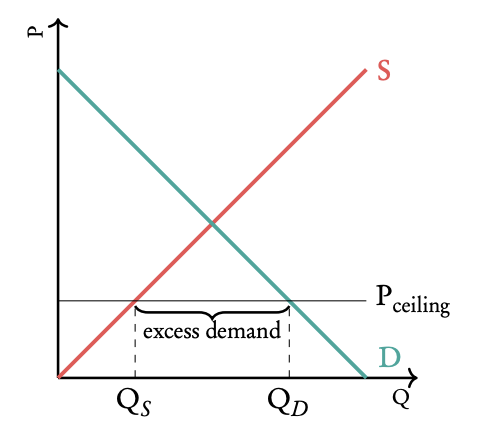
With a price ceiling the government sets a maximum price, which lies below the equilibrium price, beyond which producers are not allowed to raise the price. The government can do so to protect consumers against high prices (food price controls and rent controls). The demand will be greater than the supply. An excess demand will thus exist.
Possible consequences of a price ceiling for the market and the economy:
Shortage: production falls short of demand.
Underground parallel markets: due to the excess demand some consumers who want to buy the good cannot do so. They may go on the black market to still buy the good in question.
Welfare loss: the market won’t be at equilibrium, consumer and producer surplus are not maximised.
Inefficient resource allocation: the market won’t be at equilibrium, resources are not used most efficiently.
Non-price rationing: producers may start deciding who may buy and who may not buy. They may do so by queuing: consumers who are willing to wait the longest in a queue may buy the good.
Possible consequences of a price ceiling for stakeholders:
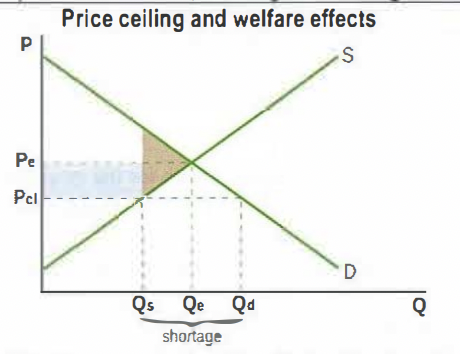
Consumers who buy the good at the lower P gain: those who want to buy it but cannot due to the shortage lose. . This can be seen from the welfare analysis, which shows the gain by consumers of a portion of producer surplus due to the lower P paid (the blue area), and the loss of a portion of consumer surplus due to welfare loss (the consumer surplus part of the brown shaded area).
Workers Some workers lose their jobs due to lower output produced.
Producers lose because they sell a lower Q and because they receive a lower P. This can be seen from the welfare analysis, showing the loss of the blue area of producer surplus to consumers, and the loss of a portion of producer surplus due to welfare loss.
Government There are no economic gains nor losses, but the government may gain politically from increased popularity.
P
Price floor (minimum price)
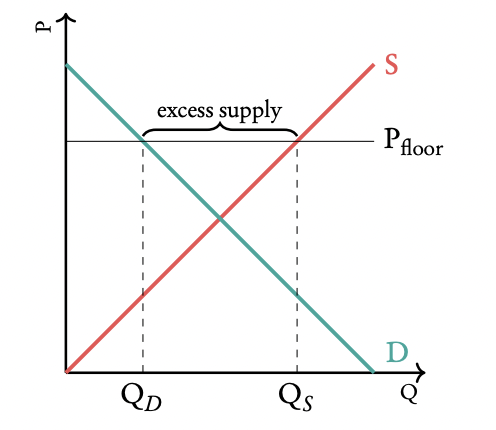
With a price floor, the government sets a minimum price which lies above the equilibrium price. Below, producers are not allowed to lower the price. The government can do so to protect producers against large fluctuations in prices (e.g. agricultural products) or to protect workers (e.g. setting a minimum wage). As you can see in the diagram, in the case of a price floor supply will be greater than demand. An excess supply will thus exist.
Possible consequences of setting a price floor for the economy:
Surpluses and government measures. There will be excess supply and the government often sets a minimum price while promising producers to buy the stock that they can’t sell on the market for the higher price.
Welfare loss. The market won’t be at equilibrium, consumer and producer surplus are not maximised.
Inefficient resource allocation. The market won’t be at equilibrium, resources are not used most efficiently.
Illegal workers Some workers may accept to work for wages below the legal minimum.
Misallocation of resources in the labor market The price of labor works as a signal and incentive in the labor market; the minimum wage may prevent the efficient allocation of labor resources.
Misallocation of resources in product markets Firms using unskilled labor have higher production costs due to the minimum wage; this may affect resource allocation in the product market.
Possible consequences of setting a price floor for stakeholders:
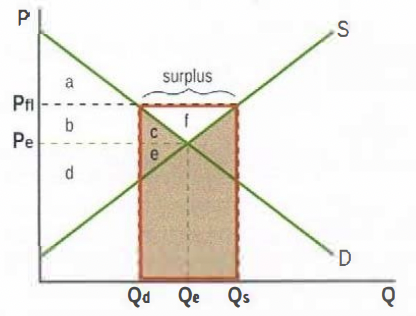
Consumers lose as they pay a higher price for a lower quantity purchased; this can also be seen by the welfare loss as shown by the brown shaded area. After the price floor is imposed, consumer surplus is reduced to area a (under the D curve up to Pf!), and producer surplus increases to include b+c+d+e+f (above the S curve up to Pf!). Social surplus appears to have increased, however from this total it is necessary to subtract government spending to buy the excess supply, equal to the red bold rectangle. The net welfare loss is the brown shaded area.
Producers gain because they receive a higher price and sell a larger quantity
Workers gain because more output is produced therefore there will be an increase in employment.
The government loses as it must pay for the purchase of the surplus out of its budget, and may additionally have to pay storage costs or subsidies on exports of the surplus quantity.
Stakeholders in other countries lose if the excess supply is exported, leading to increased global supply and hence lower global prices, hurting farmers in countries where there are no price floors
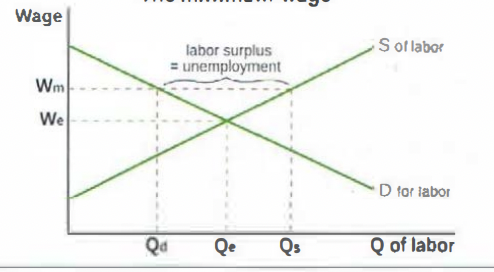
Workers Those who receive the minimum wage benefit, however those who become unemployed due to the minimum wage lose.
Firms Firms hiring unskilled labor and paying the minimum wage may be worse off due to higher costs of production.
Consumers Higher costs of production of firms that pay the minimum wage mean a leftward shift of the S curves of their products, resulting in a higher P and lower Q produced, therefore consumers are worse off.
Indirect taxes
indirect taxes (= excise taxes) = taxes on spending to buy particular goods and services, paid indirectly to the government by the seller. Indirect taxes are taxes imposed on certain goods to discourage the consumption of goods that can create externalities (demerit goods).
Why governments impose indirect taxes
Indirect taxes provide governments with revenues needed to finance various government expenditures
Indirect taxes on goods that are harmful (ex cigarettes) can be used to decrease consumption of those goods.
Indirect taxes can be used to improve the allocation of resources when there are negative externalities
Indirect taxes can be used to reduce the quantity of imports into a country
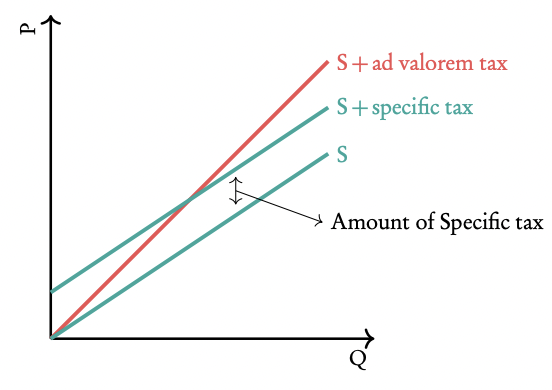
Specific taxes: the same amount of tax per unit sold (S+specific tax in the graph).
Ad valorem taxes: a percentage of the price of the good is taxed (S+ad valorem tax in the graph).
The tax makes the supply curve of the good shift upwards, because the good will now be sold at a higher price.
There is also a difference in the price consumers pay (Pc which is the price the producers set + the tax) and the price the suppliers receive (Ps which is only the price they have set, and not the tax, because they have to give away the tax money to the government).
Market outcomes:
new equilibrium Q is lower at Q2
new equilibrium P, which is the P paid by the consumer. is higher at Pc
new P received by the producer is lower at Pp
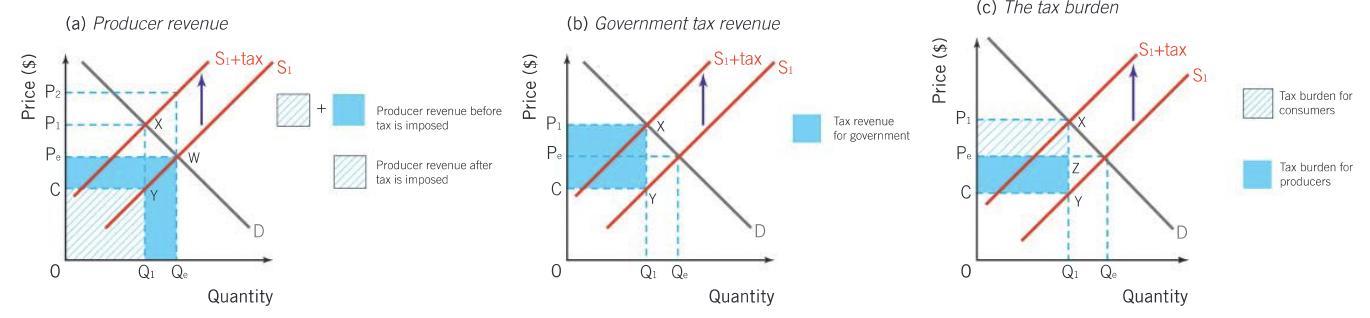
Effects on stakeholders:
consumers lose: they pay a higher P and buy a lower Q
producers lose: they receive a lower P and sell a lower Q (their revenues fall from P1 x Q1 to Pp x Q2)
workers lose: less is produced, therefore some lose their jobs
the government gains tax revenue = yellow shaded area = tax per unit x Q2 (the new quantity produced and sold)
society loses: there is resource misallocation (underallocation and underproduction since Q2 < Q1) and welfare loss = brown triangle
Subsidies
A subsidy is an amount of money paid by the government to a firm per unit of output. Possible goals of the government for setting the subsidy may include:
To lower the price of essential goods: producers of essential goods can lower the price when receiving a subsidy.
Guarantee the supply of certain goods: more producers will want to produce certain goods if they can get a subsidy in order to do so.
Enable producers to compete with foreign competitors: domestic companies stand stronger on the international market if they get money in the form of subsidies from their government.
Subsidies can increase firms' revenues (e.g., subsidies on agricultural products to support farmers).
Subsidies can support specific firms or industries (e.g., those producing or using green technologies).
Subsidies can encourage consumption of goods considered beneficial for society (e.g., education).
Subsidies can improve resource allocation when there are positive externalities.
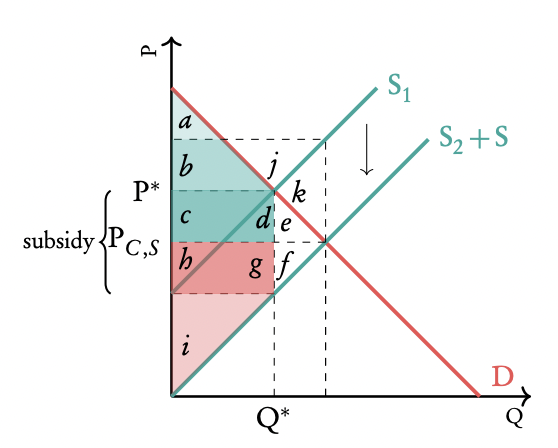
The subsidy will shift the supply curve downwards / to the right because producers will now produce more at a lower price for every quantity
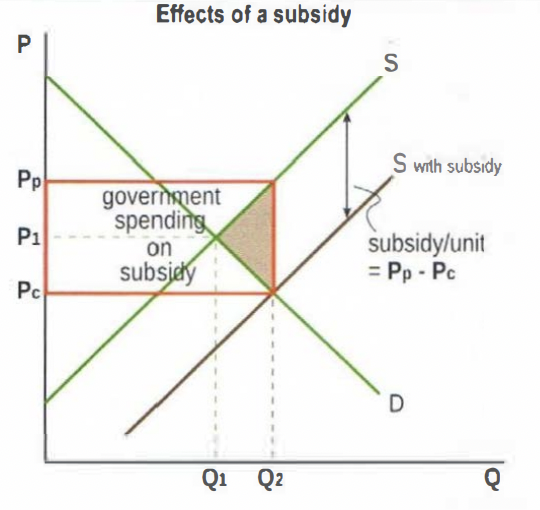
Market Outcomes:
New equilibrium quantity increases to Q2
New price paid by consumers falls to Pc
New price received by producers rises to Pp
Effects on Stakeholders:
Consumers gain: lower price, higher quantity purchased
Producers gain: higher price received, higher quantity sold → increased revenue
Workers gain: increased production creates more jobs
Government loses: must pay the subsidy (red rectangle) (subsidy per unit × Q2), worsening budget
Society loses:
Inefficiency from protecting high-cost producers
Opportunity cost of government spending
Resource misallocation and overproduction (Q2 > Q1), causing welfare loss (brown triangle)
Market failure
market failure = the failure of the market to allocate resources efficiently, resulting in overallocation, underallocation or no allocation of resources to the production of a good or service relative to what is socially most desirable
externalities
An externality occurs when production or consumption of a good has an effect on a third party for which the latter does not pay or does not get compensated. This effect can be positive (benefit) in which case we speak of positive externalities. Examples include getting educated. The third party that would benefit in this case would be the society in general. Or this effect can be negative (cost) in which case we speak of negative externalities.
Marginal private costs (MPC) costs of production that are taken into account in a firm’s decision making process. the additional costs to producers arising from production of an additional unit of a good. The MPC curve is equal to the supply curve.
Marginal private benefits (MPB) is the additional benefit for the consumers from the consumption of an additional unit of a good. The MPB curve is equal to the demand curve.
Marginal social cost (MSC) is the additional cost of production to society arising from production of an additional unit of a good.
Marginal social benefit (MSB) benefit of consumption of an additional unit to society.
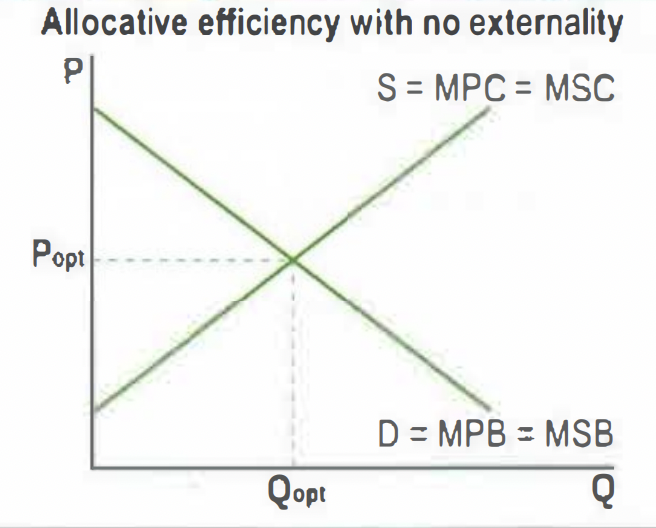
With no externality
D = MPB = MSB and S = MPC = MSC
MSB = MSC indicating there is allocative efficiency, social/community surplus maximized
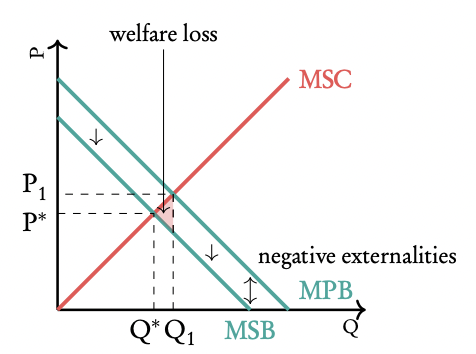
Negative externality of production
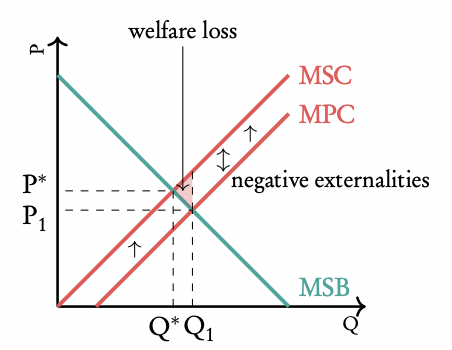
In this case MSC > MPC, the MSC curve lies above the MPC curve. This can be caused by polluting production. As you can see the negative externality leads to a welfare loss (the shaded triangle). The government can end this by taxing the companies and thereby increasing their MPC shifting the MPC curve upwards.
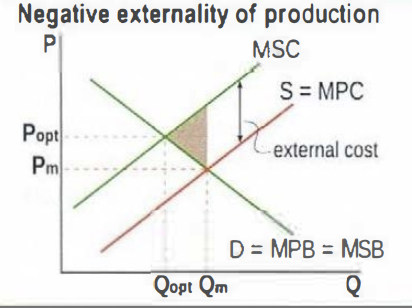
Vertical difference between MSC and MPC curves = value of external costs.
Demand is not affected therefore D = MPB = MSB.
Qm > Qopt: the market overallocates resources: too much is produced.
Welfare loss (deadweight loss) is the brown shaded triangle.
Example: production of goods by use of fossil fuels leading to carbon emissions, hence there are external costs including pollution of clean air, rivers, lakes, etc, and negative effects on human health.
Negative externality of consumption
In this case MSB < MPB, the MPB curve lies above the MSB curve. This can be caused by consumption of demerit goods (goods of which the consumption has negative consequences on society) such as gasoline. As you can see the negative externality leads to a welfare loss (the shaded triangle). The government can end this by imposing a tax on the consumption of this good, causing MPB to decrease so that the MPB curve shifts downwards.
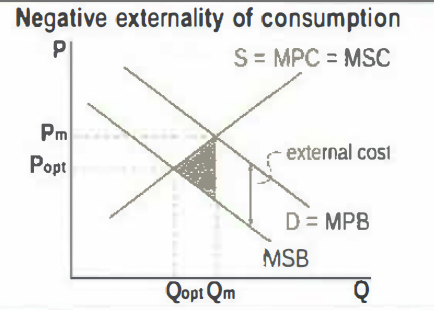
Vertical difference between MPB and MSB curves = value of external costs.
Supply is not affected therefore S = MPG = MSC.
Qm > Qopt: the market overallocates resources: too much is produced.
Welfare loss (deadweight loss) is the brown shaded triangle.
Examples: smoking (cigarette consumption), where external costs include negative health effects on non-smokers and increased health care costs; use of cars using gasoline (a fossil fuel), where external costs include pollution of clean air.
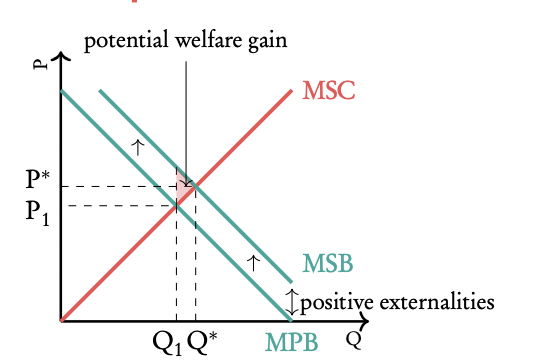
Positive externality of production
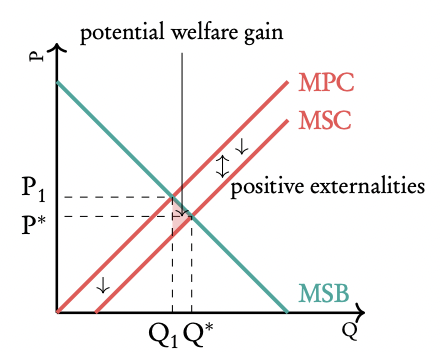
In this case MSC < MPC, the MSC curve lies below the MPC curve. This can be caused by green production. As you can see the positive externality leads to a potential welfare gain (the shaded triangle). The company produces at Q1 and P1 , while max welfare could be achieved at Q∗ , P∗ . The government could achieve this by subsidising the companies, shifting their MPC curve downwards.
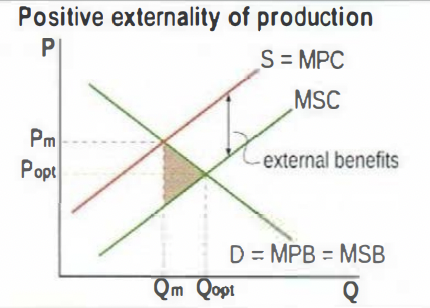
Vertical difference between MPG and MSC curves = value of external benefits.
Demand is not affected therefore D = MPB = MSB.
Qm < Qopt: the market underallocates resources: too little is produced.
Welfare loss (deadweight loss) is the brown shaded triangle.
Examples: research by private firms leads to development of new technologies that benefit the whole of society (termed "technology spillovers"); training for workers provided by a firm which benefit other firms once the worker changes job.
Positive externality of consumption
In this case MSB > MPB, the MSB curve lies above the MPB curve. This can be caused by consumption of merit goods (goods of which the consumption has positive consequences on society) such as education. As you can see the positive externality leads to a potential welfare gain (the shaded triangle). People consume at P1Q1 , while the optimum would be P∗Q∗ . The government could get there by subsidising the consumption of the good, shifting the MPB curve upwards.
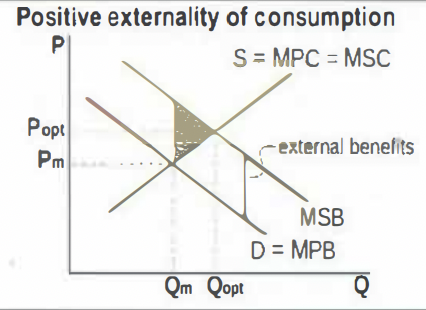
Vertical difference between MSB and MSC curves = value of external benefits.
Supply is not affected therefore S= MPC = MSC.
Qm < Qopt: the market underallocates resources: too little is produced.
Welfare loss (deadweight loss) is the brown shaded triangle.
Examples: consumption of education leads to benefits for society including lower unemployment, increased productivity, lower crime rates, higher economic growth; similar external benefits arise from consumption of health care.
Merit/demerit goods
merit goods = goods whose consumption creates positive consumption externalities; are socially desirable but underprovided by the market and underconsumed; require government policies to increase their provision (production) and consumption. Ex education, health care, infrastructure roads, sanitation, sewerage systems).
demerit goods = goods whose consumption creates negative consumption externalities; are socially undesirable but are overprovided by the market and overconsumed; require government policies to reduce their provision (production) and consumption. Ex cigarettes, gasoline as fuel for cars).
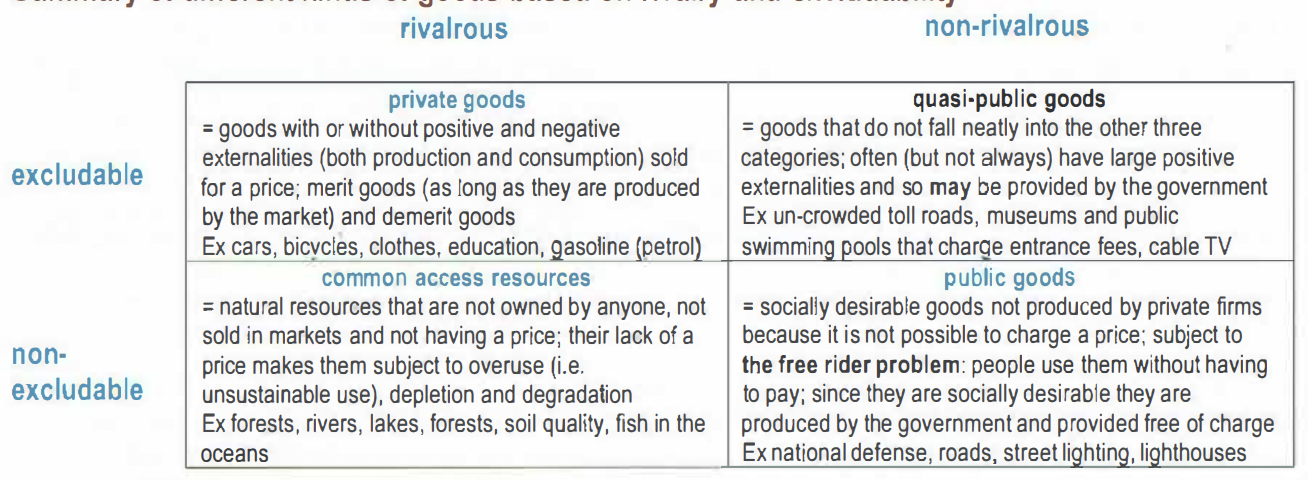
Common pool resources
common access resources = natural resources without ownership, that are not traded in a market, have no price, and can therefore be used freely by anyone; they are non-excludable (people cannot be excluded from using them because it is not possible to charge a price for their use) yet rivalrous (their use by one person makes them less available for use by someone else). Ex forests, rivers, lakes, the oceans, soil quality, biodiversity and even the ozone layer
Common access resources are resources that everyone has access to so it is very hard to exclude people from using them (e.g. fishing grounds, fossil fuel reserves).
The lack of a pricing mechanism on these resources may cause overuse or depletion. This poses a threat to sustainability. The unique nature of common access resources, namely their non-excludability, arising from being freely available for use by anyone without a price, together with their rivalry so that their use by one reduces availability for others, poses a serious threat to sustainability. The threat arises because since these resources can be freely used, they may be overused, depleted (= reduced in quantity) and degraded (= reduced in quality).
For example, poverty in developing nations often leads to overexploitation of agricultural land or the consumption of fossils fuels
The use of fossil fuels in production (an energy input for industry and agriculture) and consumption (an energy input for the use of cars and heating systems) creates negative externalities of enormous proportions. These externalities can be seen as resulting from overuse, depletion and degradation of common access resources (clean air, oceans, rivers, sea life), giving rise to external costs that include climate change, depletion of the ozone layer, acid rain, and a vast amount of health problems and related health care costs.
In economically less developed countries, poverty often leads people to use open access resources unsustainably as they make an effort to survive on extremely low incomes. High population growth exerts additional pressures on unsustainable resource use. Examples include deforestation (cutting down forests) to clear land for agriculture or to obtain firewood; soil degradation (depletion of the soil's nutrients) as farmers cannot afford inputs to maintain soil fertility and as they move to new pasture lands for their animals; soil erosion as people move to fragile lands on mountains.
Government intervention in response to externalities and common pool resources including:
Indirect (Pigouvian) taxes
A Pigouvian tax is a tax placed on a product with harmful side effects, so as to increase its price and reduce the quantity demanded or the supply. The aim of this tax is to make the individual or firm causing the externality to pay for it.
Specific Tax on a Negative Externality of Production: Governments frequently tax firms that pollute or create external costs in production
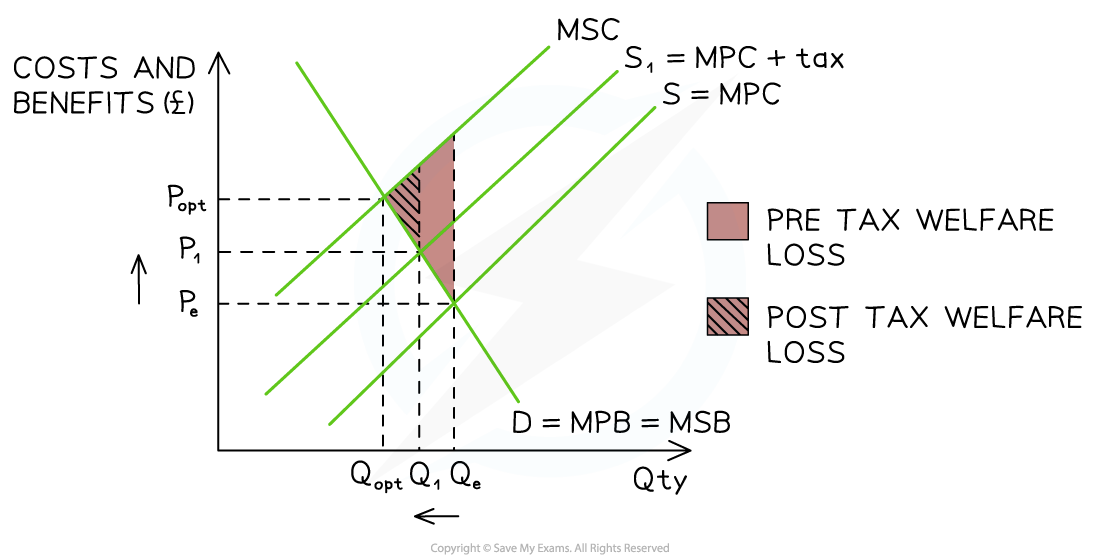
The free-market equilibrium is at PeQe (MSB = MPC), but market failure occurs as MSC > MSB, leading to over-provision (Qe − Qopt). A specific tax shifts supply left (S → S1), raising production costs and moving the market toward the socially optimal output (Qopt). The new equilibrium (P1Q1) reflects a higher price and lower quantity, reducing over-provision, external costs, and welfare loss.
Specific Tax on a Negative Externality of Consumption: Governments frequently tax demerit goods such as cigarettes, alcohol, fatty foods, and polluting vehicles
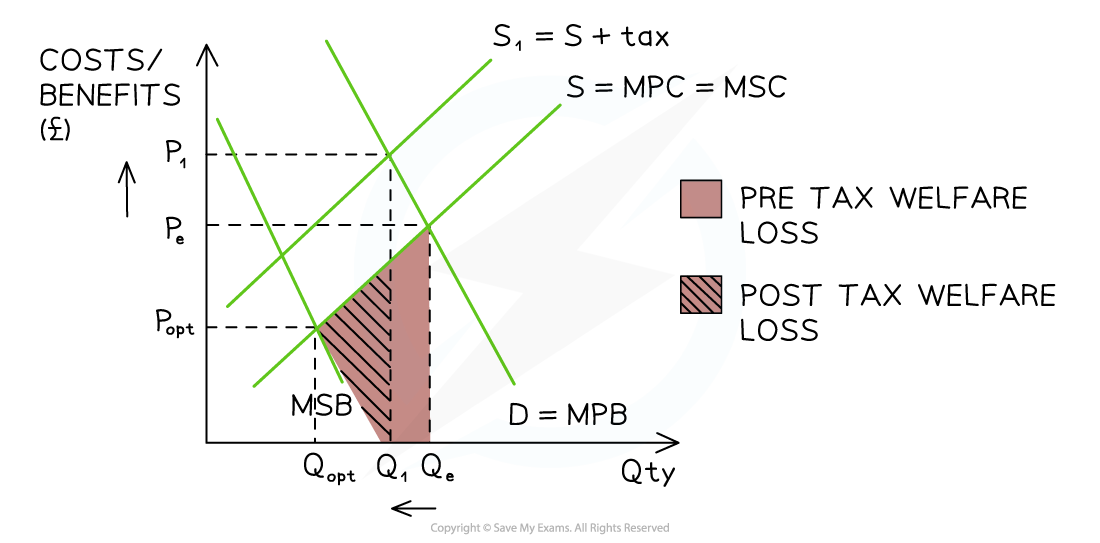
At the free-market equilibrium PeQe (MPB = MSC), market failure arises as MSC > MSB, causing over-consumption (Qe − Qopt). A specific tax shifts supply left (S → S1), raising costs and reducing consumption toward the socially optimal level (Qopt). The new equilibrium (P1Q1) shows higher prices and lower output, reducing over-consumption, external costs, and welfare loss.
Advantages | Disadvantages |
• Those causing the external costs pay for them - this is fair • The taxes raise the price & reduce the quantity demanded of demerit goods creating a more efficient allocation of resources • They reduce the external costs of consumption & production • Raises revenue for government programs | • The effectiveness of the tax in reducing the use of demerit goods depends on the price elasticity of demand (PED) ◦ Many consumers who purchase products that are price inelastic in demand will continue to do so • It may help create illegal markets as consumers seek to avoid paying the taxes • Producers may be forced to lay off some workers as output falls due to the higher prices |
Carbon taxes
A tax that producers who emit greenhouse gases have to pay. It sets a price on the carbon content forcing producers to pay for each ton of emissions. This raises their costs of production and should reduce supply. Useful to address market failure in markets where there's high a carbon footprint
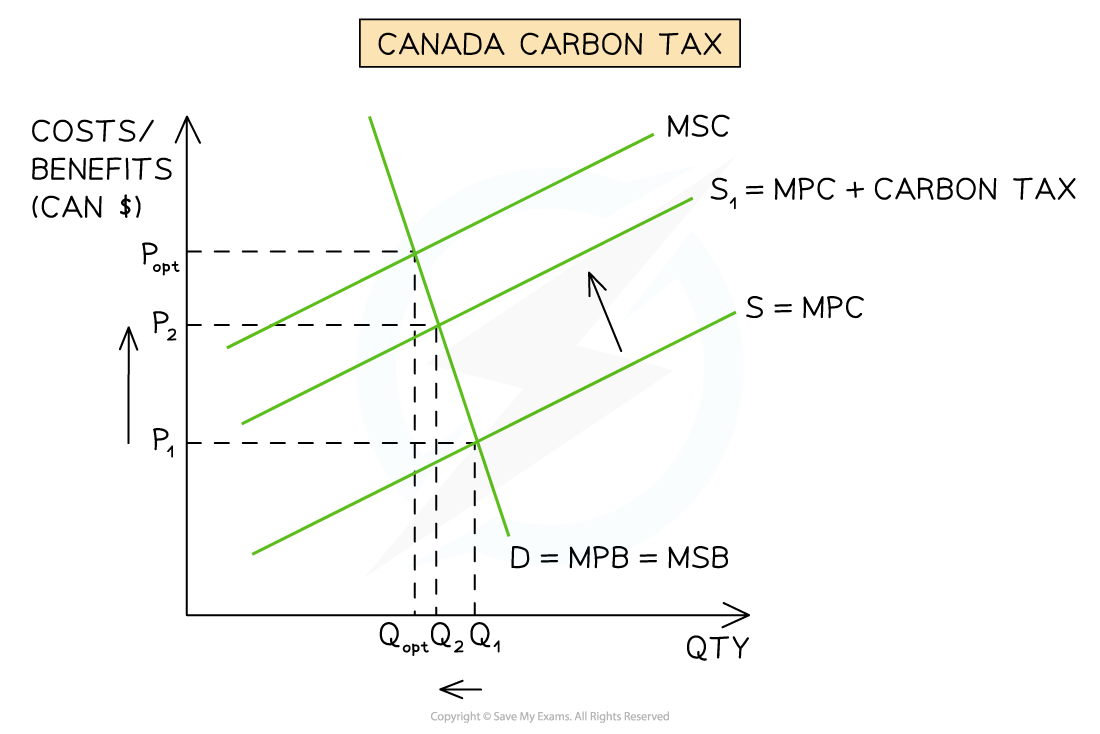
At free-market equilibrium P1Q1 (MSB = MPC), market failure occurs as MSC > MSB, leading to over-provision (Q1 − Qopt). A carbon tax increases production costs, shifting supply left (S → S1) and reducing output toward Qopt. The new equilibrium (P2Q2) shows higher prices and lower output, reducing over-provision, external costs, and welfare loss
Advantages | Disadvantages |
• Raises the costs of production for carbon emitting firms and reduces the supply of goods produced in a way that is harmful to the environment • Reduces external costs of fossil fuel production • This tax will encourage firms to consider investing in pollution abatement technology: if the cost of new technology is lower than the price of the tax then the investment is likely to go ahead • Raises revenue for government programs | • The effectiveness of the tax in reducing the supply depends on the price elasticity of demand (PED) for goods produced using fossil fuels (e.g. electricity) • If the good is inelastic in demand, consumers will continue to purchase it at high prices and the reduction in quantity supplied will be relatively small ◦ This can be seen on the diagram above where a large increase in price from P1 → P2 resulted in a small decrease in quantity supplied from Q1 → P2 • Some firms may be unable to pay the increased tax and may go out of business • Producers may be forced to lay off some workers as output falls due to the higher prices |
Producer subsidies
The government gives firms a fixed amount of money per unit produced in order to lower production costs and/or increase output of the product. Useful to address market failure where goods are under-provided or consumed
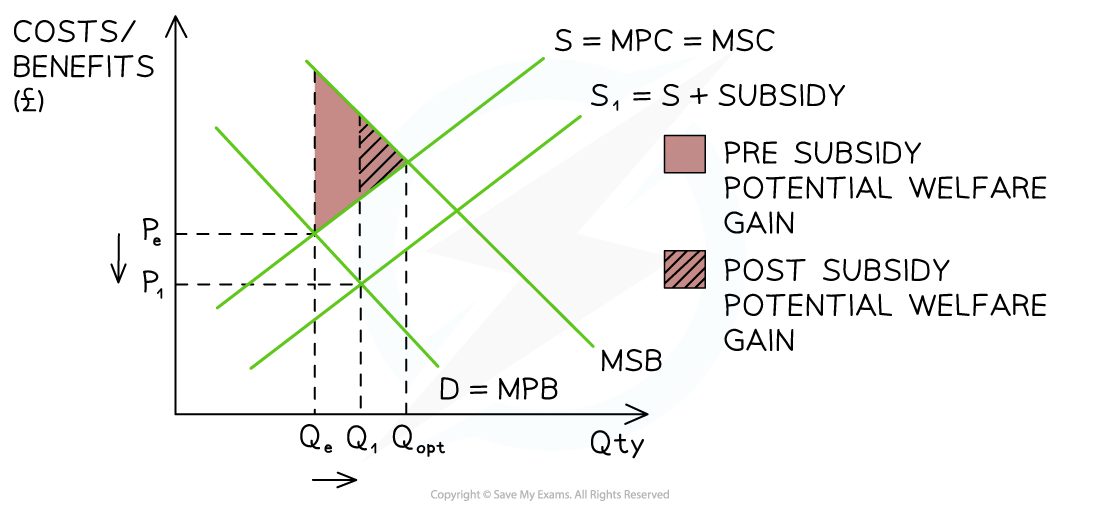
At free-market equilibrium PeQe (MPB = MSC), market failure exists as MSB > MSC, causing under-consumption (Qopt − Qe). A subsidy lowers production costs, shifting supply right (S → S1) and increasing output toward Qopt. The new equilibrium (P1Q1) has a lower price and higher output, reducing under-consumption, market failure, and capturing more external benefits.
Advantages | Disadvantages |
• Can be targeted so as to help specific domestic industries • Lowers prices and increases demand for merit goods • Helps to change destructive consumer behaviour over a longer period of time e.g. subsidising electric cars makes them affordable and helps motorists to see them as an option for the masses, not just the wealthy • Can be used to help domestic firms compete internationally | • Distorts the allocation of resources in markets e.g. it often results in excess supply when used in agricultural markets • There is an opportunity cost associated with the government expenditure - could the money have been better used elsewhere? • Subsidies are prone to political pressure and lobbying by powerful business interests e.g. most oil companies receive subsidies from their respective governments (despite making $billions in profits each year) • Subsidies can disincetivise firms from becoming more efficient or competitive. They provide extra funds which reduce the need to be more competitive |
Legislation and regulation
The government creates new laws (e.g. no single-use plastic bags) and then creates an agency (e.g. environment agency) to regulate those laws. Useful to address market failure where goods are over-provided or consumed
Legislation aimed at the consumer side: The legal age for drinking alcohol in the USA is 21 while it is only 18 in the UK. The UK Government could change the legal age of alcohol consumption in order to reduce demand and the external costs associated with excessive alcohol consumption
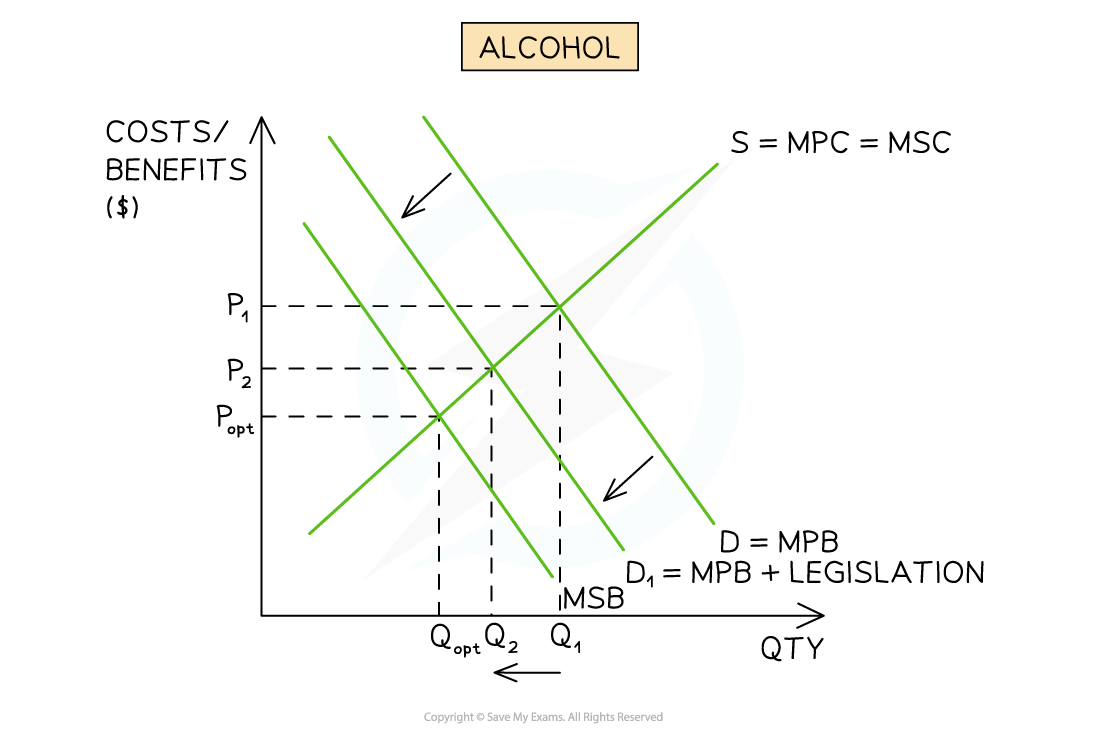
At free-market equilibrium P1Q1 (MPB = MSC), market failure exists as MSC > MSB, leading to over-consumption (Q1 − Qopt). Raising the legal drinking age shifts demand left (D → D1), reducing consumption. The new equilibrium (P2Q2) has a lower price and output, decreasing over-consumption and reducing market failure and external costs.
Legislation aimed at the producer side: Crayfish have been overfished off the coast of New Zealand (NZ). The NZ Minister of Fisheries (the regulator) is planning on closing certain crayfishing areas for a period of three years in order to allow the external costs (possible extinction in some areas) to be reduced
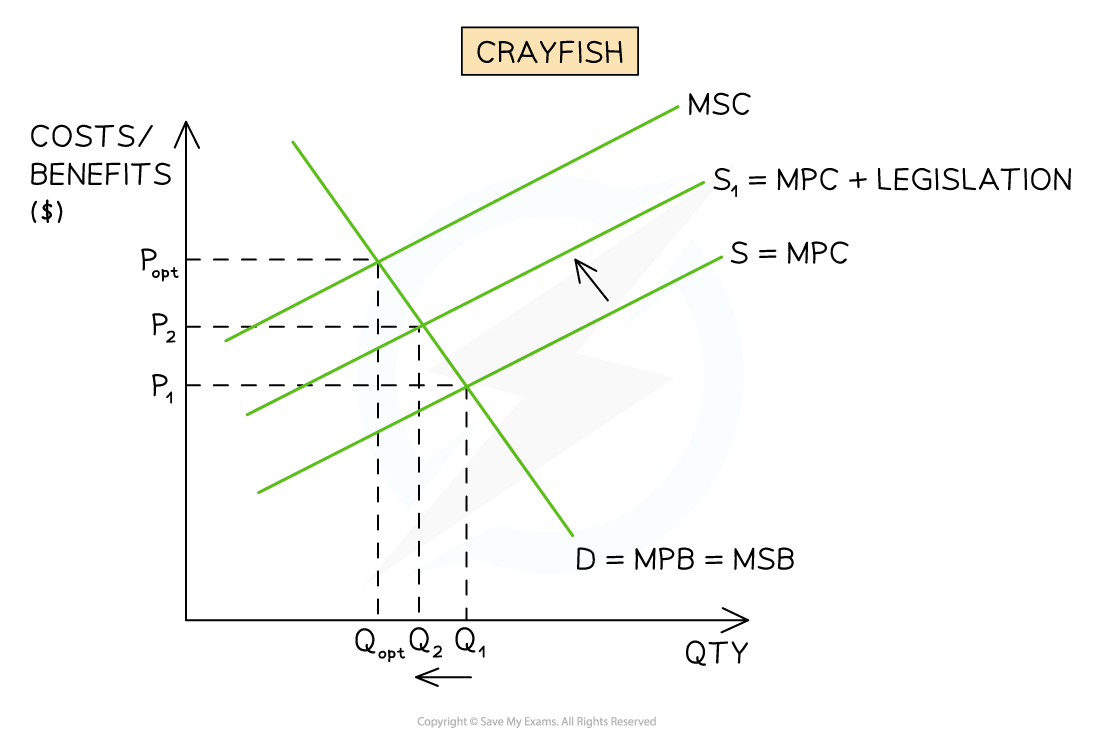
At free-market equilibrium P1Q1 (MSB = MPC), market failure exists as MSC > MSB, leading to over-supply (Q1 − Qopt). Legislation banning crayfish catches in certain areas shifts the supply curve left (S → S1). The new equilibrium (P2Q2) results in a higher price and lower output, reducing over-supply, market failure, and external costs.
Advantages | Disadvantages |
• The new laws can be targeted on specific markets • Individuals or firms may be fined/imprisoned for breaking the rules e.g. selling cigarettes to minors is a punishable offence • They help to reduce the external costs of demerit goods or harmful production activities • Fines can generate extra government revenue | • Enforcing laws requires the government to hire more people to work for the regulatory agencies • Enforcing laws can be difficult as it is a complex process to determine if firms/consumers are breaking the laws • The regulation may create underground (illegal) markets which could generate even higher external costs on society • Some of the laws may be unpopular with large corporations who wield political power • Some of the laws may be unpopular with voters to the point where it may influence their vote in the next election |
Education
The government funds advertising and education programs to educate the public on the dangers (or sometimes the benefits) of certain products e.g. anti smoking campaigns. Useful to address market failure caused by the existence of merit and demerit goods
Educating consumers on the benefits of merit goods: Educating consumers on the benefits of merit goods will increase consumption of goods with external benefits (e.g. electric cars, energy-efficient heating systems)
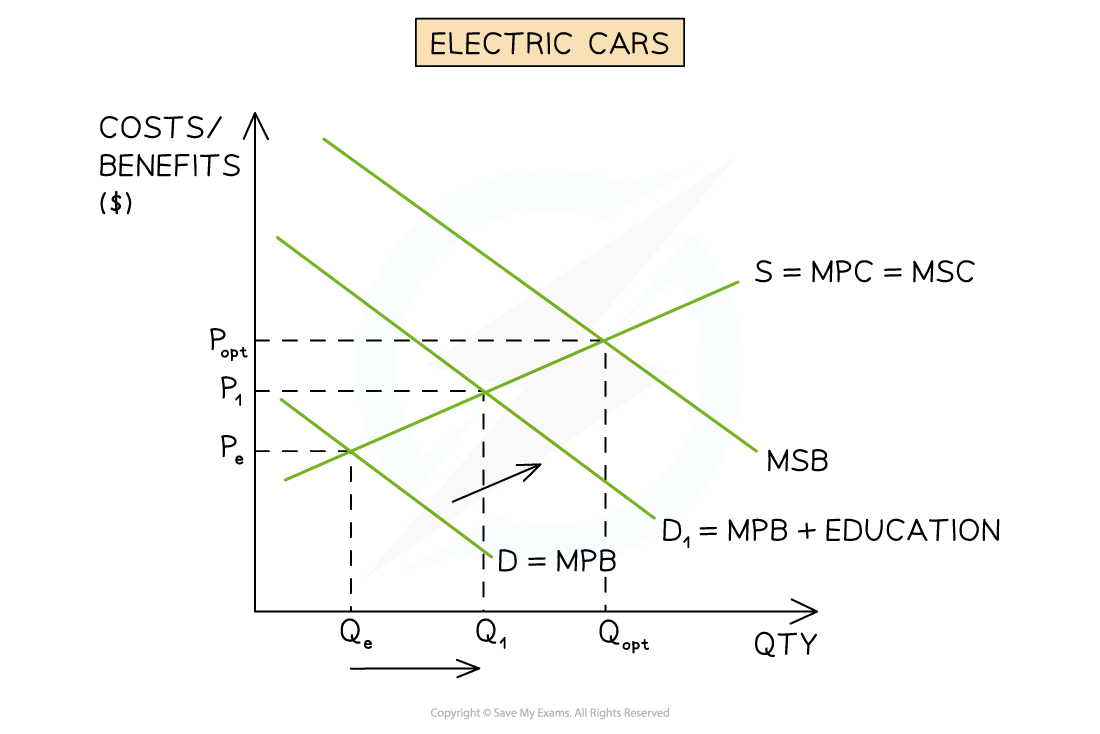
At free-market equilibrium PeQe (MPB = MSC), market failure exists as MSB > MSC, leading to under-consumption (Qe − Qopt). An education campaign promoting electric cars shifts the demand curve right (D → D1), increasing consumption. The new equilibrium (P1Q1) results in a higher price and output, reducing under-consumption, market failure, and recognizing external benefits, moving closer to the socially optimum level (Qopt).
Educating consumers on the benefits of demerit goods: Educating consumers on the dangers of consuming demerit goods will decrease the consumption of goods with external costs (e.g. cigarettes, alcohol, drugs, single-use plastics). Demerit goods are usually addictive but even small decreases in consumption are still worthwhile
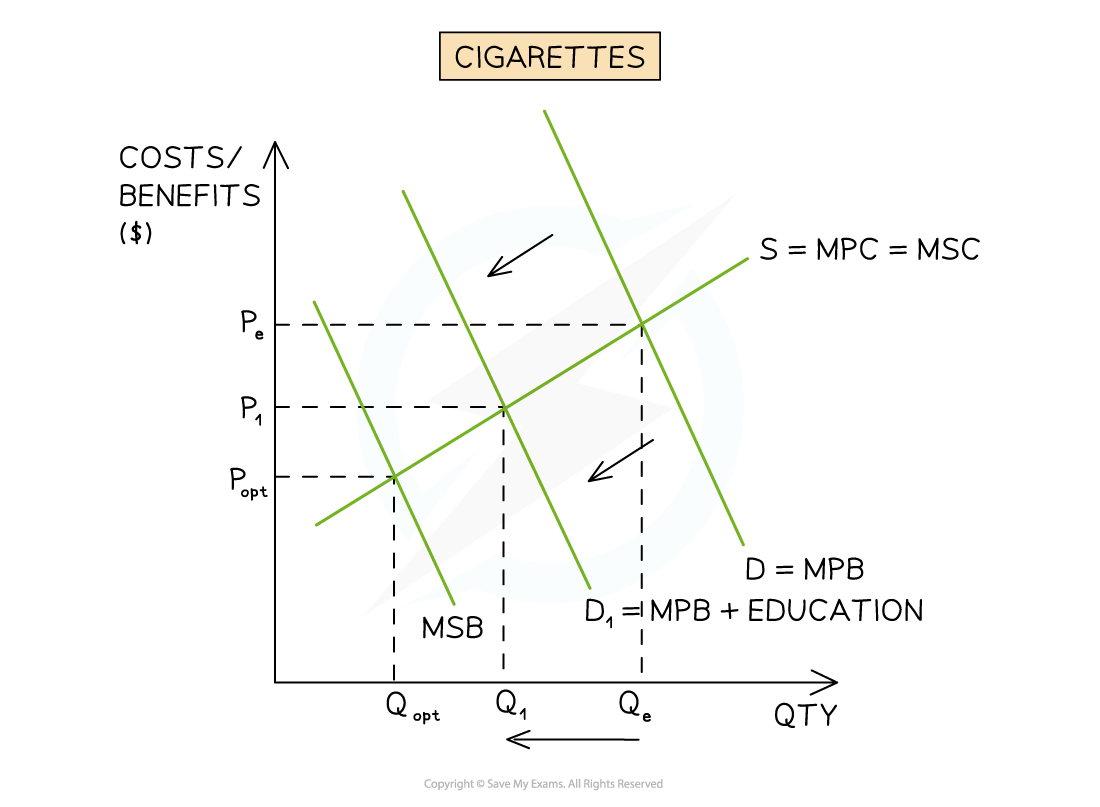
At free-market equilibrium PeQe (MPB = MSC), market failure exists as MSC > MSB, leading to over-consumption (Qe − Qopt). An education campaign on the external costs of smoking shifts the demand curve left (D → D1), reducing consumption. The new equilibrium (P1Q1) results in a lower price and output, reducing over-consumption, market failure, and recognizing external costs, moving closer to the socially optimum level (Qopt).
Advantages | Disadvantages |
• Changing the marginal private benefit associated with the consumption of a product is one of the most powerful ways to influence quantity demanded in the long term • The amount governments spend in raising awareness is usually far less than the savings they generate in the long term e.g. reduced State healthcare costs for cancer sufferers as a result of having fewer smokers • Education can create positive cultural changes e.g. an anti smoking culture or an anti single plastic use culture • Education can, over time, help improve the economic development within a country | • It takes a long time to change behaviour through education • There is an opportunity cost associated with the government spending on the education program • Demerit goods are often addictive and as a result, the change in behaviour takes longer • Merit goods are often more expensive than consumers would like and so the change in behaviour may take longer (combining education with a subsidy has proven very effective) |
Tradable permits
A mechanism which provides firms who emit greenhouse gases the option to buy a permit to pollute when it is required. This increases their costs of production and should reduce supply. If firms have permits that are no longer needed they are able to sell them to other firmsEvaluation Point
ExplanationChallenges involved in the measurement of externalities
Is extremely difficult to calculate the level of CO2 emissions in an economy and this level constantly changes
The initial number of permits is based on this calculation and should ideally be significantly less
If the calculation is too high then the permits will have no impact on emissions whatsoever
Degree of effectiveness
It still provides a permit to pollute
When the calculations are correct, it can be effective in decreasing emissions and reducing the welfare loss
Larger firms have the resources to buy all the permits while smaller firms struggle. Over time this can effectively create monopolies in polluting industries
If the demand for the end product is price inelastic in demand, then firms will pass on the cost of this permit to their consumers in the form of higher prices
Consequences for stakeholders
Increased costs of production for firms
Some firms may invest in new technology so that the permits are not required
Some firms may no longer be able to compete
Some firms may switch their production to countries with no pollution permit scheme
Higher prices for consumers
International agreements
These are useful for issues which are global in nature and require a globally coordinated response e.g. COP 27 agreements on climate change. Useful to address market failure where the tragedy of the commons is occurring and the global trade in demerit goodsAdvantages
DisadvantagesMany problems require a globally co-ordinated response and the reduction in welfare loss is greater when countries work together
Resources can be pooled and used for the greatest good
Levels of international cooperation and interdependence can increase
More economically developed countries (MEDCs) have developed using 'dirty technologies'. Less economically developed countries (LEDCs) are under pressure to accept agreements which reduce the use of 'dirty technology' and this may not be realistic as it would decrease their economic growth
There are usually no legal consequences to withdrawing from international agreements
When new political parties come to power they may seek to change agreements or withdraw from them e.g. President Trump withdrew USA support for the Paris Climate Change agreement
Collective self-governance
Occurs when communities come together to take control of common pool resources in an attempt to deal with the negative externalities associated with their useAdvantages
DisadvantagesWorking together can provide a common purpose and build a community
The community knows how to best manage scarce resources in a sustainable way and it is in their best interests to do so
Communities can create employment opportunities related to managing the scarce resources
A powerful strategy that has been beneficial to promoting eco (sustainable) tourism in many areas e.g. Borneo rain forests
The welfare loss is reduced
There can be disagreement about how to best manage the resources
Taking back control of common pool resources from multinational corporations or organised crime gangs can be highly confrontational/violent
This strategy works better when private property ownership rights are given to the communities for the natural resources around them
Government provision
Governments will often choose to directly provide certain goods/services (merit goods) in order to ensure that everyone in society has the same access. Useful to address market failure where goods are under-provided
Advantages |
|
|
|
But government responses are limited because:
The problems have a global nature. They can only be solved if all countries and governments act against them, otherwise companies will just move to countries where the laws are less strict.
There’s lack of ownership of the common access resources. Often no one feels responsible for solving the problem.
Effective responses require international cooperation, see above.
Need for international collaboration
Negative environmental externalities (both of production and consumption) extend far beyond national boundaries, and therefore require international collaboration for their solution. Ozone depletion and global climate change, for example, are global issues for which all countries, to a greater or lesser degree, are responsible. There cannot be a solution to such issues in the absence of effective international agreements. Ex the Kyoto Protocol.
Public Goods
Public goods (e.g. dams) have the following two characteristics:
public good = a good that is non-rivalrous (its use by one does not make it less available for use by others) and nonexcludable (it is not possible to charge a price and therefore exclude people from using the good). Ex national defense, the police force, lighthouses, knowledge, street lights
They are non-rivalrous: more people can use the good at the same time e.g. a dam protects more people at the same time.
They are non-excludable: people can’t be excluded from the use of the good e.g. in the case of a dam, people living in the protected area can’t be excluded from the protection by the dam.
In economics we also recognise private goods (e.g. tickets to a concert) which have the following characteristics:
private good = a good that is rivalrous (its use by one makes it less available for use by others) and excludable (people can be excluded, i.e. prevented from using it by charging a price). Private goods include any good that can be sold in a market for a price; ex cars, computers, houses, education, health care services, i.e. goods that are produced by private firms or by the government for which a price is charged
They are rivalrous: the good can’t be used by more people at the same time e.g. tickets to a concert can only be used by one person to enter.
They are excludable: people can be excluded from the use of the good e.g. someone checking for tickets could deny people entry.
Private firms will not supply public goods because few people will pay for it if they can use it anyway; this is called the free rider problem.
Governments can solve this by providing the public goods themselves paying for them using taxes.
free rider problem = occurs when people use a good without paying for it; it is closely related to nonexcludability. When it is not possible to exclude people from using a good (ex a lighthouse) by charging a price for it, they take a "free ride", i.e. they use it without having to pay for its use.
Public goods represent market failure because of the free rider problem. Since it is not possible to charge a price for the good, private firms will not produce it, even though it may be socially desirable and consumers may have a demand for it. Firms will not produce it because without a price it will be impossible for them to cover their costs. Public goods are therefore a type of market failure because the market (i.e. private firms) fail to produce it at all.
Government intervention in response to public goods
Direct provision of public goods by the government Since the market fails to allocate any resources to the production of public goods, and since public goods are socially desirable, they are directly provided by the government and financed (paid for) by government tax revenues. In view of the opportunity costs of government spending, and the many competing uses of government funds, governments face the difficulties of deciding what particular public goods to provide and in what quantities. Political pressures on the government may also come into play, resulting in choices made on political rather than (or in addition to) economic grounds.
Advantages of government provision
Disadvantages of government provision
Improves social welfare as consumption is increased.
Has to be financed, which generates an opportunity cost.
Eliminates the free-rider problem.
Government provision may not be economically efficient, as the government is unable to determine the optimal output.
Can be more efficiently provided because the government, as the sole provider, can achieve economies of scale.
Some quasi-public goods, like toll highways, could be provided more efficiently by private firms.
Contracting out to the private sector: The government can pay the private sector to provide goods, as it may be more efficient due to the profit motive driving firms to raise capital and improve efficiency. However, research from the European Public Service Union questions whether the private sector is truly more efficient. Private firms face higher borrowing costs and must deliver profits, while the government doesn't have these concerns.
They may provide the public good themselves. This is known as “direct provision”. This is usually the case with such things as national defence, flood barriers, roads, pavements, street lighting and lighthouses. The use of taxpayers’ money to fund the provision spreads the cost over a large number of people who would not be prepared to pay individually.
The government might work in partnership with the private sector, providing the financing for the establishment of the good, and then allowing the private producer to run it. This is known as “public-private partnership”. It may be assumed that private producers will only engage in such a partnership if there are profits to be earned. This makes the issue of such partnerships rather controversial.
Circular flow of income model
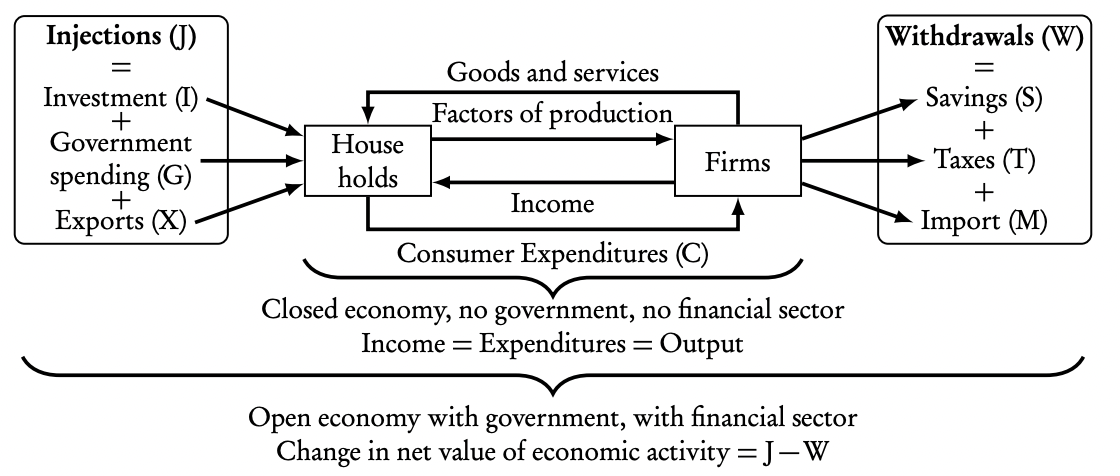
The middle part of the model is a closed economy (no international trade ⇒ no imports and exports) that has no government (no taxes, no government spending) and no financial sector (no investment, no savings).
In this economy, the income of consumers will always be the same as their expenditures because saving is impossible and there are no taxes.
In this economy, the earnings of companies will always be the same as consumer expenditure because consumers can’t spend their income on products from abroad (imports).
In this economy, all earnings of companies will be the same as the value of their domestic outputs because companies can’t invest parts of their earnings, nor can they export some of their output.
Therefore, in a closed economy without a government and financial sector: Income = Expenditures = Output
When we add international trade, a government and a financial sector, injections (value added to the circular flow: investment, government spending and exports) and withdrawals (value removed from the circular flow: savings, taxes, imports) are possible.
In such an economy the change in the value of economic activity can be measured as: J −W = (I +G + X) − (S + T + M)
The circular flow of income in an open economy (wirh foreign trade) with government and financial markets includes leakages and injections.
If the sum of injections > the sum of leakages → circular flow grows bigger, production of goods and services increases, income increases, the economy grows, unemployment decreases
If the sum of injections < the sum of leakages → circular flow shrinks, production of goods and services decreases, income decreases, the economy is in recession, unemployment increases
GDP
GDP — Gross Domestic Product total income earned by the factors of production in a country, regardless the assets owner.
[Nominal] Gross domestic product (GDP) as a measure of national output
The output method: This measures the actual value of the goods and services produced. This is calculated by summing all of the value added by all the firms in an economy. When we say value added it means that at each stage of a production process we deduct the costs of inputs. The data is usually grouped according to the different production sectors in the economy: agriculture and mining (primary sector), manufacturing (secondary sector) and services (tertiary sector).
The income method: This measures the value of all the incomes earned in the economy.
Expenditure approach:
GDP = C + I+ G + (X — M).
spending by households, known as consumption (C)
spending by firms, known as investment (I)
spending by governments (G)
spending by foreigners on exports minus spending on imports. This is known as net exports (X - M).
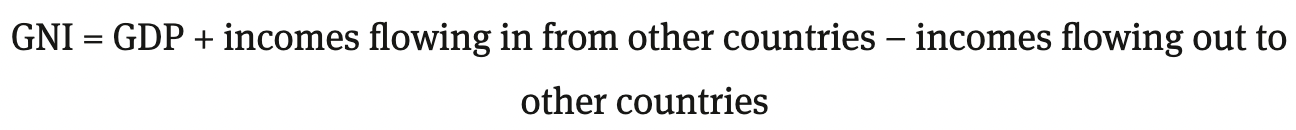
GNI
GNP/GNI — Gross National Product / Gross national income the total income earned by a country’s factors of production, regardless the assets location.
[Nominal] Gross national income (GNI) as a measure of national output

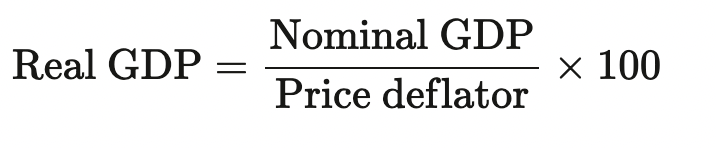
Real GDP and real GNI
Nominal GDP/GNI are measures of output and income in terms of current prices (prices prevailing at any given moment).
Real GDP/GNI are measures of output and income in terms of constant prices that prevail in one particular year; therefore real values eliminate the influence of price level changes over time. Real values must always be used to make comparisons over time, in order to get a more accurate picture of changes in output and income without the influence of price chancies.

Real GDP/GNI per person (per capita) at purchasing power parity (PPP)


Total GDP and GNI provide an indication of the size of an economy.
Per capita GDP provides an indication of the amount of output corresponding to each person in the population on average.
Per capita GNI provides an indication of how much income is received by each person in the population on average and is therefore a better indicator of standards of living.
Purchasing power parity refers to measuring the prices for goods and services in different locations. Assuming a world in which there are no barriers to trade and no transaction costs, we could assume that goods and services would be the same price in all locations. However, there exists a difference in how much a given income can purchase in different countries because some domestic sectors are not largely open to world trade, like the markets for labour, real estate, or health services: this is the purchasing power parity.
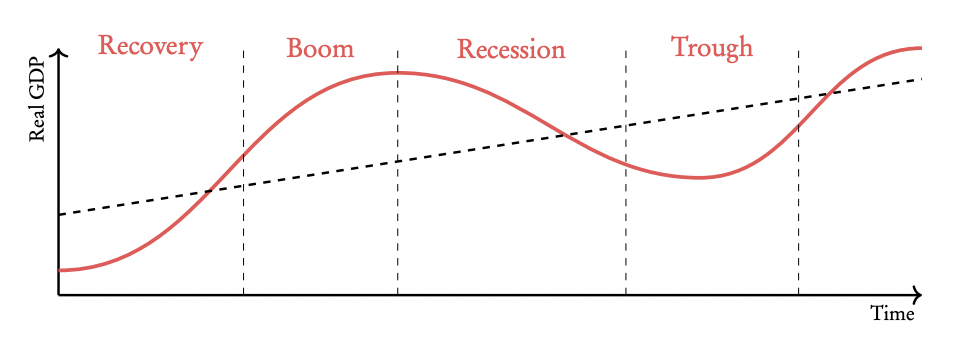
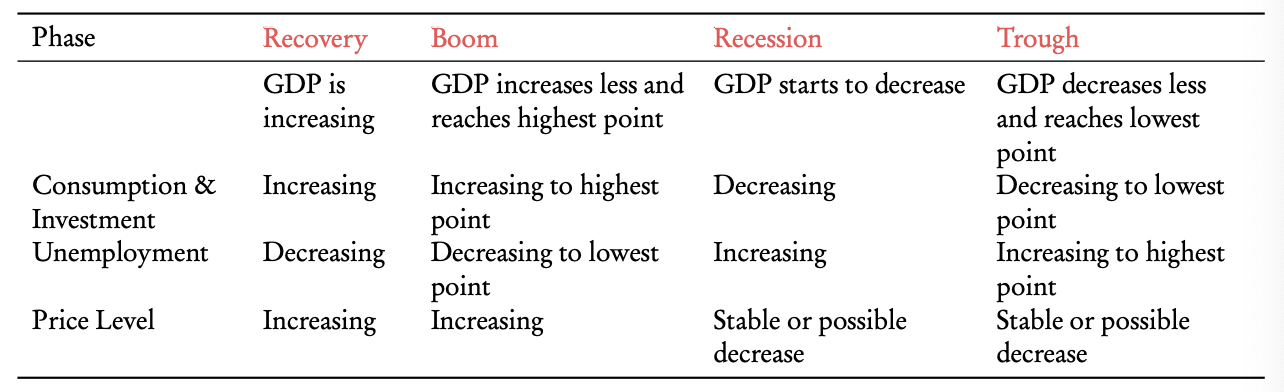
Business cycle
business cycle = short-term fluctuations (increases and decreases) in real GDP over time, consisting of four phases: Boom, Recession, trough, and Recovery.
The economy tends to go through a cyclical pattern of Real GDP development. The pattern is called the business cycle (Figure 2.2). The business cycle consists of different phases of real GDP growth and decline, but in the long run GDP increases, hence the increasing trend line drawn in the figure.
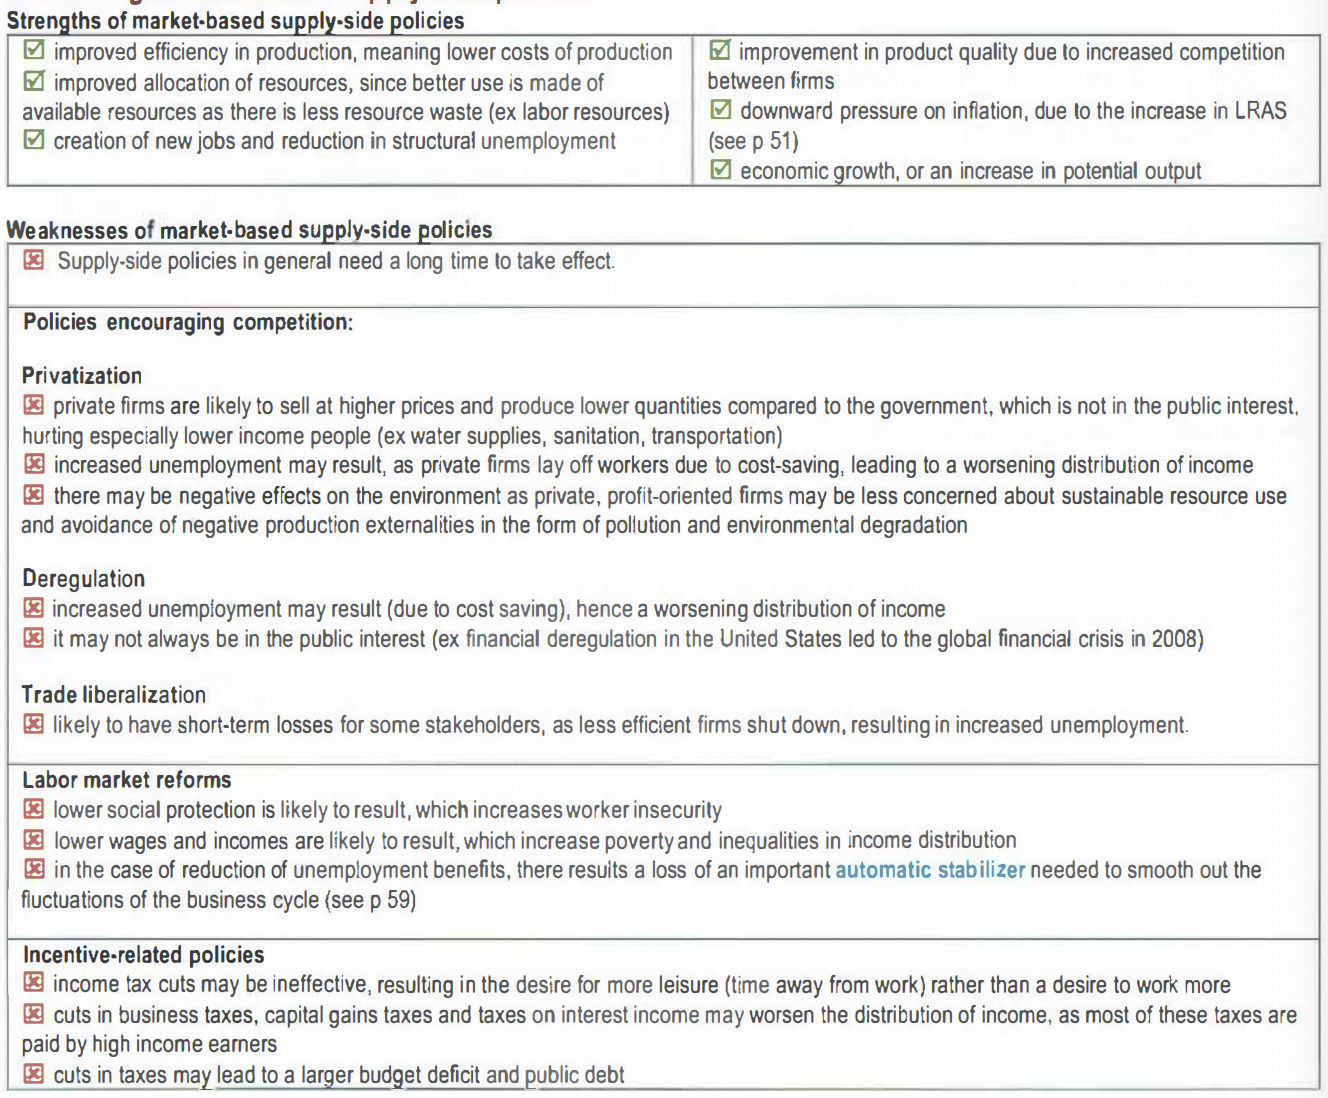
Demand-side policies (fiscal and monetary) aim primarily at reducing the short-term fluctuations of the business cycle. Contractionary policies try to weaken the expansion (inflation) and expansionary policies try to reduce the size of the contraction (cyclical unemployment).
Supply-side policies aim at increasing the slope (steepness) of the long-term growth trend, by increasing the rate of economic growth, and hence the level of potential output.
Appropriateness of using GDP or GNI statistics to measure economic well-being
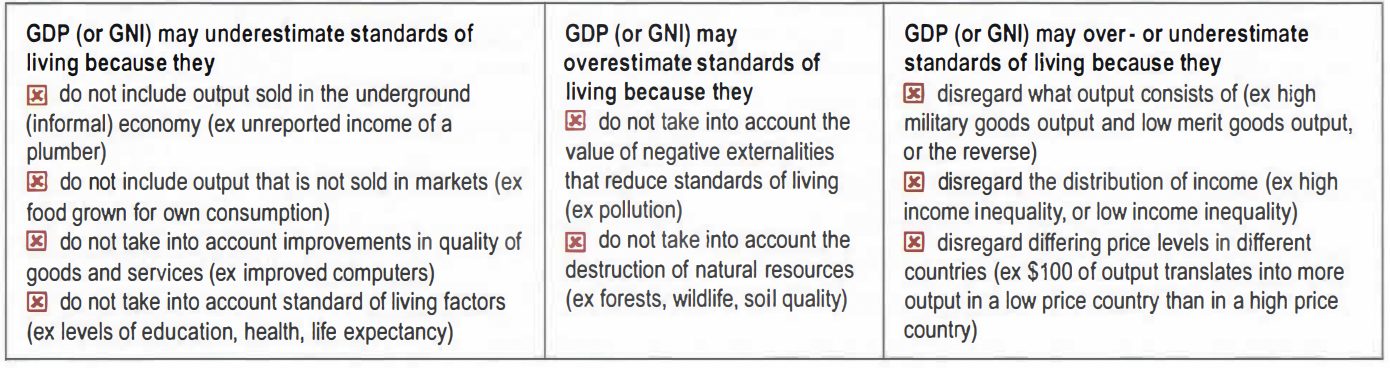
Inaccuracies: As noted above, the data that are used to calculate the various measures of national income come from a vastly wide range of sources, including tax claims by households and firms, output data and sales data. Figures tend to become more accurate after a lag time as they are revised when additional data are included. Statisticians in national statistics agencies make every effort to make their data as reliable as possible and in the more developed countries they can be assumed to be fairly reliable. The United Nations SNA works with all countries to improve the methods of gathering data. This improves the validity of comparisons. o
Unrecorded or under-recorded economic activity — informal markets:
External costs: GDP figures do not take into account the costs of resource depletion. Cutting down trees leads to an increase in GDP, but there is no measure to account for the loss of these trees. GDP figures do not make deductions for the negative consequences of air and water pollution and traffic congestion, as these are external costs. Such external costs are almost certain to compromise the quality of life, even as GDP increases.
Other quality of life concerns: GDP may grow because people are working longer hours or taking fewer holidays. While people may earn higher incomes as a result, they might not actually enjoy higher standards of living. GDP accounting does not include free activities such as volunteer work or people caring for the elderly and children at home. These are all activities that can lead to a better society, but might even be discouraged in the pursuit of economic growth.
Composition of output: It is possible that a large part of a country’s output is in goods that do not benefit consumers, such as defence goods or capital goods. If this is the case, then it would be hard to argue that a higher GDP will raise living standards.
Alternative measures of well-being
OECD Better Life Index: The BLI measures 11 indicators across 38 countries which are members of the Organisation for Economic Cooperation and Development, or OECD.
Happiness Index
Happy Planet Index: he Happy Planet Index (HPI) uses four indicators to demonstrate how efficiently residents of different countries are using environmental resources to lead long, happy lives.

Aggregate demand (AD)
Aggregate demand (AD) total demand for goods and services in an economy at a given time. AD =C +I +G + X − M
aggregate demand (AD) = the amount of real output (goods and services) that all buyers in an economy (consumers, firms, government and foreigners) are willing and able to buy at different possible price levels, in a year, ceteris paribus. The AD curve has a negative slope (s downward sloping), indicating a negative relationship between the price level and real output, or GDP (equal to real income). This is due to very different factors than micro demand D ; these factors are explained below.
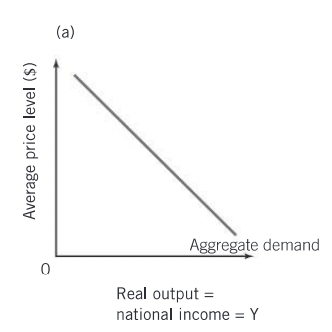
Determinants of AD components
C: consumer confidence, interest rates, wealth, income taxes, level of household indebtedness, expectations of future price level
I: interest rates, business confidence, technology, business taxes, level of corporate indebtedness
G: political and economic priorities
X - M: income of trading partners, exchange rates, trade policies
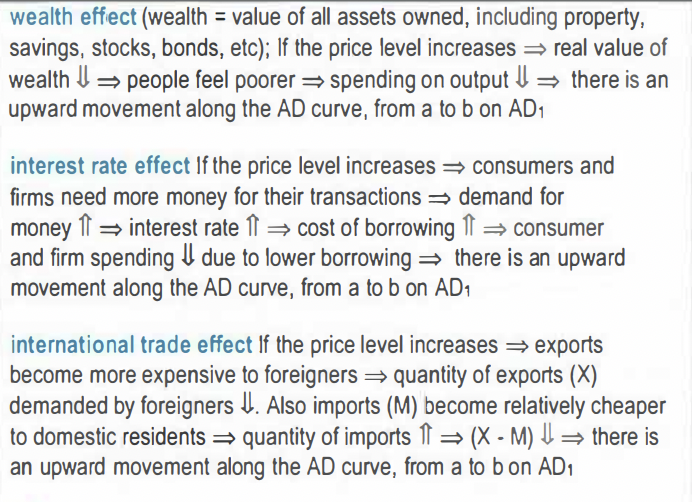
Shifts of the AD curve caused by changes in determinants
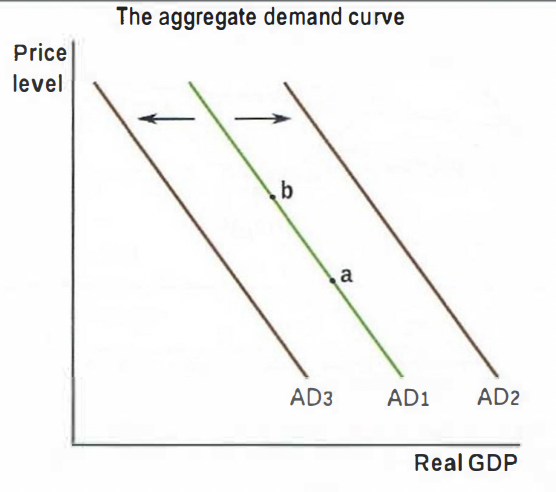
AD increases, shifting right when:
Consumption spending increases. This happens when:
consumer confidence improves = consumers become more optimistic about the future of the economy
interest rates fall = consumer borrowing increases (expansionary monetary policy)
wealth increases (ex stock market or house prices rise) → consumers feel wealthier
personal income taxes fall → disposable income increases (expansionary fiscal policy or market-based supply-side policy)
household indebtedness (debt) decreases → consumers feel more comfortable about their spending
Investment spending increases. This happens when:
business confidence improves → firms become more optimistic about the future of the economy
interest rates fall → firm borrowing increases (expansionary monetary policy)
technological improvements occur = investment spending increases
business taxes fall → after-tax profits increase (expansionary fiscal policy or market-based supply-side policy)
corporate indebtedness (debt) decreases → firms feel more comfortable about investment spending
Government spending increases. This happens when:
political priorities of the government change → spending on various activities increases (ex education, health care, infrastructure, defense, etc)
economic priorities of the government change → the government increases its spending on various activities (expansionary fiscal policy or interventionist supply-side policy)
Net export spending (X-M) increases. This happens when:
income of trading partners abroad increases → demand for a country's exports increases
a country's exchange rate falls (depreciation) → exports become cheaper to foreigners and imports become more expensive to domestic residents => exports increase and imports decrease > net exports (= X - M) increase
trade protection abroad decreases (= fewer restrictions on imports in other countries) → a country's exports increase
domestic trade protection increases (= more restrictions on imports from other countries) → imports fall = net exports (= X - M) increase
AD decreases, shifting left when:
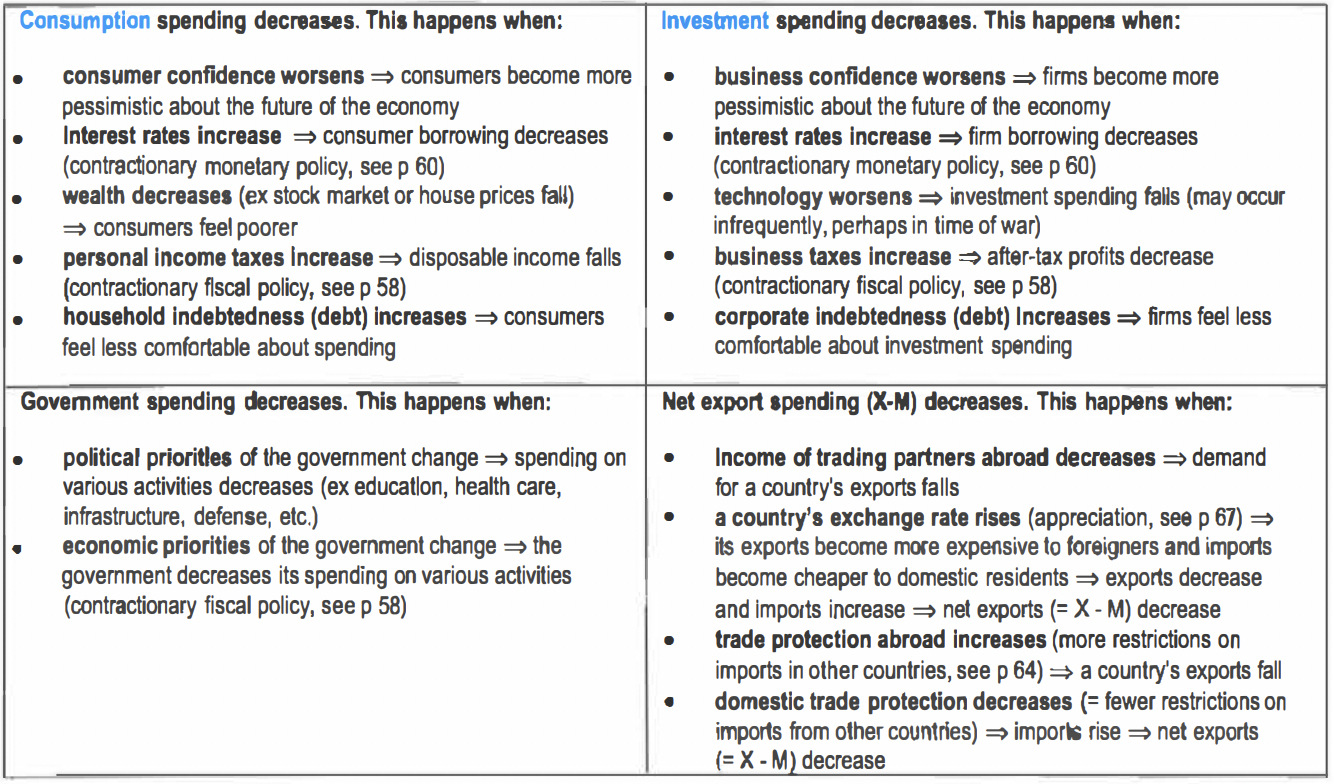
aggregate supply (AS)
aggregate supply (AS)= the total amount of real output (goods and services) produced in an economy in a year at different price levels
There are three kinds of AS curves: short-run aggregate supply (SRAS) long-run aggregate supply (LRAS) and Keynesian AS.
Short run in macroeconomics = the period of time when all resource prices (wages and prices of all other factors of production are constant)
Long run in macroeconomics = the period of time when all resource prices (wages and prices of all other factors of production) change to match changes in the price level (resource prices and the price level increase or decrease together).
Short run aggregate supply (SRAS)
In the short run, the AS curve (SRAS) has an upward slope: there Is a positive relationship between the price level and real GOP. This is due to firm profitability: If the price level increases (with wages and all other factor prices held constant)⇒ firms' profits increase⇒ firms increase the quantity of output they produce⇒ there is an upward movement along the SRAS curve. If the price level falls (with all factor prices constant) ⇒ firms' profits fall ⇒ firms decrease the quantity of output they produce ⇒ there is a downward movement along the SRAS curve.
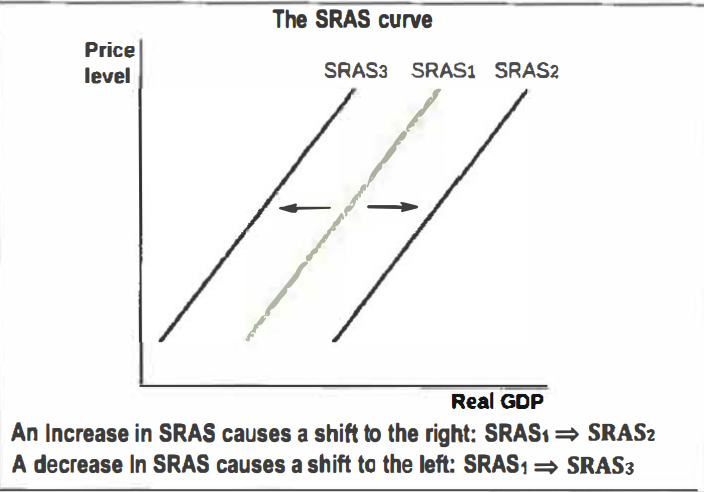
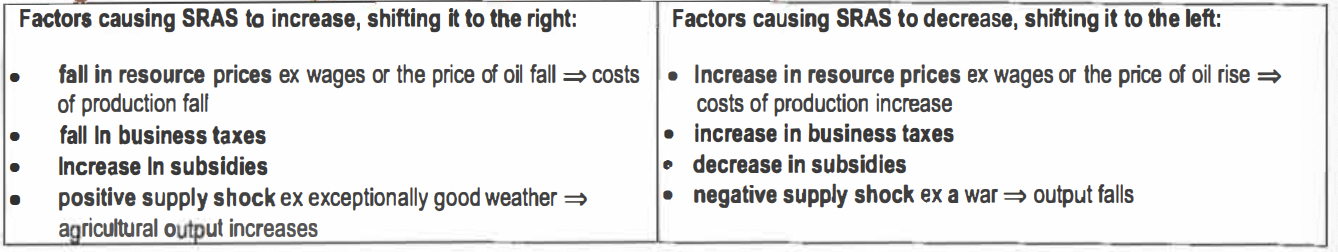
Shifts of the AS curve over the long-run (monetarist/new classical LRAS) or over the long term (Keynesian AS)
Changes in the quantity and/or quality of factors of production
Improvements in technology
Increases in efficiency
Changes in institutions
Equilibrium in the short run and changes in short run equilibrium
In the AD-AS model, the intersection of AD and SRAS determine short-run equilibrium in the economy, which in turn indicates equilibrium real output (real GDP}, shown as Y' and the equilibrium price level
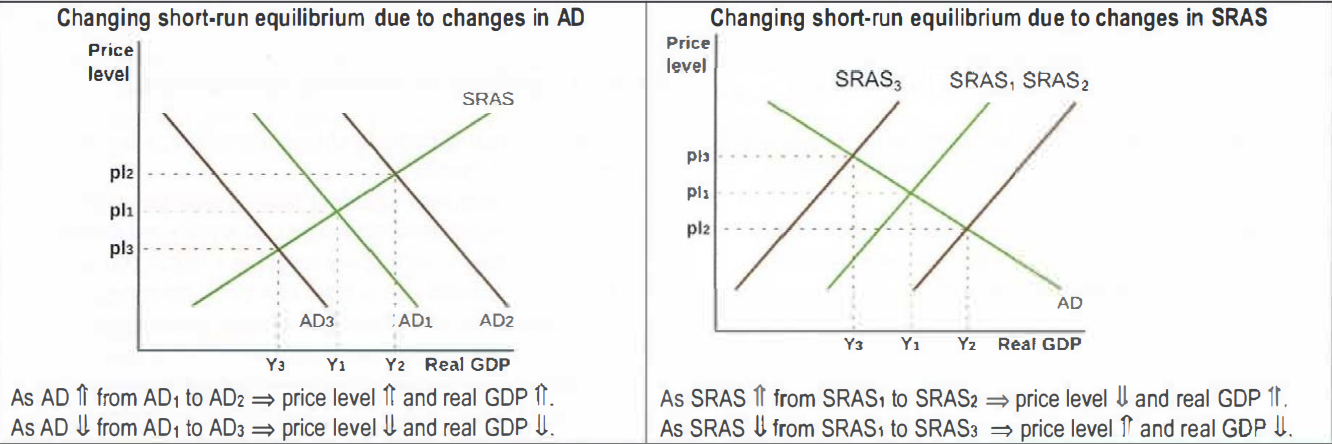
Monetarist/new classical view of the long-run aggregate supply (LRAS) curve
Long run aggregate supply (LRAS) full employment output= potential output= output where cyclical unemployment is zero, and unemployment equals the natural rate, occurring when the economy is at long run equilibrium In the long run, the AS curve (LRAS) is vertical at the level of potential output, Yp (= full employment output}, because in the long run, resource prices change along with the price level, therefore in real terms resource prices remain constant. Thus, as the price level increases or decreases, firm profitability is constant, and firms face no incentive to change the quantity of output they produce. Therefore the quantity of output produced in the long run is independent of the price level.
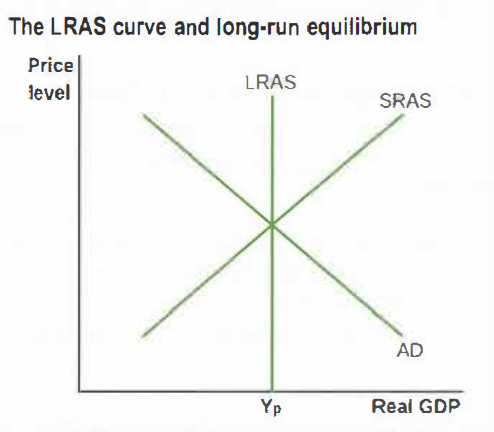
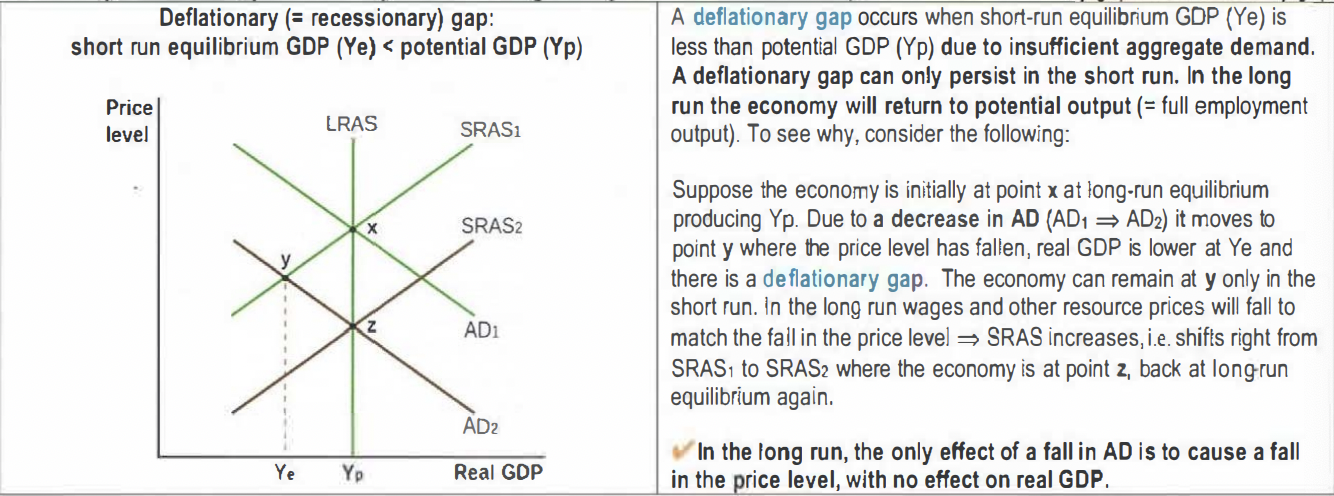
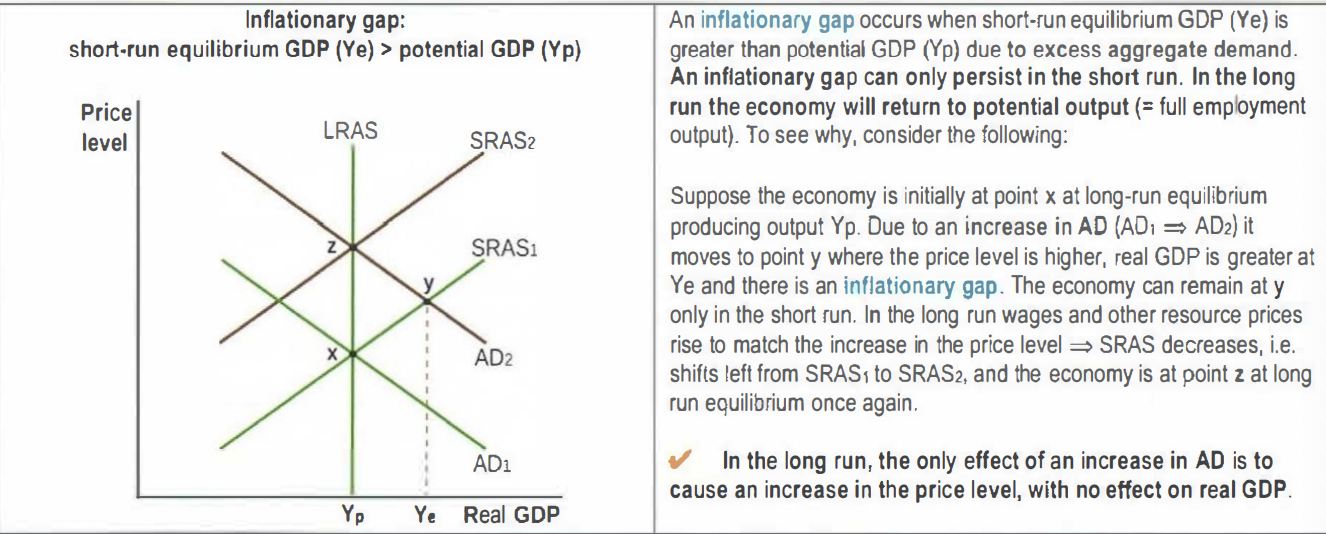
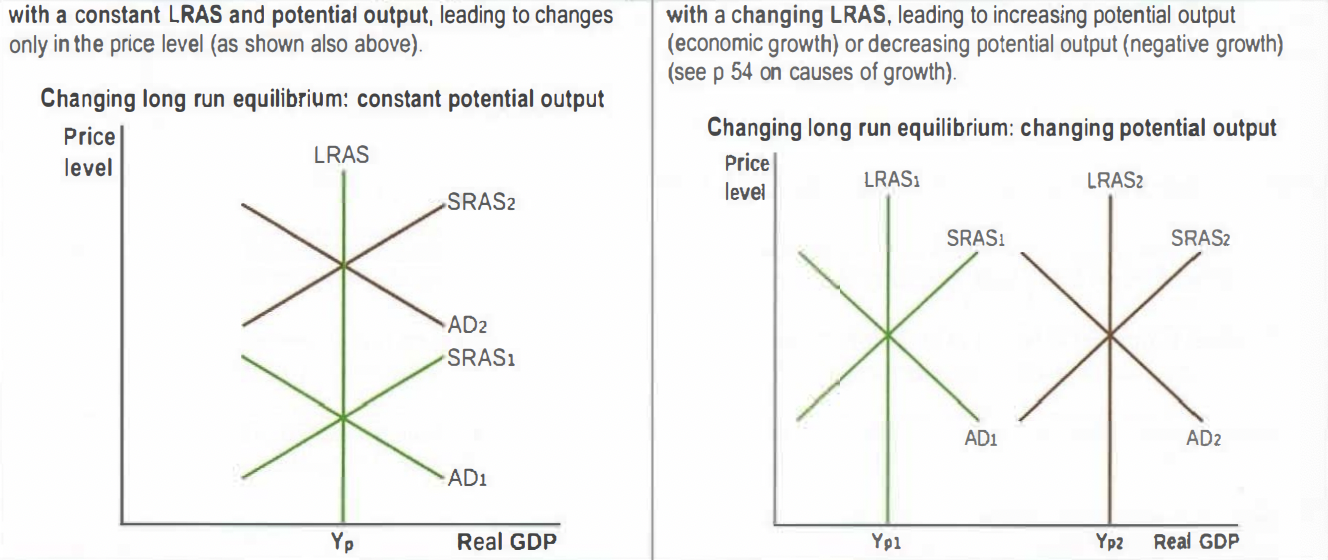
Determination of long-run equilibrium at full employment level of output (potential output)
Automatic adjustment to full employment equilibrium
Unemployment at full employment equilibrium is equal to the natural rate of unemployment
Keynesian view of the AS curve
The three sections of the Keynesian AS curve
The horizontal section occurs because of two factors:
a. wage-price downward inflexibility Wages do not fall easily (they are inflexible downward) because of wage contracts, minimum wages, and unpopularity of wage cuts. The price level also does not fall easily (it is also inflexible downward) because if wages do not fall, a drop in product prices would cut into firms' profits, which firms wish to avoid.
b. spare capacity when the economy is in recession At low levels of output, when the economy is in recession, there is Unemployment of labor and other resources, so if firms decide to increase output and demand more resources, there is no upward pressure on wages and the price level, therefore they do not increase.
The upward sloping section occurs because of resource bottlenecks (shortages) that appear as output increases and approaches full employment or potential output (Yp), causing resource prices to increase. As firms' costs of production rise, firms raise product prices so the price level begins to rise.
The vertical section occurs because maximum capacity output (Ym) is reached, meaning that all resources are employed to their maximum extent, and it is therefore not possible for output to increase further. Any effort to increase output beyond this point results only in increases in the price level.
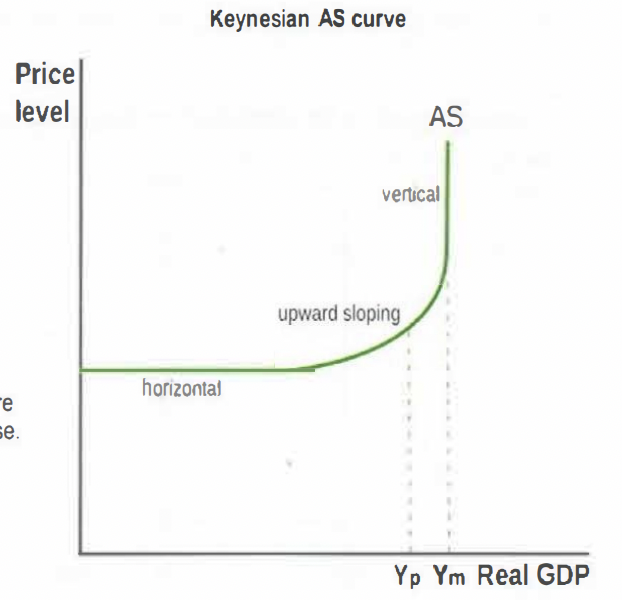
Persistence of deflationary/recessionary gaps: equilibrium level of output might not equal the full employment level of output
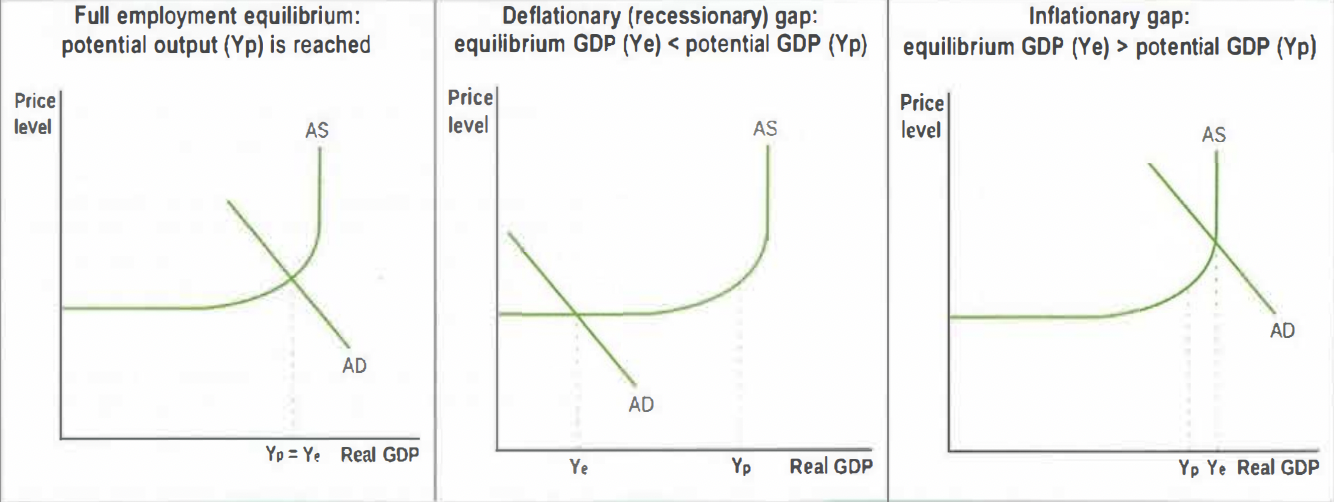
Since resource prices and product prices are inflexible downward, the economy cannot move into the long run. This means that the economy can remain Indefinitely stuck in a deflationary (recessionary) gap, caused by insufficient aggregate demand, and therefore requires expansionary demand-side policies (fiscal and/or monetary) to come out of the recession.
Whereas in the monetaris/new classical model expansionary policies are always inflationary (leading to a higher price level due to the upward sloping SRAS curve and the vertical LRAS curve), in the Keynesian model expansionary policies do not lead to any increase in the price level when the economy is in recession {the horizontal part of the curve). Increases in AD become inflationary only as the economy approaches full employment output.
Shifts in aggregate supply over the long term and economic growth
Over the long term (a long period of time) the LRAS and the Keynesian AS curves can shift, indicating that potential output, Yp, changes. Usually these shifts are to the right, indicating economic growth(= growth in real GDP). Factors shifting the curves include:
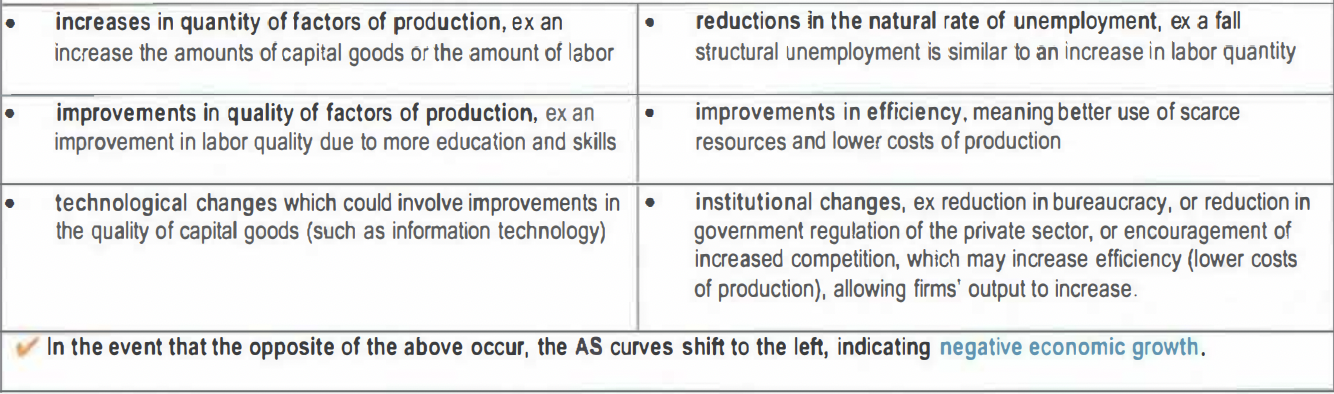
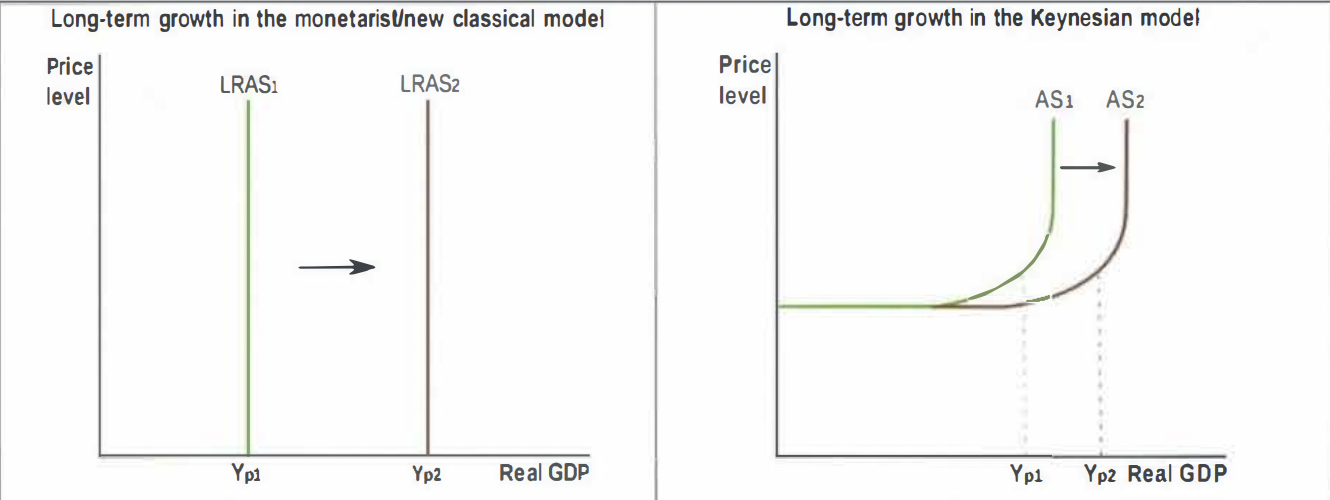
Macroeconomics equilibrium
The equilibrium point is the point at which demand is equal to supply. This point determines the average price and quantity produced and sold on the market. Since we have learned that there are three different supply curves, three possible equilibria exist:
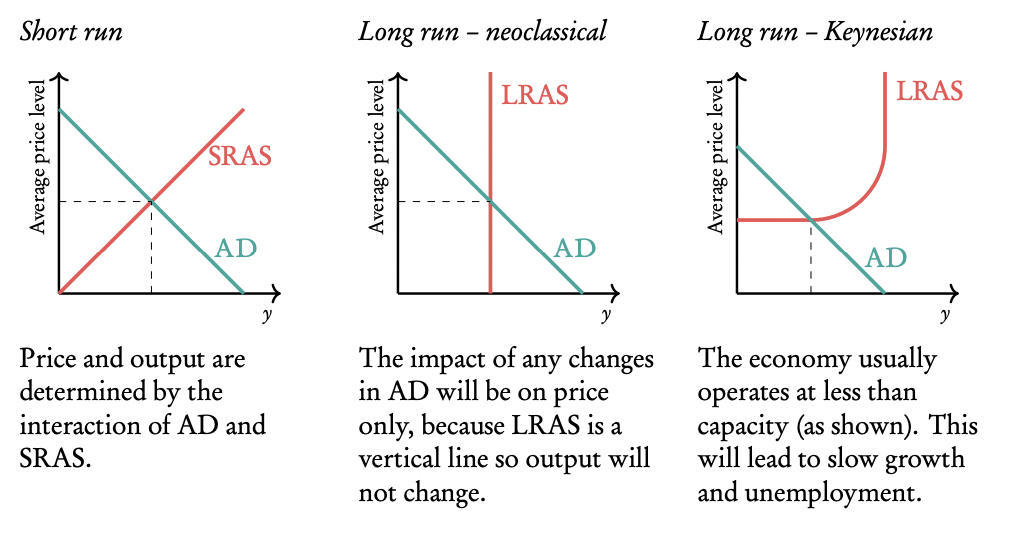
Changes in the long run neoclassical equilibrium Two possible changes are possible: (1) an increase in AD and (2) a decrease in AD. We will illustrate both changes graphically:
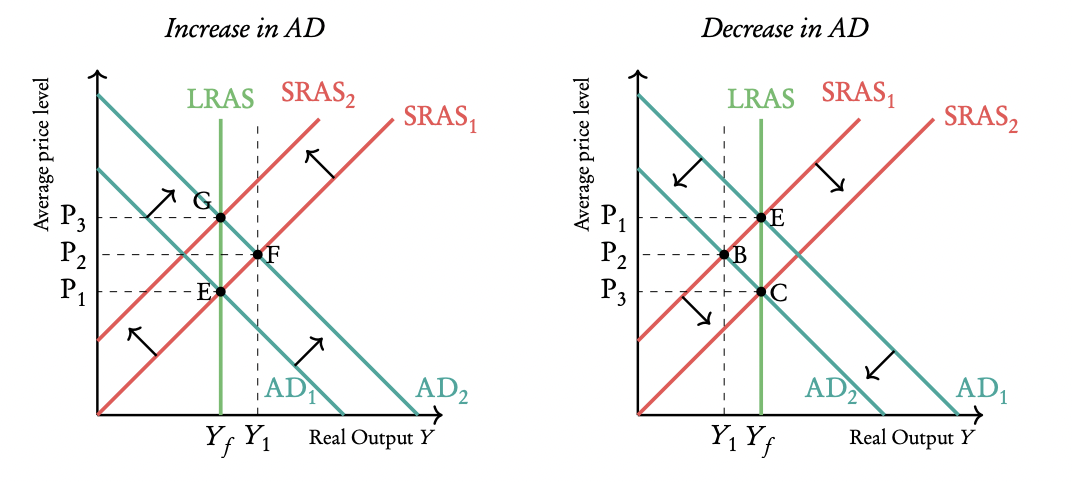
Increase in AD
E is our starting point: long run equilibrium, full employment (producers are producing at full capacity)
AD increases so we move from AD1 to AD2 . We end up at point F at a higher average price and a higher output.
But this means that the economy is now producing beyond full capacity, this leads to a dramatic increase in costs.
In order to solve this, firms will decrease their SRAS, so SRAS shifts to the left: SRAS1 ⇒ SRAS2 . We end op at point G.
Result: we end up at the same level of real output as before (again full employment) but at a higher average price.
Decrease in AD
nE is our starting point: long run equilibrium, full employment (producers are producing at full capacity)
AD decreases so we move from AD1 to AD2 . We end up at point B at a lower average price and a lower output.
But this means that the economy is now producing below full capacity, this leads to a dramatic decrease in costs.
In order to solve this, firms will increase their SRAS, so SRAS shifts to the right: SRAS1 ⇒ SRAS2 . We end op at point C.
Result: we end up at the same level of real output as before (again full employment) but at a lower average price.
Changes in the long run Keynesian equilibrium Again we will discuss what will happen when AD changes, but this time in the situation of a long run Keynesian equilibrium.
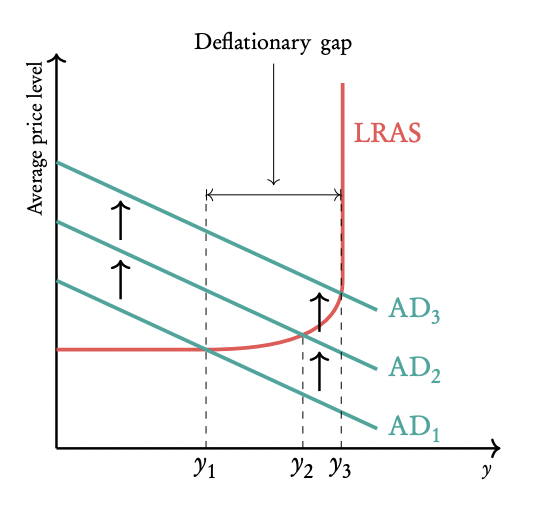
Increase in AD (decrease in AD: the opposite will happen)
We start at AD1 , output is at y1 . At this point production is below capacity: there will be unemployment and slow growth. There is a deflationary gap: demand is less than potential output.
AD increases so we move from AD1 to AD2 . This reduces unemployment (output increases), but also increases inflation (price level increases).
When AD increases even further to AD3 , the same thing will happen.
But with each increase of AD the increase in output will be less big and the inflation even higher.
Shifts in the LRAS curves Another possibility is the increase of the neoclassical or Keynesian LRAS curve, which can shift either to the left or to the right. When this happens, all you have to do is find the intersection of the new LRAS curve and the AD curve. Production and average price level will be at this point.
Macroeconomic objective: Economic growth
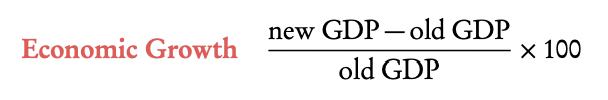
There are two possible sources of economic growth:
1. GDP increases due to an increase in output
2. GDP increases due to an increase in potential output
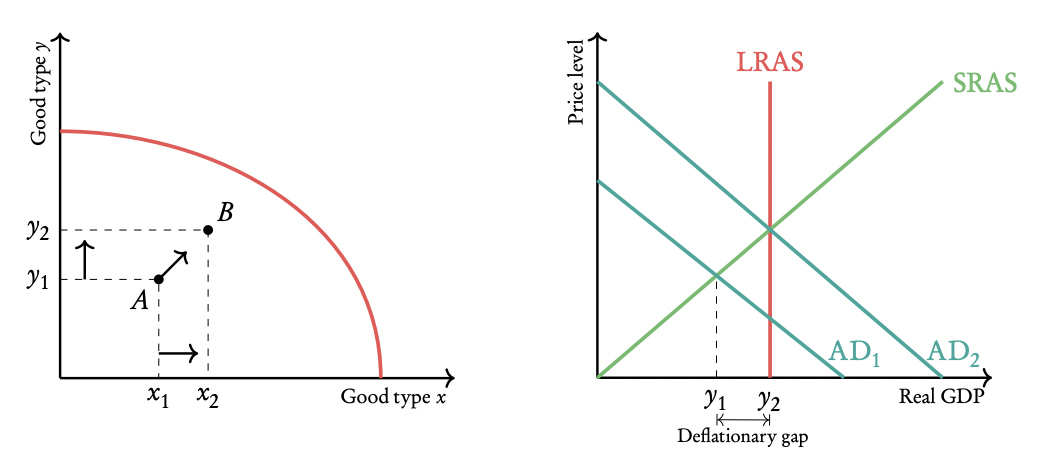
The graph on the left shows the Production Possibilities Frontier (PPF) = A curve that shows the theoretical maximal combination of two goods that an economy can produce if full use is made of all factors of production.
When AD increases (AD1 ⇒ AD2 in the graph on the right), GDP will increase aswell (y1 ⇒ y2 ).
In the PPF: a shift from point A to point B: a higher production of both goods can be attained.
Possible cause: the country is making better use of existing resources, resulting in a more efficient production.
The gap between y1 and y2 is called a deflationary gap, because the economy was not producing at capacity (a point on the LRAS) curve.
Increase in potential output
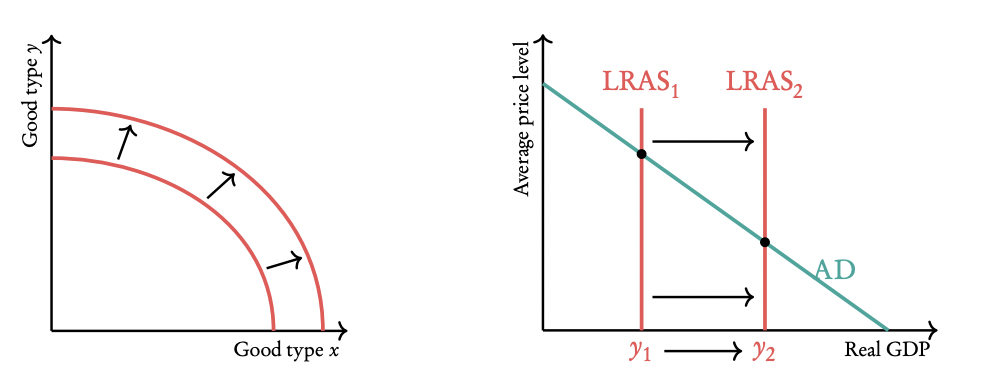
The theoretical maximum production is increased, the production at full capacity is higher than before.
LRAS (= production at capacity) increases: LRAS1 ⇒ LRAS2 .
PPF shifts outwards: the theoretical maximum production is increased, so more of both good y and good x can be made.
Possible cause: increases in the quantity and quality of resources due to investments in:
Human capital to increase productivity / skill of workers (e.g. through education).
Physical capital to increase quantity / quality of man-made resources (e.g. better machines, technological advance).
Natural capital to improve / increase the stock of natural resources (e.g. explore parts of the world for fossil fuels).

Consequences of economic growth
Increase in living standards, due to higher GDP per capita, increase in wealth.
Decrease in unemployment, more workers needed for the increased production.
Possible increase in inflation; when caused by a higher demand prices may rise due to demand pull inflation.
Possible reduction in inequality (using taxation). Governments can increase their tax revenue and redistribute more.
Increase in exports and imports: more production may lead to a higher export potential, more demand may lead to a higher import potential.
Possible increase in sustainability. When GDP is growing there is more money available to work on sustainable technologies / when GDP growth is caused by technological advance, part of that technological advance may be used for a more sustainable production.
Possible decrease in environment: a higher GDP means production has increased. Production may be polluting the environment.
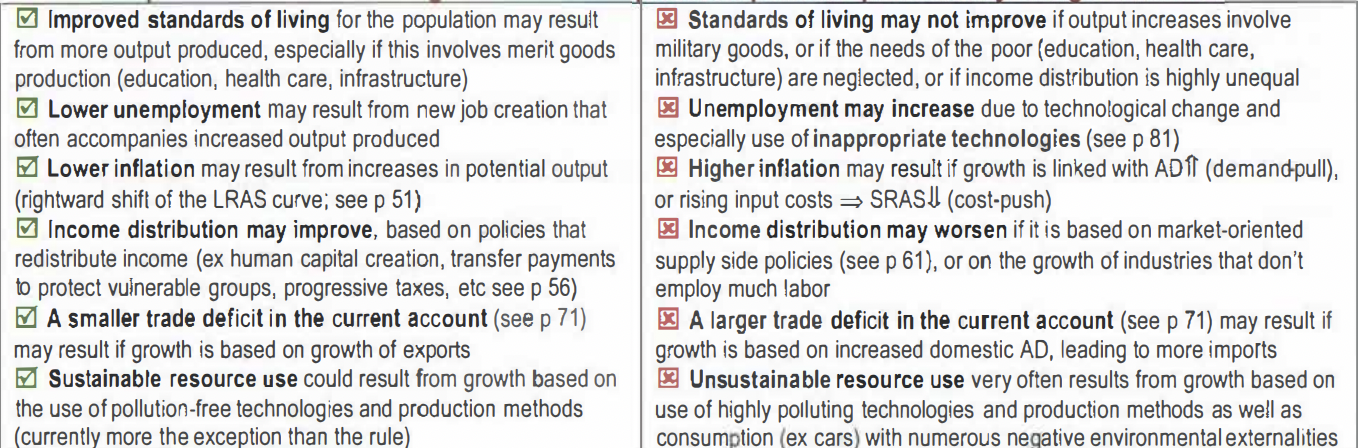
Macroeconomic objective: Low unemployment
Unemployment all people of working age that are not working and are actively looking for a job.

Labour force everyone that can, wants to, and is allowed to work. Typically the labour force consists of all people that are currently employed + all unemployed people
Unemployment can be hard to measure, this has several reasons:
1. The existence of hidden unemployment: people not represented in the unemployment figures:
people who have given up looking for a job;
people in a parttime job that would want to work full time (which isn’t possible);
people who are overqualified for a job, but can’t find a better one.
2. Unemployment figures are an average: the unemployment figure ignores regional, ethnic, age and gender differences.
Consequences of unemployment:
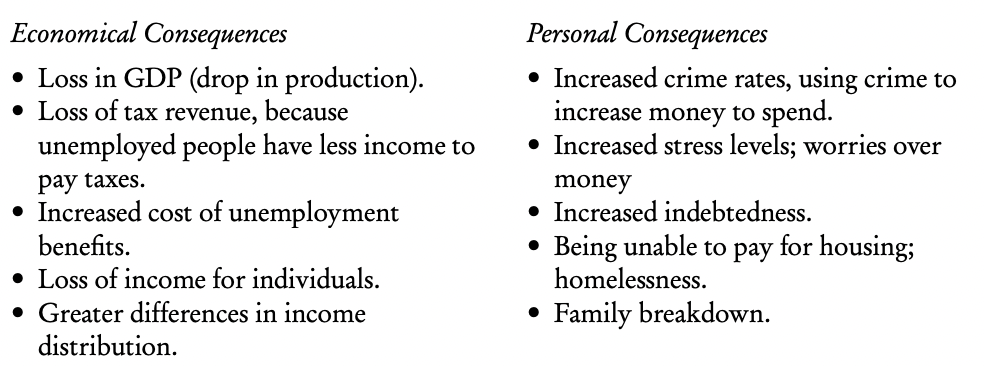
Types of unemployment:
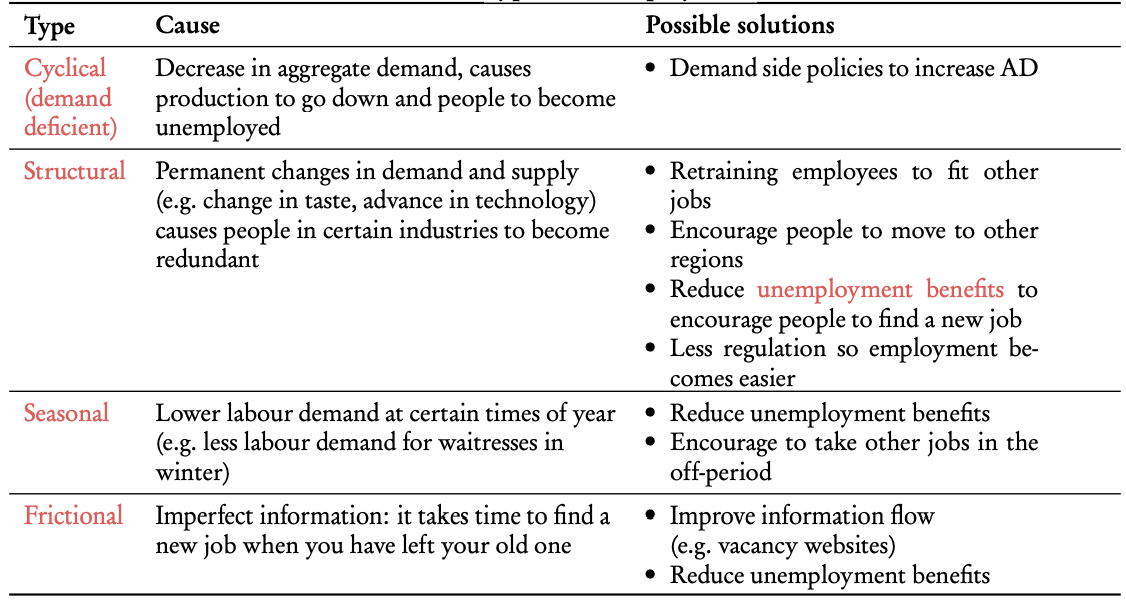
Structural unemployment:
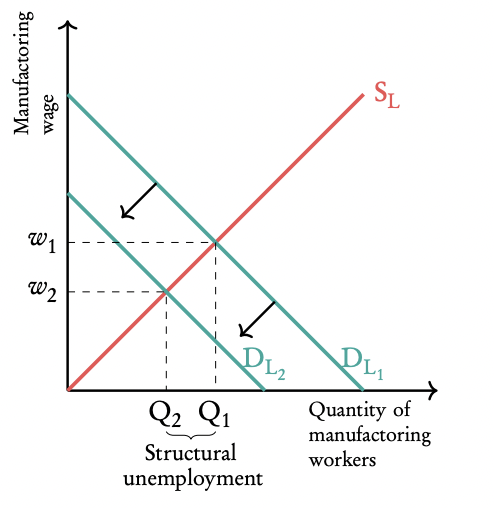
Due to a change in AD (e.g. taste, technology) the labour demand (DL ) decreases from DL1 to DL2 .
Employment decreases from Q1 to Q2 .
Wages decrease from w1 to w2 .
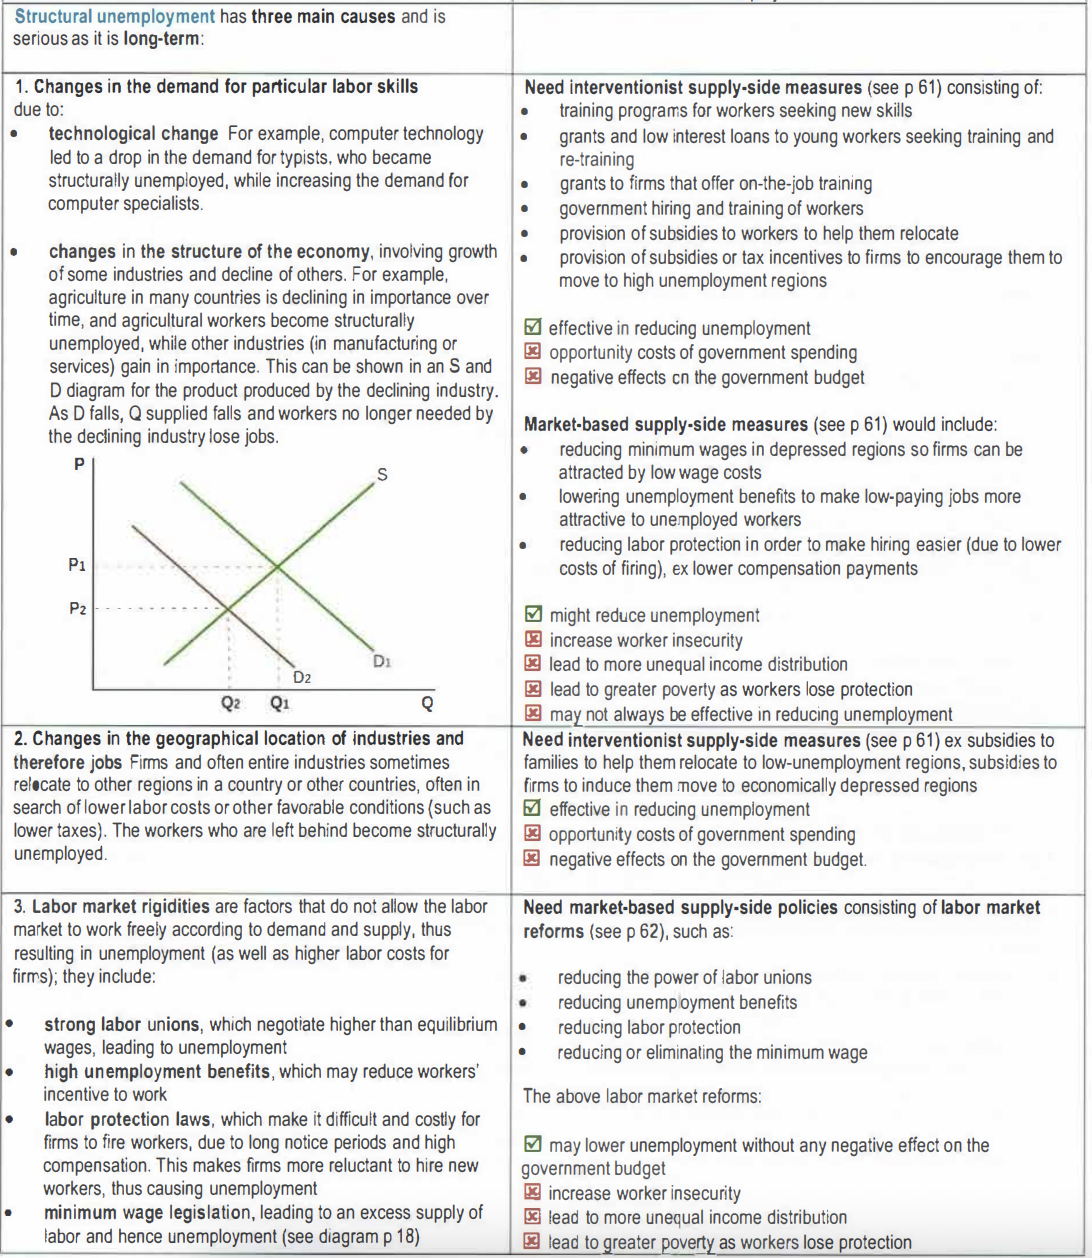
Cyclical unemployment:
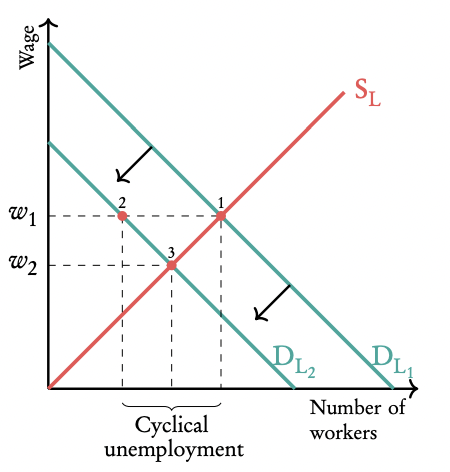
Due to economic recession labour demand decreases from DL1 to DL2 .
But wages are sticky, it takes time for wages to adjust to a new situation. This can be because contracts determine wages over a longer time period or people who are already employed won’t take a lower wage: they remain at w1 instead of falling to w2 .
There is a surplus of labour: supply of labour is at point 2, demand for labour at point 1.
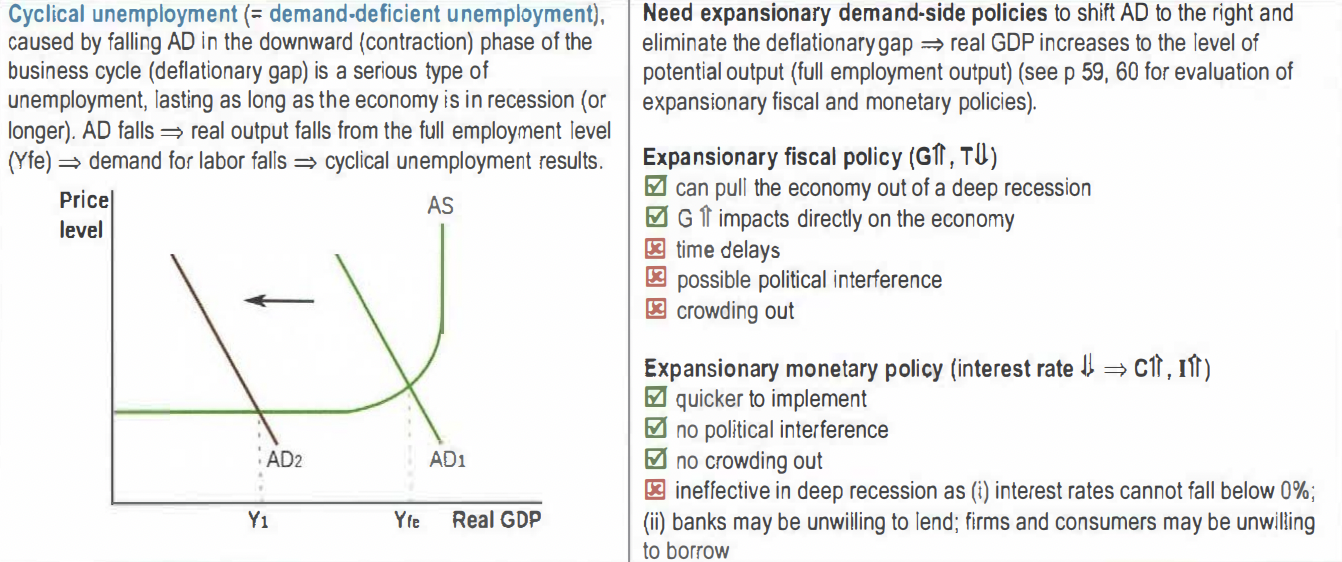
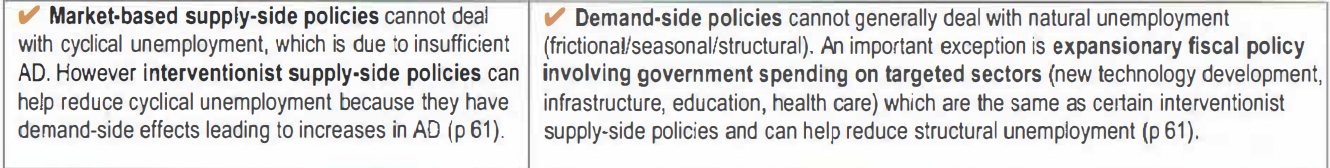
Natural rate of unemployment—sum of the structural, seasonal, frictional unemployment

Macroeconomic objective: Low and stable rate of inflation
Inflation a sustained increase in the level of prices
Disinflation a persistent fall in the rate of inflation
Deflation a persistent fall in the level of prices
Inflation can be measured in two ways:
Consumer Price Index (CPI)
Economists compile a basket of goods that is representative for the economy, they then compare the cost of this basket over time. The increase in price of the basket is the inflation rate.
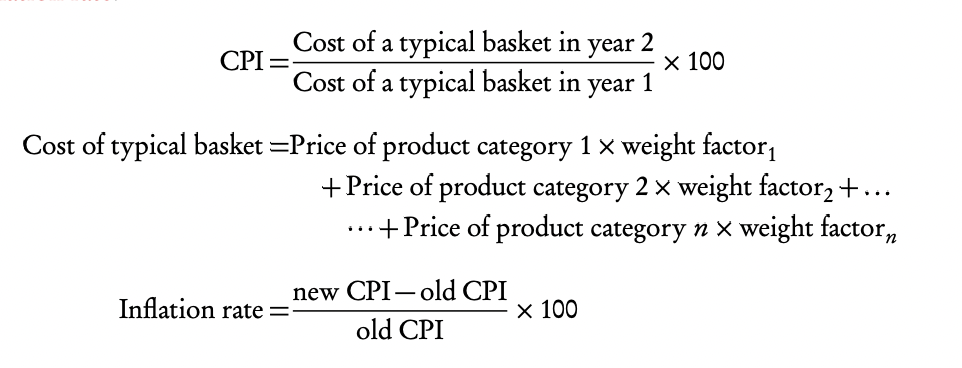
Producer Price Index (PPI)
Economists compile a basket of factors of production representative for the economy, they then compare the cost of this basket over time. The increase in the price of the basket is the inflation rate. Changes in the PPI can predict future inflation: Higher resource prices eventually lead to higher consumer good prices
Consequences of inflation
Greater uncertainty: what will prices do in the future?
Decrease in purchasing power: people can buy less due to higher prices.
Less savings: people want to spend money now, because it is decreasing in value.
Damage to export competitiveness: foreign countries will buy less goods from the country that has inflation due to increasing prices in this country.
Consequences of deflation
Deferred consumption: consumers will wait to spend money, because prices are decreasing: goods bought in the future will be cheaper.
High level of cyclical unemployment: less consumption will lead to less production and therefore causes unemployment.
Bankruptcies: less consumption will cause profits of firms to decline. This may result in them having to shut down.
Difficulties in measuring inflation
Different income earners may experience a different rate of inflation when their consumption pattern is not accurately reflected in the CPI (it is an average).
Inflation figures may not accurately reflect changes in consumption patterns and the quality of the goods purchased.
Sudden swings in the price level of food and oil can influence CPI heavily. Economists therefore also calculate an underlying rate of inflation.
CPI only measures change in consumption prices, while changes in producer prices are also important (the PPI does use producer prices).
Two different forms of inflation: demand pull inflation (left) and cost-push inflation (right).
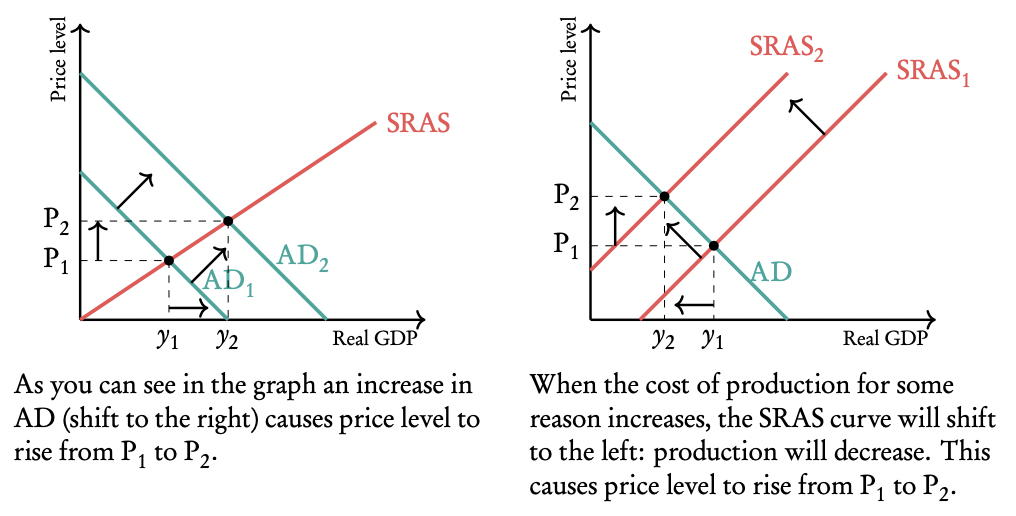
Demand-pull inflation
Demand-pull inflation occurs when there is an increase in aggregate demand in the economy. In order to supply the increased number of goods and services now required, higher prices are needed.
Cost-push inflation
Cost-push inflation occurs when aggregate supply falls. This will always be caused by an increase in the costs of production or a sharp disruption in the availability of the factors of production. There are many factors that may cause cost-push inflation, including war, natural disasters, changes to minimum wage laws, increases in the cost of imported raw materials and business regulations that apply to all firms in a country.
How could the government reduce inflation?
Increase taxes / reduce government spending (fiscal policy): this will cause incomes of people to decrease, reducing spending and thus reducing demand pull inflation.
Raise interest rates: this will cause people to save more (they will get more interest) and spend less, this reduces demand pull inflation.
Reduce money supply (monetary policy): when there is less money in circulation, the value of money will increase. So less money is needed to buy something and the price is reduced.
Supply-side policies – shift supply curve to the right: (e.g. education, invest in technology etc.) this will reduce the cost for producers, reducing cost-push inflation.
Deflation
1. Good Deflation: From Increased Productivity
Deflation can be beneficial if caused by rising productivity or innovation (e.g. steam engine, internet).
This shifts AS → AS1, lowering price level from PL → PL1 (Figure 1).
All resources are used efficiently, prices fall, but output may rise.
Benefits: stronger exports, more purchasing power for savers.
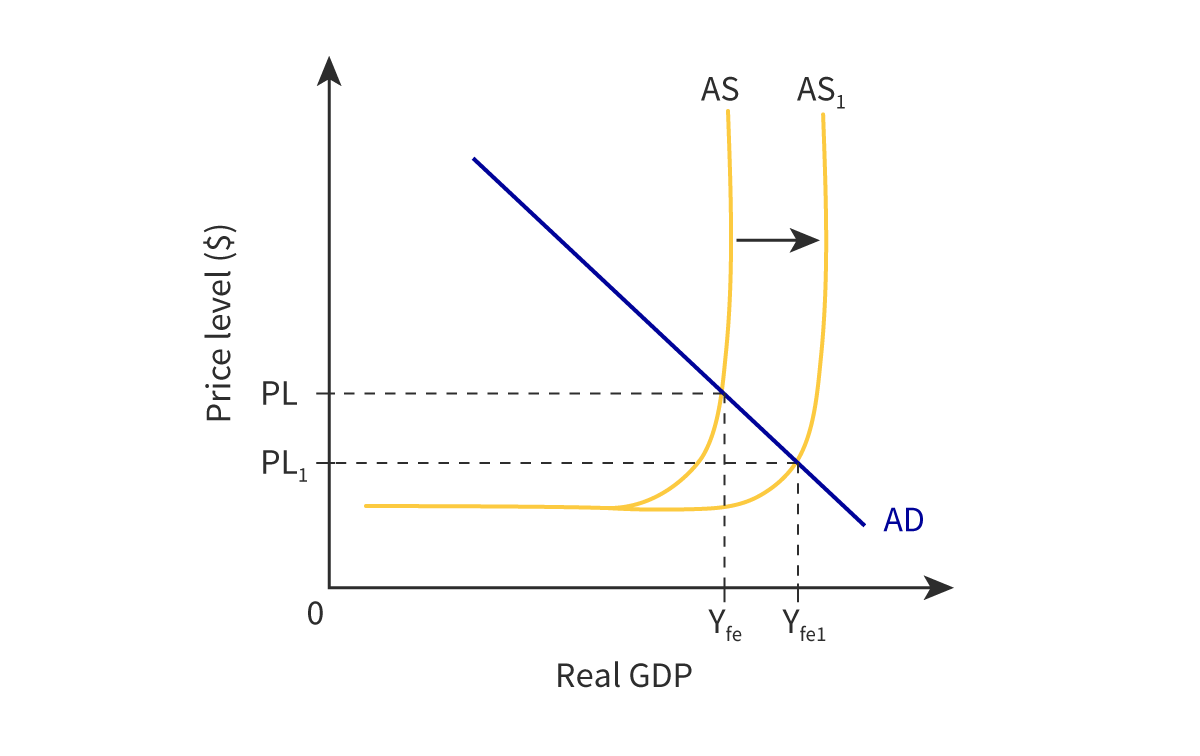
2. Falling Production Costs
Lower input costs (e.g. cheaper oil) shift SRAS → SRAS1 → SRAS2, reducing prices (Figure 2).
Tech improvements shift LRAS outward in the long run, also reducing price level.
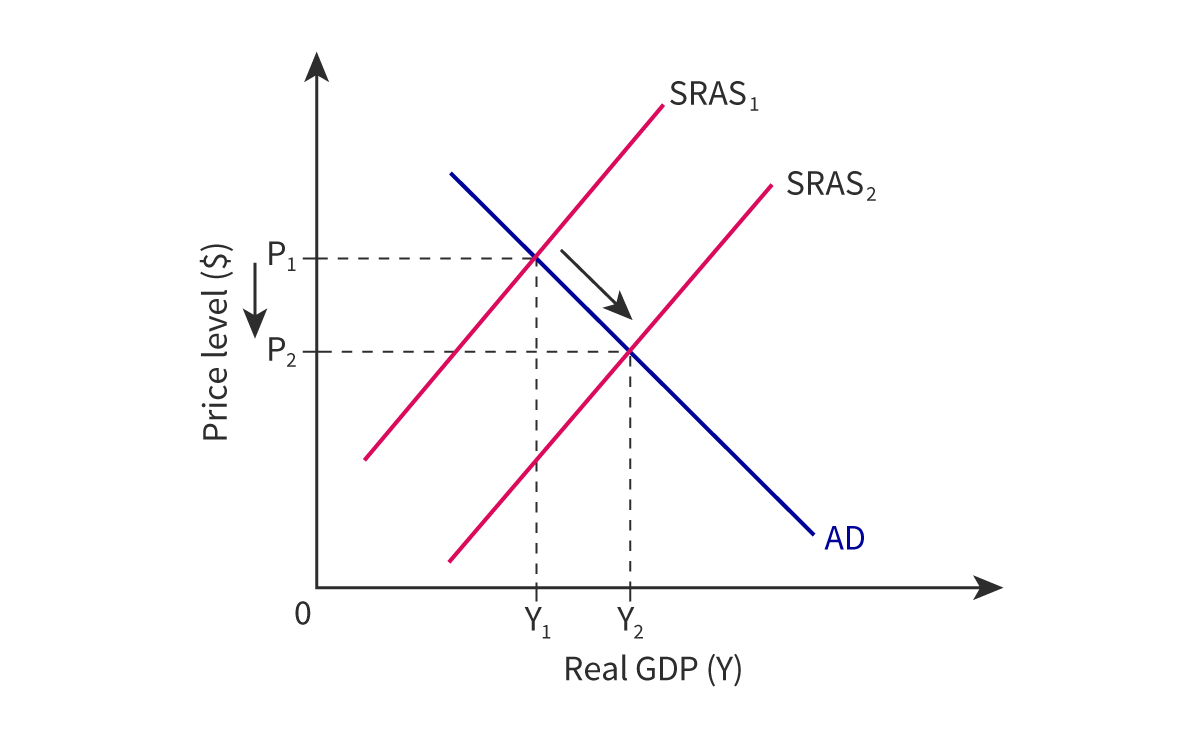
3. Bad Deflation: Falling Aggregate Demand
A fall in AD shifts AD → AD1, lowering PL → PL1 (Figure 3).
Leads to falling output and incomes; excess supply and unemployment.
Hard for firms to cut prices or wages, making this kind of deflation harmful and a sign of economic distress.
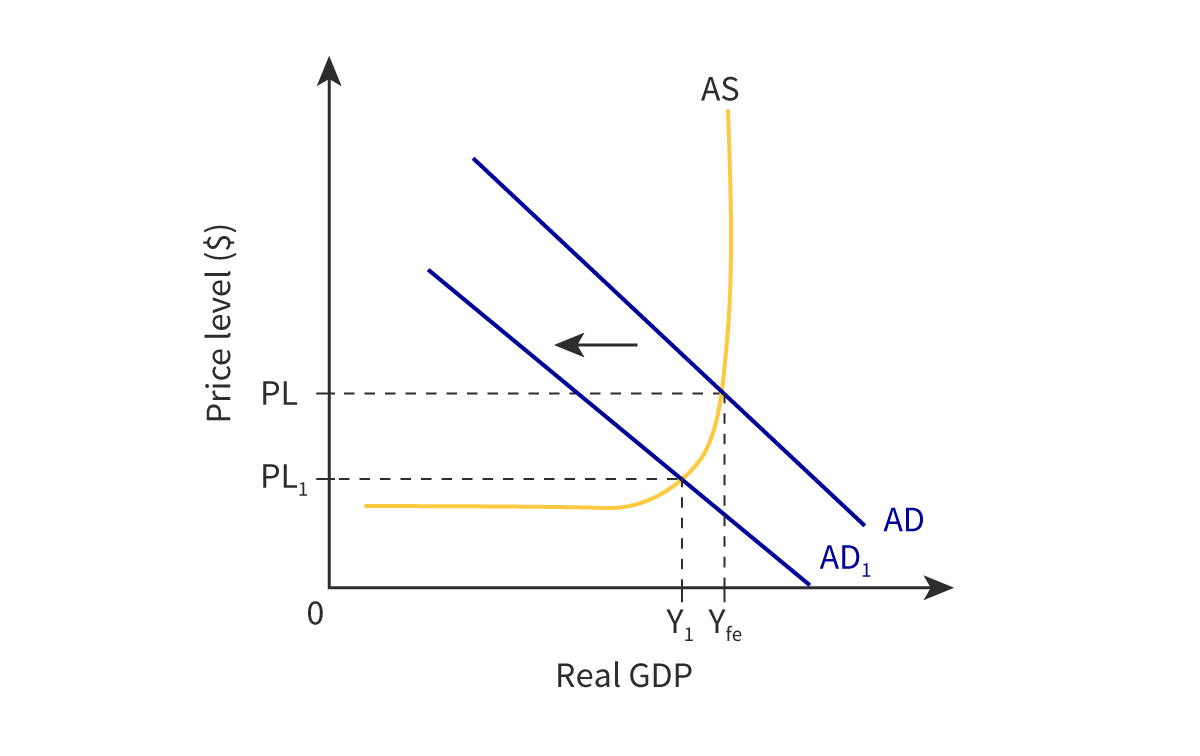
Costs of Deflation (Demand-Deficient)
Business Uncertainty: Firms delay investment due to falling prices and profits.
Redistributive Effects: Savers and lenders gain; borrowers and those on fixed payments lose.
Deferred Consumption: People delay spending, expecting prices to fall more—especially on big items.
Unemployment: Falling prices → lower wages → less demand → job losses (wage–price spiral).
Bankruptcies: Firms earn less but still owe the same debts → more business failures.
Rising Real Debt: Debt becomes harder to repay as its value increases relative to income.
Bad Resource Allocation: People and firms save more and spend less → inefficient use of resources.
Weak Policy Impact: Even with lower interest rates or more government spending, demand might stay low if people expect prices to keep falling.
Disinflation vs Deflation
Deflation = General price level falls (rare)
Wages are sticky (don’t fall easily), so firms avoid cutting prices
Oligopolies fear price wars, avoid lowering prices
Menu costs make frequent price changes expensive
Disinflation = Prices still rise, but slower rate
Example: Eurozone (2012–2014), inflation fell to 0.5%
Risk: Can lead to deflation if consumers delay spending
Govts use fiscal & monetary policy to avoid this
Relative Costs of Unemployment vs Inflation
Relative Costs of Unemployment vs Inflation
Governments aim for both low inflation and low unemployment, but achieving both at once is difficult. Low unemployment can lead to higher wages, which raises costs and causes inflation. This trade-off is shown in the Phillips Curve.
Inflation Costs: Hurts savers, reduces export competitiveness, and can lead to boom–bust cycles.
Unemployment Costs: Causes more severe long-term social and economic problems—lost income, higher inequality, political instability, and reduced skills.
Some economists argue moderate inflation (e.g. 4–5%) is less harmful than high unemployment, which can cause more permanent damage to individuals and society.
Conflicts Between Macroeconomic Objectives
Low Unemployment vs Low Inflation: As unemployment falls, wages rise, causing inflation. To keep inflation low, governments may raise interest rates, which then increases unemployment.
Growth vs Inflation: If growth (AD) rises too fast, inflation increases. But if growth comes from higher productivity (LRAS), inflation stays low.
Growth vs Equity: Growth may increase income inequality, but it can also reduce poverty and create jobs if managed well.
Growth vs Environment: Economic growth can harm the environment, but with green tech and sustainable policies, the two can align.
equality and equity
Equity fair distribution of income.
Equality equal distribution of income.
Due to unequal ownership of factors of production there is inequitable distribution of income.
How to promote equity?
Taxation to redistribute income
Direct vs. indirect taxes
– Direct: imposed directly on income, wealth and profit. (e.g. income tax)
– Indirect: imposed over consumer spending (e.g. VAT)
Progressive, regressive and proportional taxation
– Progressive: the higher the income, the higher the average tax rate.
– Regressive: the higher the income, the lower the average tax rate.
– Proportional: same tax rate for all incomes.
Direct government expenditures
• Provide money directly to people
• Subsidies (e.g. subsidise certain sectors in order to employ more people).
• Transfer Payments (e.g. unemployment benefits, pensions).
Evaluation of redistribution of income policies
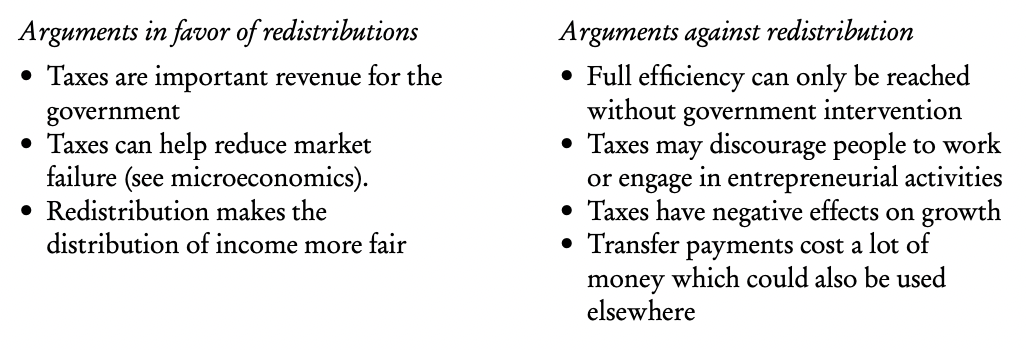
Measuring economic inequality: Lorenz curve
The degree of equity can be measured using the Lorenz curve
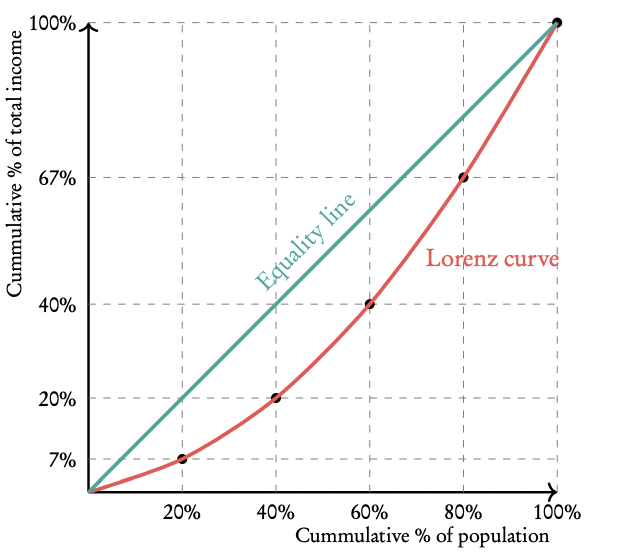
The population of a country is divided into a number of income groups of equal size (in this example: 5). The first group contains the 20% poorest people of the country, the final group the 20% richest people of the country. Of each group the percentage of total income which the people in the respective group earn is calculated.
The cumulative data of these percentages is used to draw the Lorenz curve.
The green line in the diagram represents the equality line: if every group earned the same percentage of total income, the Lorenz curve would lie on this equality line. The further away the Lorenz curve lies from the equality line, the less equal the income is distributed among the people of the country.
Another measure of equality is the Gini-index. This is a number between 0 and 100. The higher this Gini-index the more unequal the distribution of income.
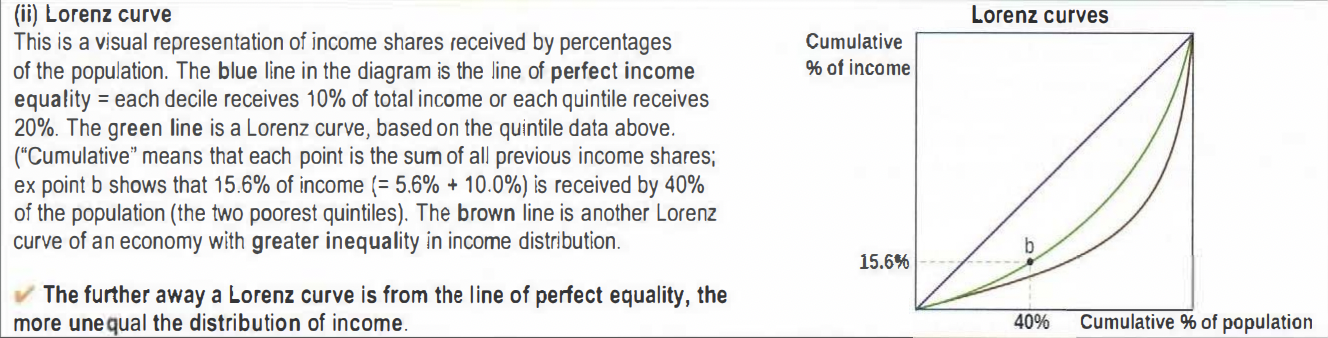
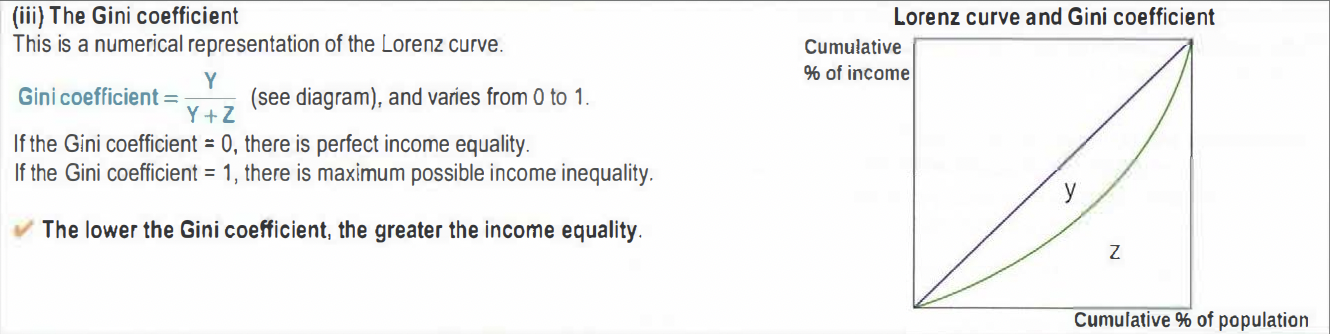
Poverty
Absolute poverty the inability to fulfill the basic economic needs.
Relative poverty being poor relative to others around you.
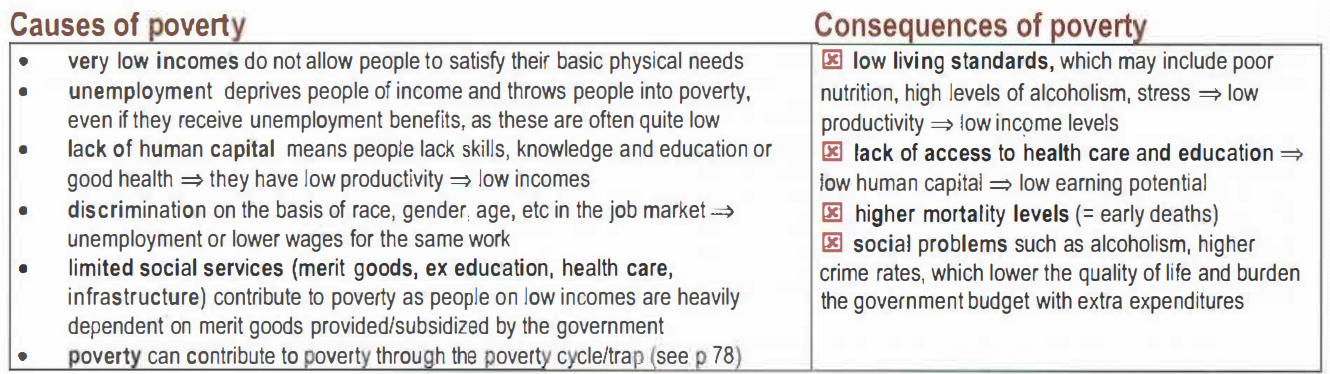
inequality of opportunity
different levels of resource ownership
different levels of human capital
discrimination (gender, race and others)
unequal status and power
government tax and benefits policies
globalisation and technological change
market-based supply side policies
Measuring Poverty
Poverty is measured using single indicators, like the international poverty line (e.g. $1.90/day) and minimum income standards, which vary across countries. These focus on income but often miss key living conditions. In contrast, composite indicators like the Multidimensional Poverty Index (MPI) include factors such as health, education, and living standards to give a fuller picture of poverty.
Difficulties in Measuring Poverty
Challenges include poor data quality from surveys, overlooking intra-household and urban poverty, and a lack of disaggregated data by age, gender, or disability. These issues limit how accurately poverty can be assessed.
The impact of income and wealth inequality:
Economic Growth: Inequality reduces overall spending, productivity, and health, lowering growth potential.
Living Standards: Poorer people have worse health, education, and life satisfaction.
Social Stability: Inequality can lead to unrest, higher crime, and more public costs for healthcare and welfare.
The role of taxation in reducing poverty, income and wealth inequalities
direct taxes = taxes on income and wealth, paid directly to the government (ex personal income taxes, corporate income taxes, wealth taxes)
indirect taxes = taxes on spending to buy goods and services, paid indirectly to the government through the sellers (ex sales taxes, value added taxes (VAT), tariffs)

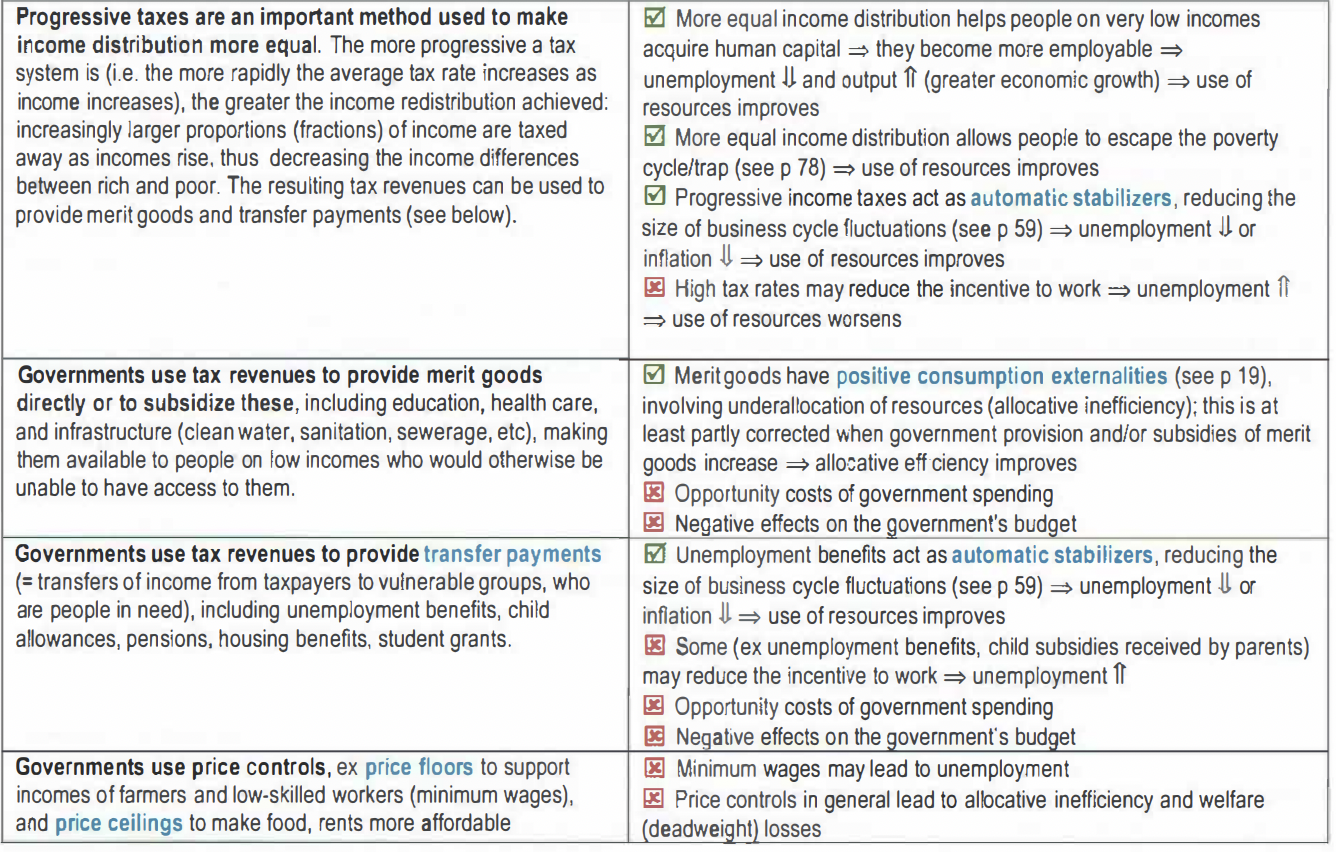
Types of Taxation:
Progressive Taxation
Higher earners pay higher tax rates. This helps redistribute wealth. For example, in New Zealand, income tax increases as income rises, but only applies to the income within each bracket.Regressive Taxation
A fixed tax amount hits lower earners harder because it takes up a larger percentage of their income. Examples include local taxes and VAT, which are more burdensome for those with lower incomes.Proportional Taxation
Everyone pays the same percentage of tax, regardless of income. For instance, Russia has a flat 13% income tax rate.
Direct Taxes:
Personal Income Tax: A progressive tax that takes a larger share from high earners, helping reduce income inequality.
Corporate Income Tax: Taxes corporate profits. While cuts in corporate taxes are often promised to benefit the middle class, studies show they mainly benefit the wealthy.
Wealth Tax: A tax on assets like cash or real estate, aimed at reducing wealth inequality. The effectiveness depends on the overall tax system.
Indirect Taxes: These are taxes on goods and services, often regressive since they disproportionately affect low-income people. Poorer households spend a higher percentage of their income on taxed goods, but this can be mitigated through exemptions or lower rates for essentials (e.g., food, healthcare).
Further Policies to Reduce Inequality
Inequality of Opportunity and Human Capital: Governments can reduce inequality by ensuring fair access to education, healthcare, and job training. By providing funding for schools, scholarships, and affordable university education, opportunities are created for individuals from low-income backgrounds to increase their human capital. Health care access ensures people stay productive, and labor market policies can reduce unemployment periods and improve skills.
Transfer Payments: Transfer payments are government funds given to low-income households to support their income. These include:
Old-age pensions for retirees who may not have saved enough.
Unemployment benefits to support individuals during periods of unemployment.
Child allowances to help families with children in poverty.
These payments aim to reduce poverty and income inequality by providing financial support to those in need.
Targeted Spending on Goods and Services: Governments may reallocate spending to areas like healthcare, education, and social protection to reduce inequality. Investments in infrastructure also improve labor mobility and provide better access to job opportunities for disadvantaged individuals. This type of spending has a long-term impact on reducing income inequality.
Universal Basic Income (UBI): UBI provides a universal payment to all citizens, ensuring a basic standard of living and reducing poverty. This financial security helps individuals improve their social position by providing more opportunities and freedoms.
Policies to Reduce Discrimination: Legislation can protect vulnerable groups from discrimination. For example, anti-discrimination laws in various countries aim to protect minorities, women, and senior citizens in areas like employment. This helps create a more inclusive society and reduce inequality.
Minimum Wages: Minimum wage laws set a floor for wages, helping to ensure that workers earn enough to maintain a basic standard of living. While this can sometimes result in higher unemployment, it helps improve the living standards of low-income workers.
Monetary policy
Monetary policy central bank intervention by adjusting interest rates or money supply
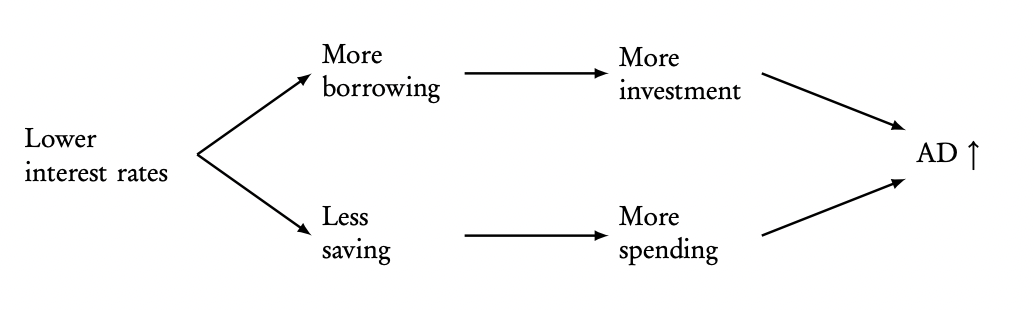
Types of monetary policy:
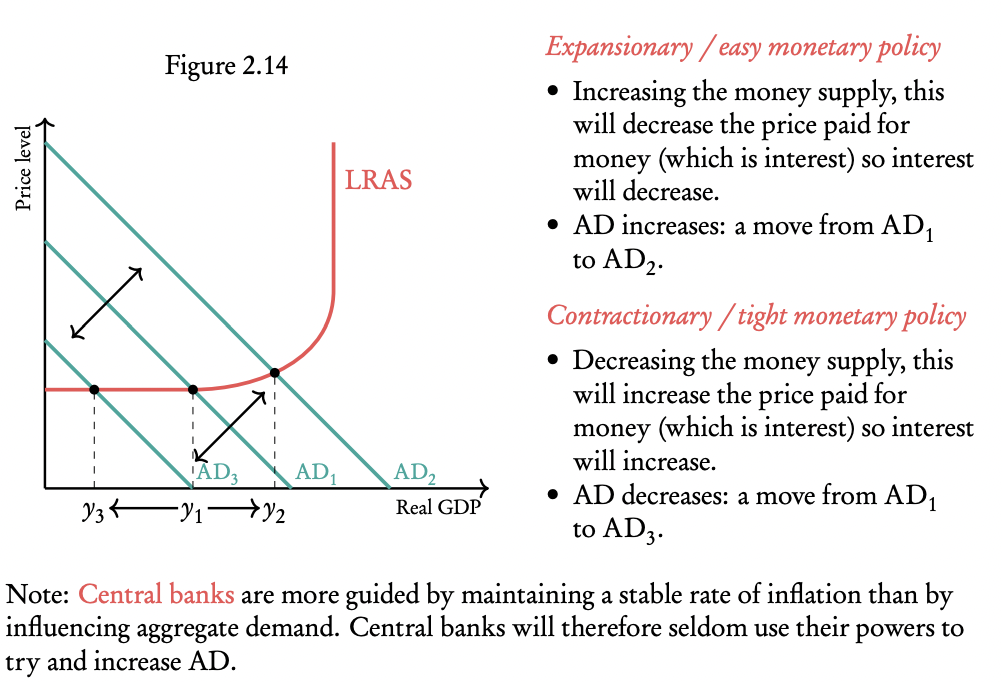
Goals of Monetary Policy
Monetary policy, managed by the central bank, influences aggregate demand (AD) to help achieve economic stability. The key goals include:
1. Low and Stable Inflation: The central bank aims to maintain inflation at a low, stable rate (usually around 2%) to prevent rising prices, which erode purchasing power and create uncertainty for businesses.
Inflation Targeting: By targeting inflation, central banks adjust policies to keep inflation stable, ensuring economic stability and avoiding extreme inflationary conditions.
2. Low Unemployment: Monetary policy helps keep unemployment low, as high unemployment reduces national output and consumer spending, hindering economic growth.
3. Reducing Business Cycle Fluctuations: Monetary policy seeks to smooth out economic cycles, reducing the severity of booms and busts. For instance, during a bust (like the 2008 financial crisis), policies aim to stimulate demand, encourage business investment, and reduce unemployment.
4. Long-Term Growth: Through controlled interest rates and money supply management, the central bank ensures a stable environment for long-term economic growth, fostering conditions where real GDP can rise steadily.
5. External Balance: Monetary policy can help a country achieve external balance (exports equal imports) by influencing spending behaviors, such as reducing consumption of imports through interest rate adjustments.
Monetary policy and short-term demand management
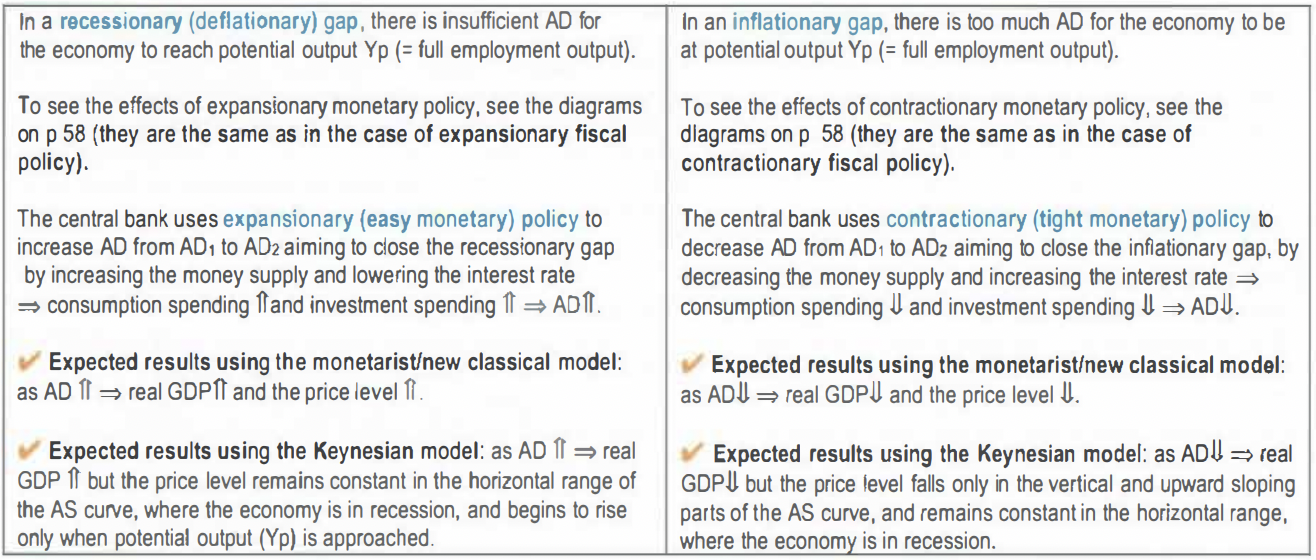
1. Expansionary Monetary Policy (Closing a Recessionary Gap)
When the economy is in a recession (two consecutive quarters of negative growth), the central bank may intervene to increase the money supply, which lowers interest rates. This encourages investment by firms (I), increases aggregate demand (AD), and raises real GDP. In this scenario, interest rates fall from i1 to i2, and investment rises from I1 to I2, leading to an increase in aggregate demand (AD1 to AD2) and real GDP (Y1 to Yfe).
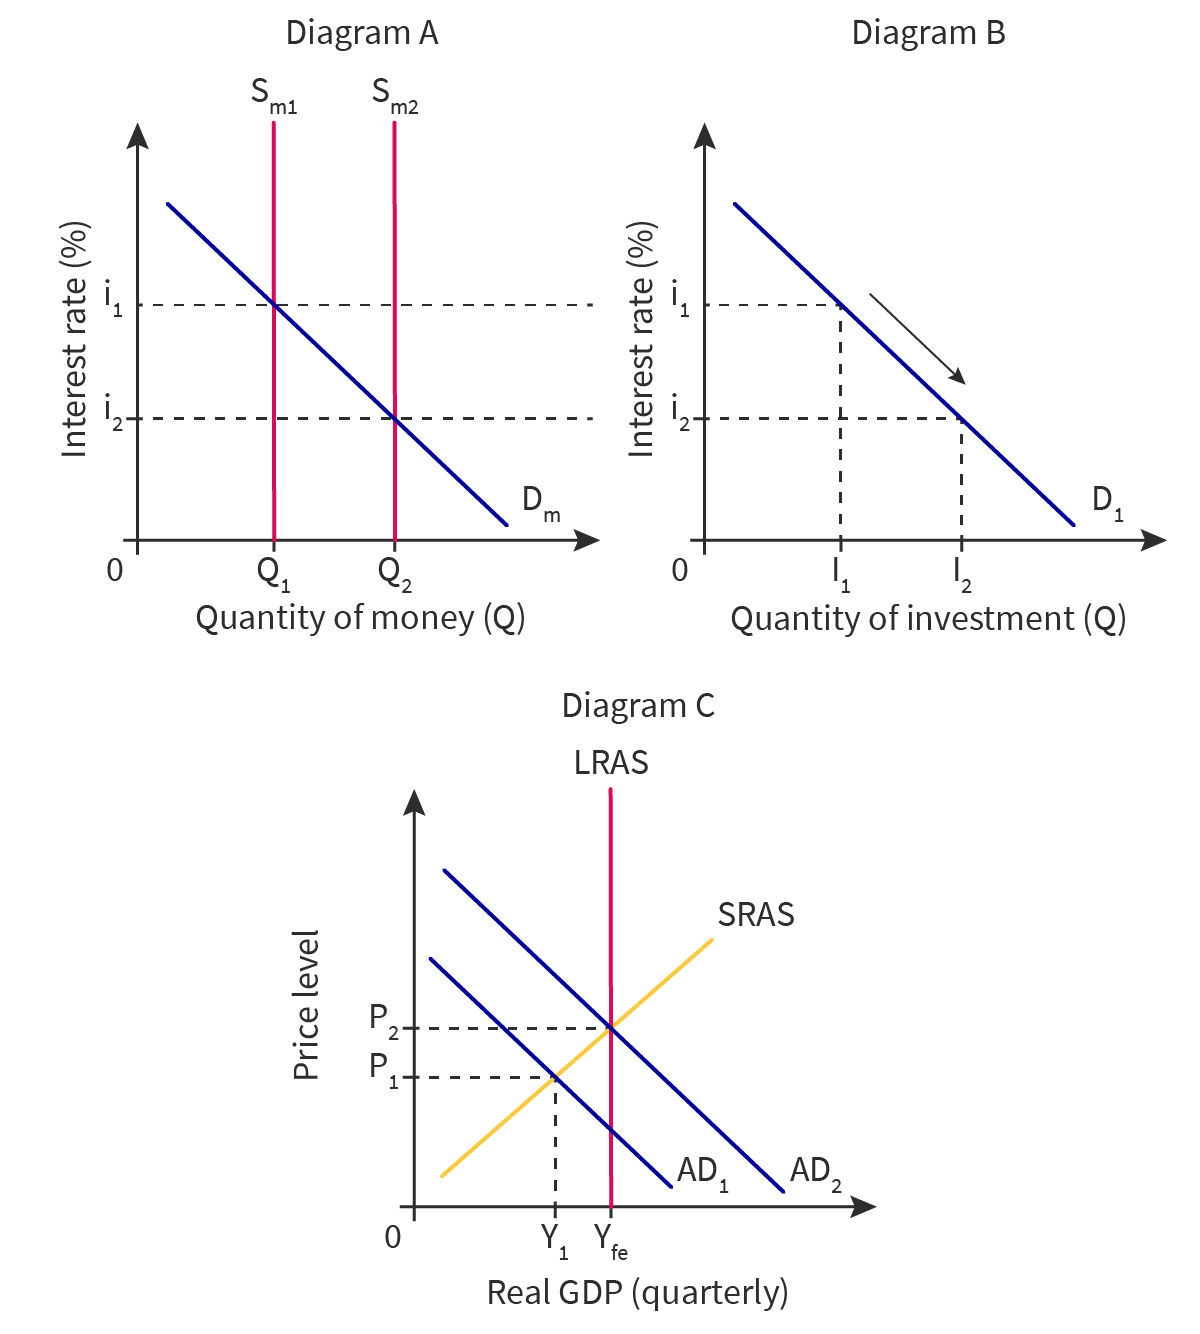
Effect of Expansionary Monetary Policy:
If the economy is far from full capacity (Y1), increased demand (AD1 to AD2) boosts GDP without significant inflation (e.g., Denmark’s 1% inflation despite expansionary policy).
If the economy is near full capacity (Y2), further expansion leads to higher prices (P2 to P3) because of competition for factors of production.
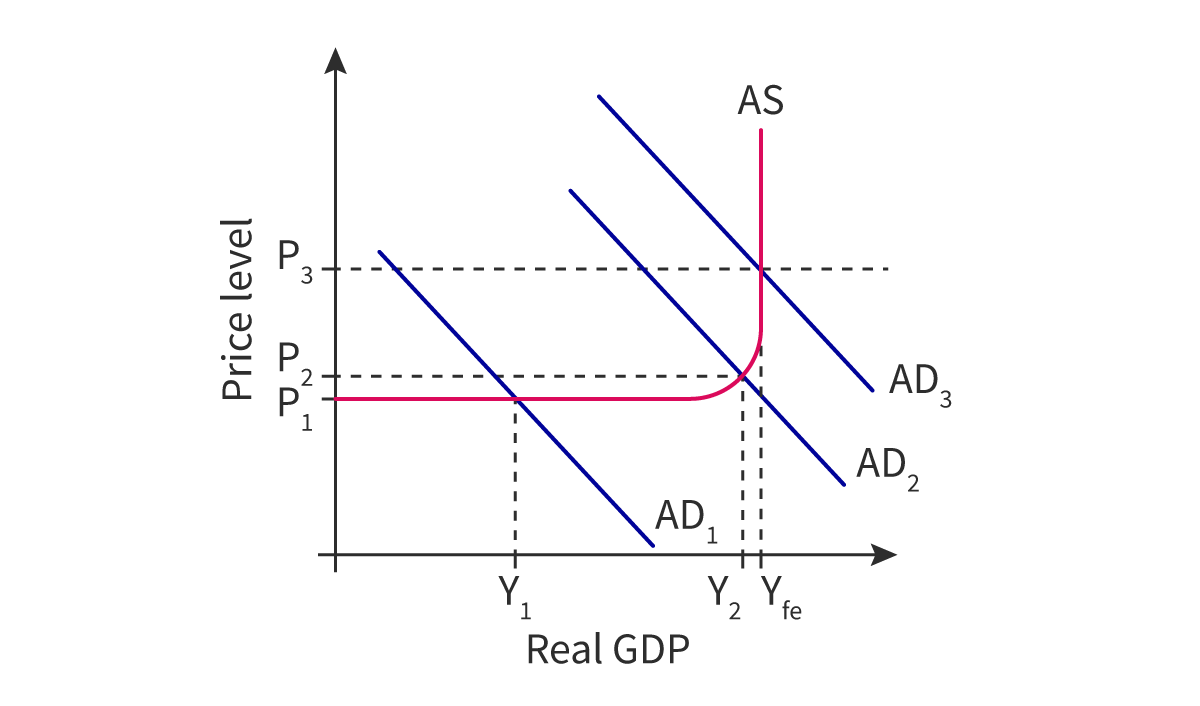
2. Contractionary Monetary Policy (Closing an Inflationary Gap)
An inflationary gap occurs when the economy overheats, leading to rising prices and economic uncertainty. To control inflation, the central bank uses contractionary monetary policy by reducing the money supply, which increases interest rates and reduces investment. As investment falls, aggregate demand decreases, and real GDP declines, closing the inflationary gap.
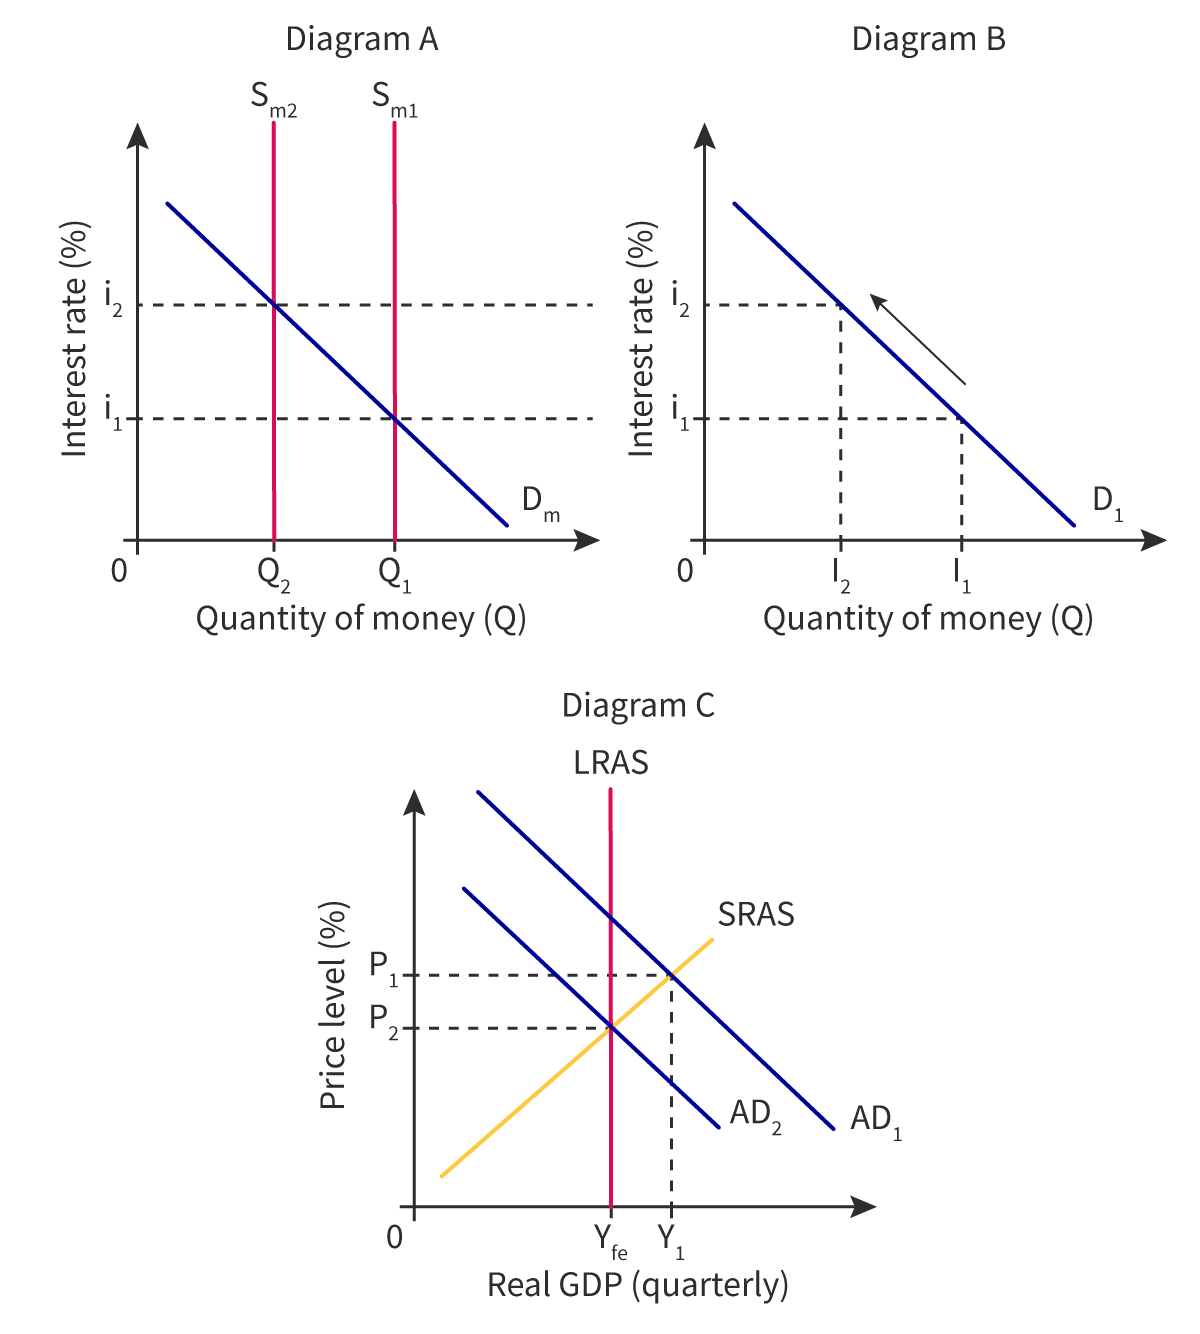
Effect of Contractionary Monetary Policy:
The money supply decreases (Sm1 to Sm2), interest rates rise (i1 to i2), and investment falls (I1 to I2), reducing aggregate demand (AD1 to AD2) and the price level (P1 to P2).
This leads to a reduction in real GDP (Y1 to Yfe), restoring economic stability.
The role of central banks:
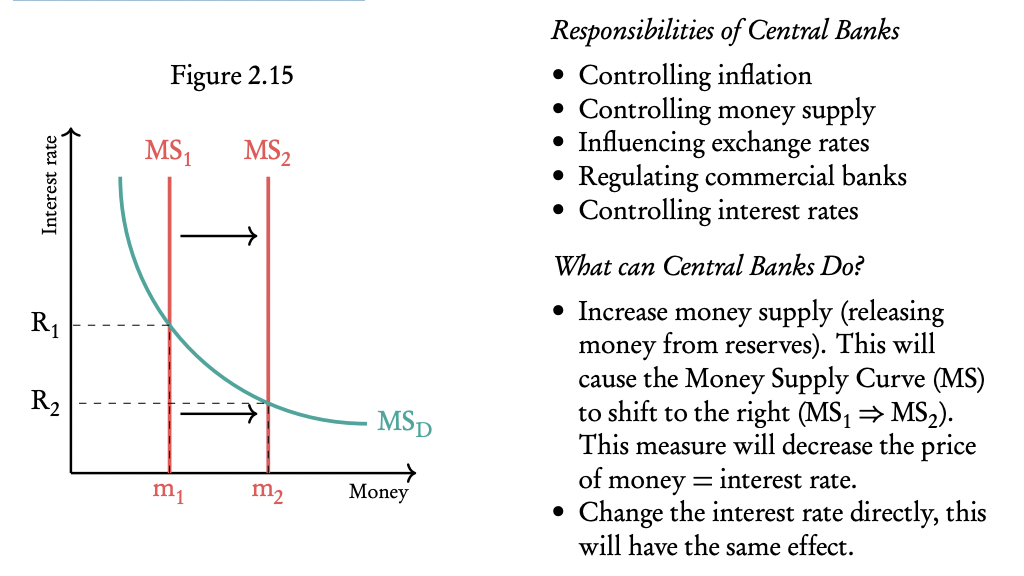
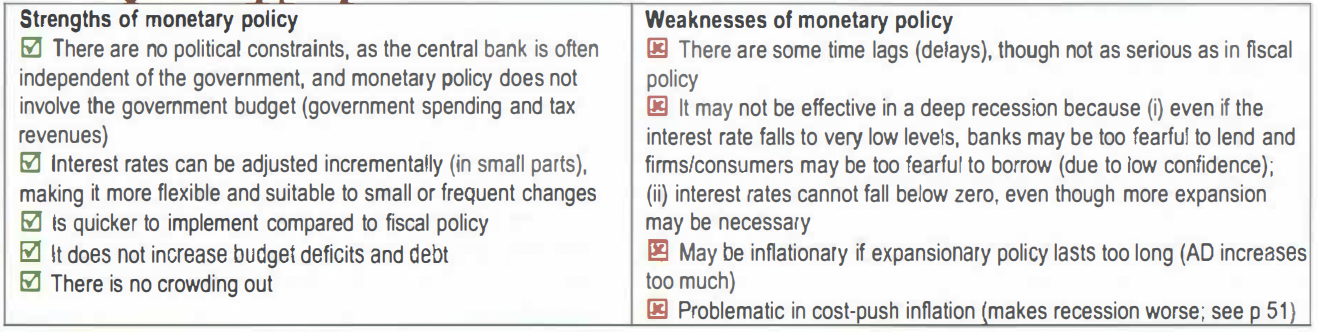
Nominal versus real interest rates
1. The Nominal Interest Rate: The nominal interest rate is the rate quoted by banks. For example, if you borrow $100 at 9% interest, you’ll pay $9 in interest. However, this rate doesn't account for inflation, which affects the actual purchasing power of money over time.
2. The Real Interest Rate: The real interest rate adjusts the nominal interest rate to account for inflation, reflecting the true cost of borrowing. If inflation is 2% and the nominal rate is 3%, the real interest rate is only 1%. This is because inflation reduces the purchasing power of the money repaid over time.
Calculating the Real Interest Rate:
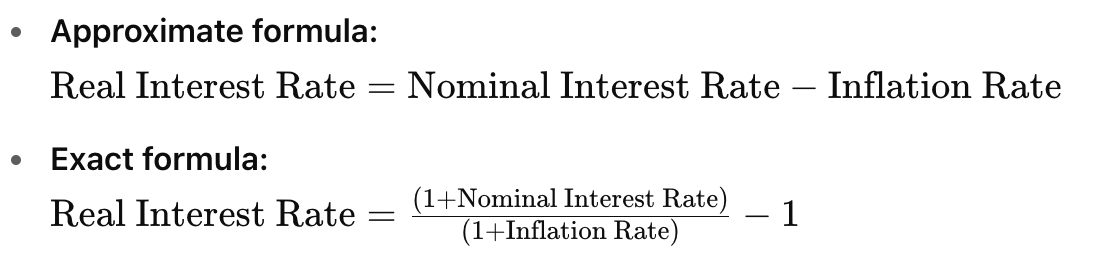
Fiscal policy
Fiscal policy government intervention by either adjusting taxes or adjusting government spending
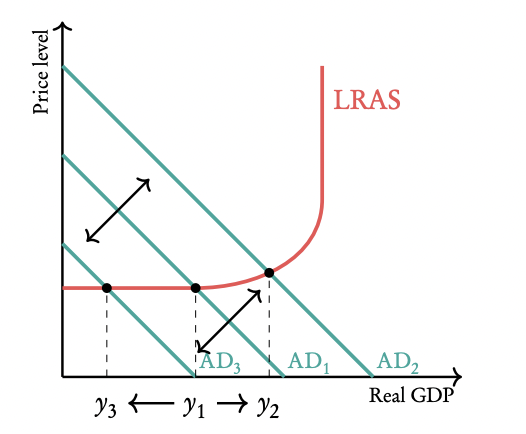
Types of fiscal policy
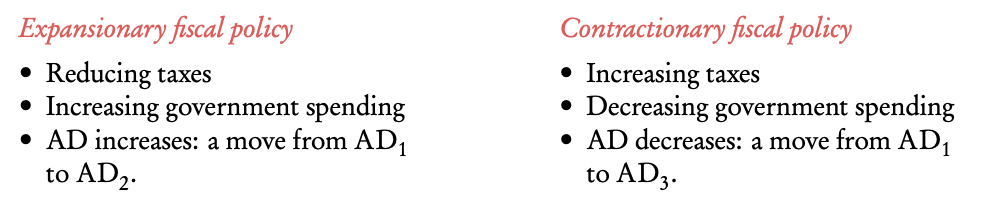
Fiscal policy also automatically stabilises short term fluctuations in GDP: e.g. unemployment benefits, progressive tax system. People suddenly losing their job in a time of crisis get benefits from the government, so their loss in income is manageable. Their purchasing power / expenditure doesn’t decrease that much, so GDP will not fluctuate dramatically.
Fiscal policy also promotes long term economic growth:
Government expenditure can help to create an economic environment favourable to investment. (e.g. investing money in infrastructure).
Direct investments by the government may lead to a more efficient production (e.g. by providing companies with the means to do more research & development).
The government budget
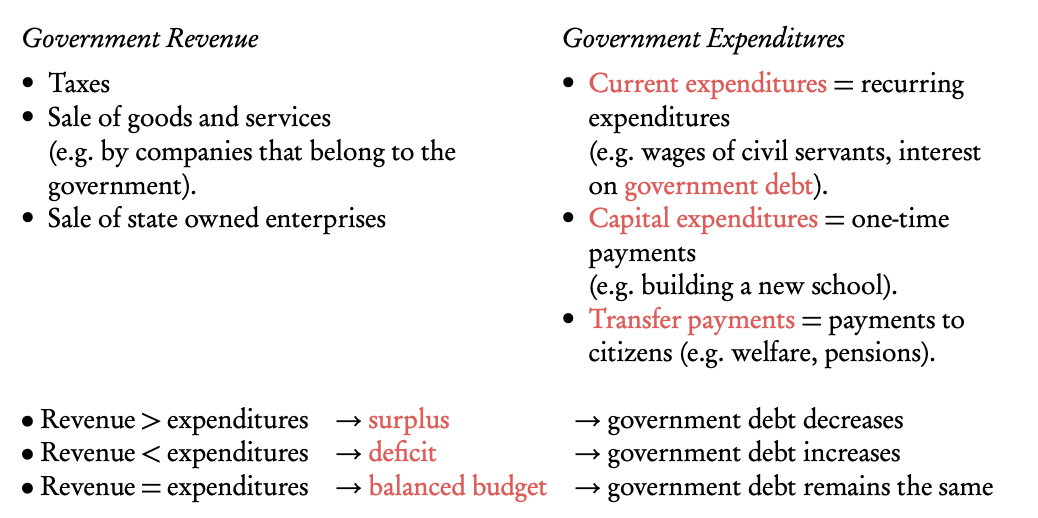
Goals of Fiscal Policy
Low and Stable Inflation
Fiscal policy can help stabilize inflation, which promotes confidence for firms to make long-term investment decisions. Stable inflation allows firms to plan more effectively, leading to better growth and investment.
Low Unemployment
Expansionary fiscal policy can stimulate aggregate demand to reduce unemployment. At full employment (Yfe), all factors of production are fully utilized, maximizing GDP.
Promoting Long-Term Growth
Fiscal policy can promote long-term growth by investing in infrastructure (e.g., roads, ports, electricity). This enhances productivity and supports sustainable economic development. Infrastructure investments increase efficiency and provide a foundation for future growth.
Reducing Business Cycle Fluctuations
Fiscal policy helps smooth out economic fluctuations. During downturns, the government can increase spending to boost aggregate demand. During booms, the government may reduce spending to prevent overheating and control inflation.
Equitable Distribution of Income
Indirect Taxes: Governments can use taxes on luxuries to redistribute income.
Direct Taxes: A progressive tax system taxes higher earners more, ensuring a fairer distribution of wealth.
Transfer Payments: Unemployment benefits and social assistance programs can be used to redistribute income to poorer sections of society.
External Balance
Trade Balance: Achieving external balance involves matching exports with imports. Fiscal policy can adjust consumption patterns (e.g., through tariffs or contractionary measures) to reduce trade deficits and help balance trade.
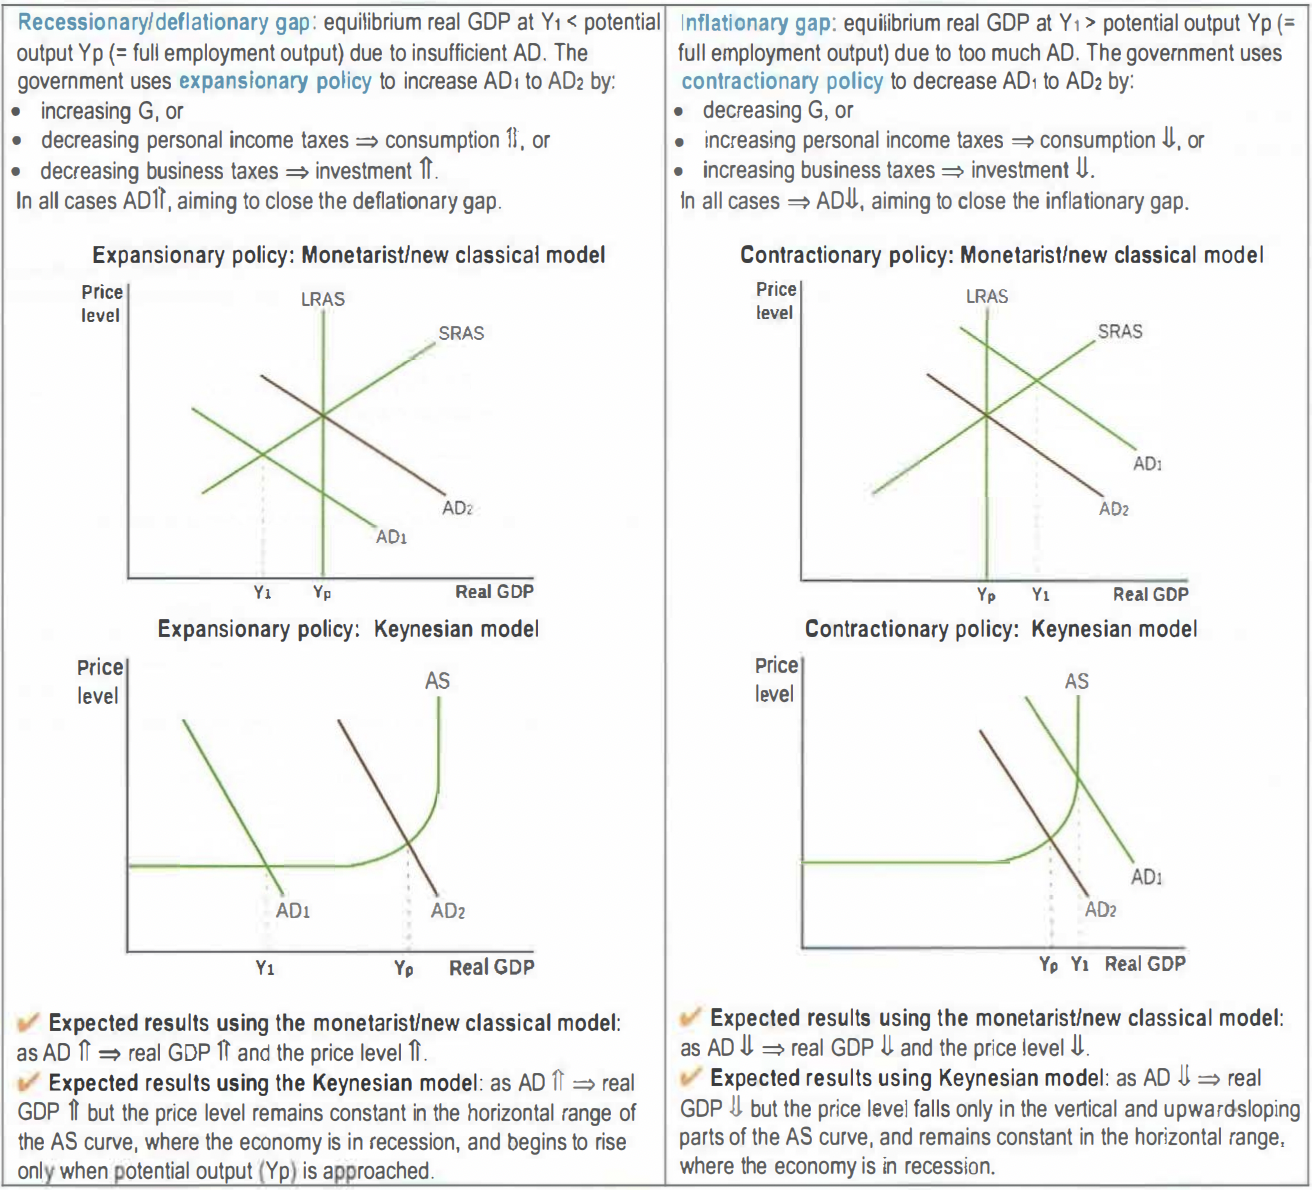
Strengths of Fiscal Policy
Fiscal policy is a powerful tool in macroeconomics with distinct strengths, particularly in targeting specific sectors of the economy and aiding recovery during recessions.
Targeting Specific Economic Sectors
Fiscal policy allows governments to direct resources to particular areas of the economy. This can include targeted tax cuts or subsidies to specific sectors, such as healthcare or agriculture. The flexibility to focus on particular groups or industries helps address issues like inequality or sector-specific downturns.Government Spending in Deep Recession
Fiscal policy is particularly effective in times of severe economic downturns. In deep recessions or depressions, private sector demand often contracts, and government spending becomes a key mechanism to stimulate the economy. By increasing public sector demand through infrastructure projects, social services, and other investments, fiscal policy can directly boost aggregate demand, lower unemployment, and help recover economic activity.
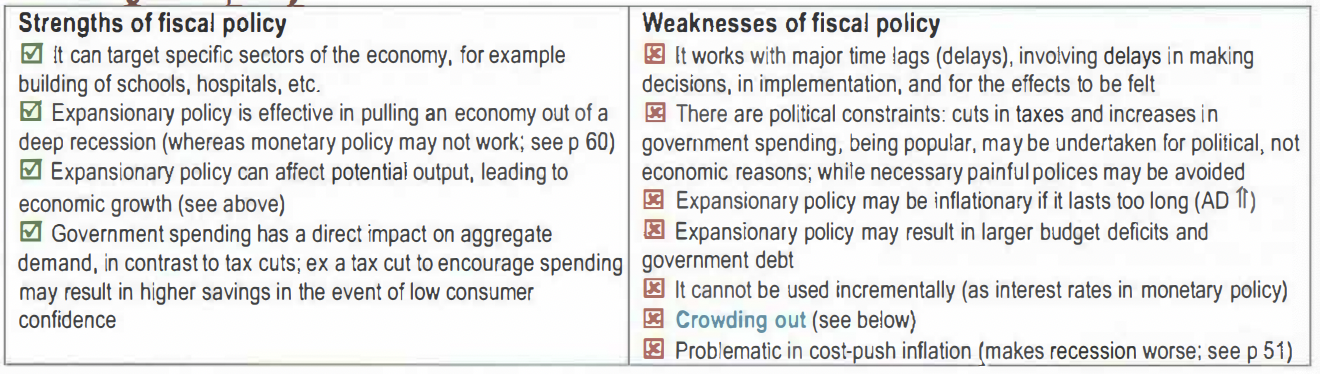
Constraints on Fiscal Policy
Political Pressure
Fiscal policy decisions can be delayed due to political differences. Political parties often have opposing views on whether to increase government expenditure or reduce taxes, leading to extended debates before decisions are made. This can slow down the process of implementing necessary fiscal policies.
Time Lags
Once a fiscal policy is passed, there is often a delay before its effects are felt in the economy. For example, changes in taxes or government expenditure may take time to influence business behavior or consumer spending. It can also take time for firms to adjust to new policies, such as when tax cuts are introduced to attract foreign investment.
Sustainable Debt
To finance fiscal stimulus, governments often run budget deficits and borrow money. Over time, this increases national debt, which can become unsustainable if not managed properly. While some countries, like Japan, can sustain high debt levels due to internal borrowing, others, like Argentina, face challenges when debt repayments result in economic contraction. The sustainability of national debt depends on factors like who holds the debt (domestic vs. foreign) and whether borrowing is used productively.
Supply-side policies
Supply side policies government intervention by affecting the production side of the economy ⇒ changing the quantity or quality of the factors of production
Goals of Supply-Side Policies
Supply-side policies aim to enhance the economy’s productive potential by removing obstacles that restrict competition, lowering the costs of doing business, and increasing the incentives for firms to innovate. Below are the main goals of these policies:
Long-Term Growth by Increasing the Economy's Productive Capacity Supply-side policies work to grow the economy's productive capacity by increasing resources such as labor, capital, and technology. This could involve:
Increasing the labor force through immigration or extending working age.
Enhancing capital stock through tax breaks or lowering interest rates to make investments in machinery more affordable.
Improving access to education and training to increase human capital.
Improving Competition and Efficiency By fostering competition, supply-side policies aim to drive innovation, reduce prices, and improve overall efficiency. More competition forces firms to improve their products and services to survive, which benefits consumers through higher quality and lower prices. Increased competition also leads to lower operational costs in industries like transportation, where low-cost airlines, for example, have driven prices down.
Reducing Labour Costs and Unemployment through Labour Market Flexibility A flexible labor market allows firms to adjust wages and staffing levels according to demand. This makes it easier for businesses to hire when demand increases and to let workers go during downturns. Labor market flexibility can be achieved by reducing the influence of trade unions, removing minimum wage laws, or making it easier to hire and fire workers.
Reducing Inflation to Improve International Competitiveness Lower inflation allows a country’s goods and services to become more competitively priced in the international market. By controlling inflation, countries can keep their export prices stable or even lower, improving the attractiveness of their goods abroad and boosting economic growth.
Increasing Firms’ Incentives to Invest in Innovation by Reducing Costs Supply-side policies also incentivize firms to innovate by reducing the costs associated with research and development. By lowering business taxes, offering grants, or providing subsidies, governments can encourage firms to invest in technology and innovation. This leads to the development of new products, techniques, and services that improve efficiency and lower production costs over time.
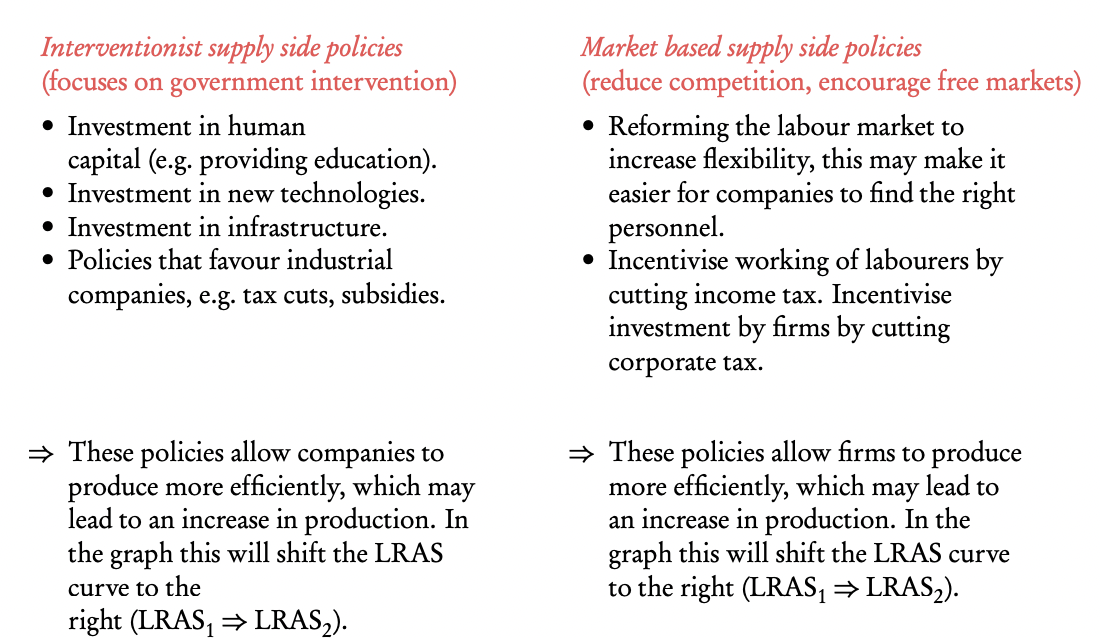
Market-based policies
Market-based supply-side policies are based on institutional changes in the economy intended to develop free, competitive markets that increase efficiency in production, improve the allocation of resources and lead to economic growth (increases in potential output).
1.Policies to Encourage Competition
Are based on the idea that greater competition increases efficiency in production and improves resource allocation=:> potential output increases:
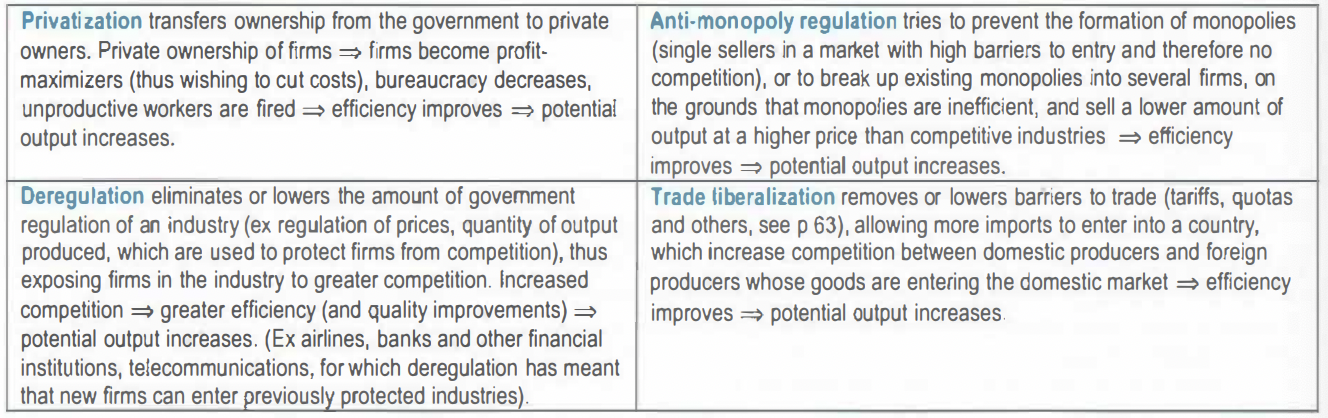
Deregulation Deregulation involves removing government-imposed restrictions and regulations that may hinder the ability of firms to operate efficiently. For instance, deregulating the airline industry in the 1990s allowed for more competition, lower costs, and reduced airfares. Companies could pursue cost-cutting measures, and consumers benefited from cheaper options.
Privatization Privatization refers to transferring the ownership of public-sector enterprises to the private sector. When state-owned enterprises (like railways or airlines) are privatized, the private sector’s profit incentives encourage firms to increase efficiency, lower costs, and improve service. This typically leads to greater competition, which benefits consumers.
Trade Liberalization Trade liberalization reduces barriers to international trade, allowing countries to access cheaper raw materials and finished goods. By eliminating tariffs and quotas, firms can access lower-cost inputs, increasing efficiency and driving down production costs.
Anti-Monopoly Regulation Governments enforce antitrust laws to prevent monopolies from dominating markets and stifling competition. These regulations ensure that no single firm can dominate a market, fostering innovation and fair competition.
2.Labour Market Policies
Also known as increasing labor market flexibility or reducing labor market rigidities, these are intended to increase competition in labor markets, allowing wages to be determined by supply and demand for labor, often lowering labor costs for firms and leading them to hire more labor; these policies may also reduce structural unemployment (remember that one cause of structural unemployment is labor market rigidities; see p 49) :=) potential output increases:
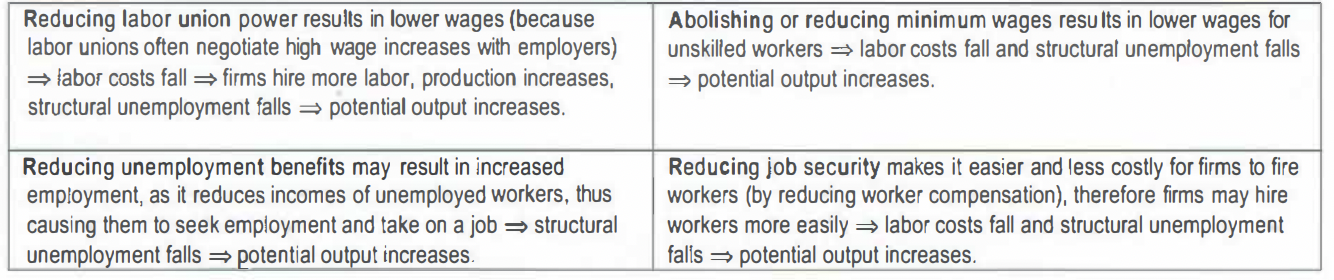
Reducing the Power of Labour Unions Labour unions negotiate on behalf of workers for better wages and conditions, but too much power can drive up costs for firms. Reducing the power of unions can make it easier for firms to hire and fire workers as needed, enhancing flexibility in the labor market.
Reducing Unemployment Benefits High unemployment benefits can reduce the incentive for people to seek employment. By lowering benefits, governments encourage the unemployed to accept work more quickly, which increases labor market efficiency.
Abolishing Minimum Wages A minimum wage sets a floor for wages, above the equilibrium level, which can lead to unemployment if employers cannot afford to hire workers at the minimum wage. Abolishing or reducing the minimum wage allows firms to hire more workers at wages determined by supply and demand, potentially increasing employment but raising concerns about worker exploitation and income inequality.
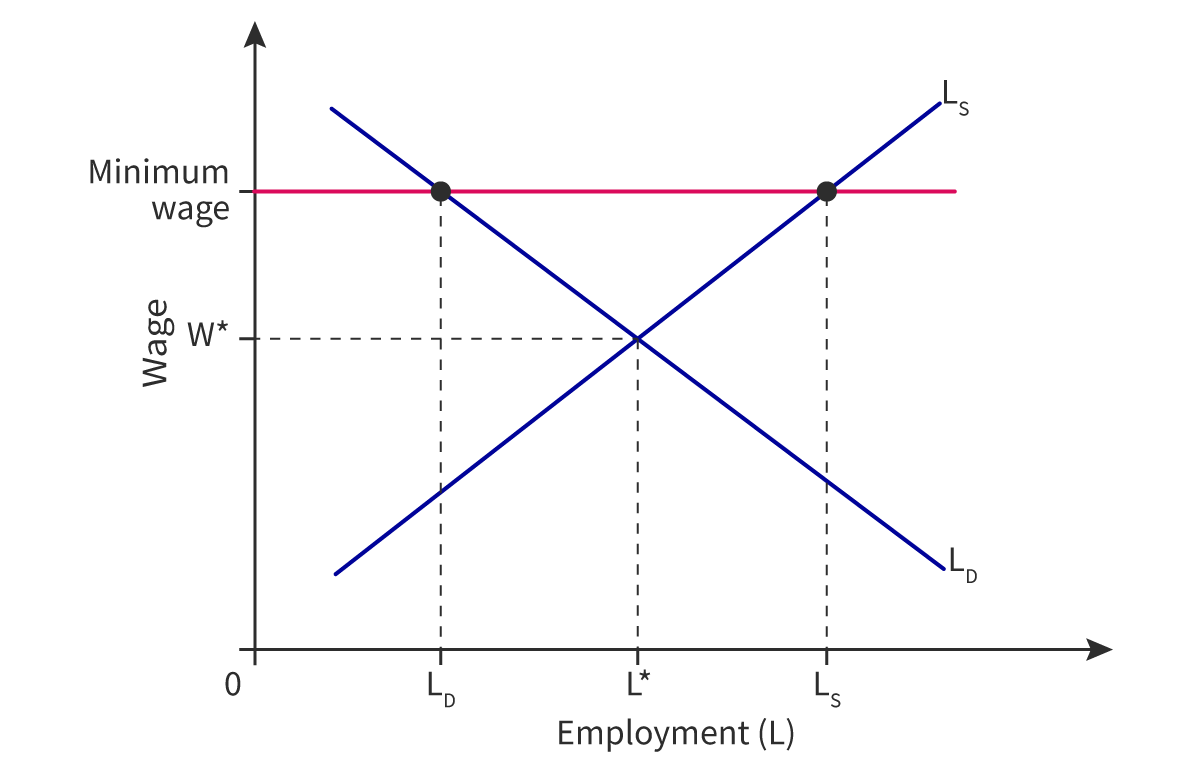
3. Incentive-related policies
Are policies involving tax cuts, intended to increase incentives of people to work and of firms to invest. As hours worked increase, and as investment increases there is growth in output => potential output increases:
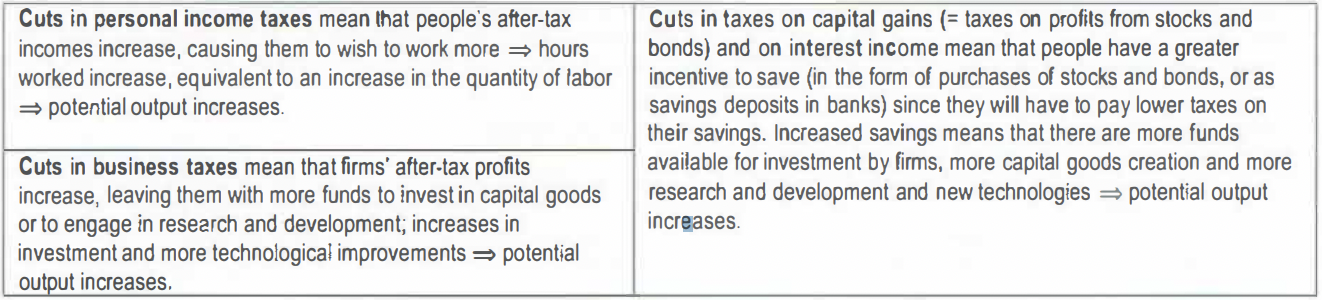
1. Personal Income Tax Cuts
Reducing personal income tax gives individuals an incentive to work more by increasing disposable income. As individuals keep more of their earnings, they are motivated to work longer hours or return to the workforce. This policy can also lead to higher aggregate supply in the economy as workers increase their productivity.
Long-Run Effect: If tax cuts are permanent, workers may adjust their behavior by working more hours, which shifts the long-run aggregate supply (LRAS) curve to the right, increasing output (GDP) and potentially lowering the price level.
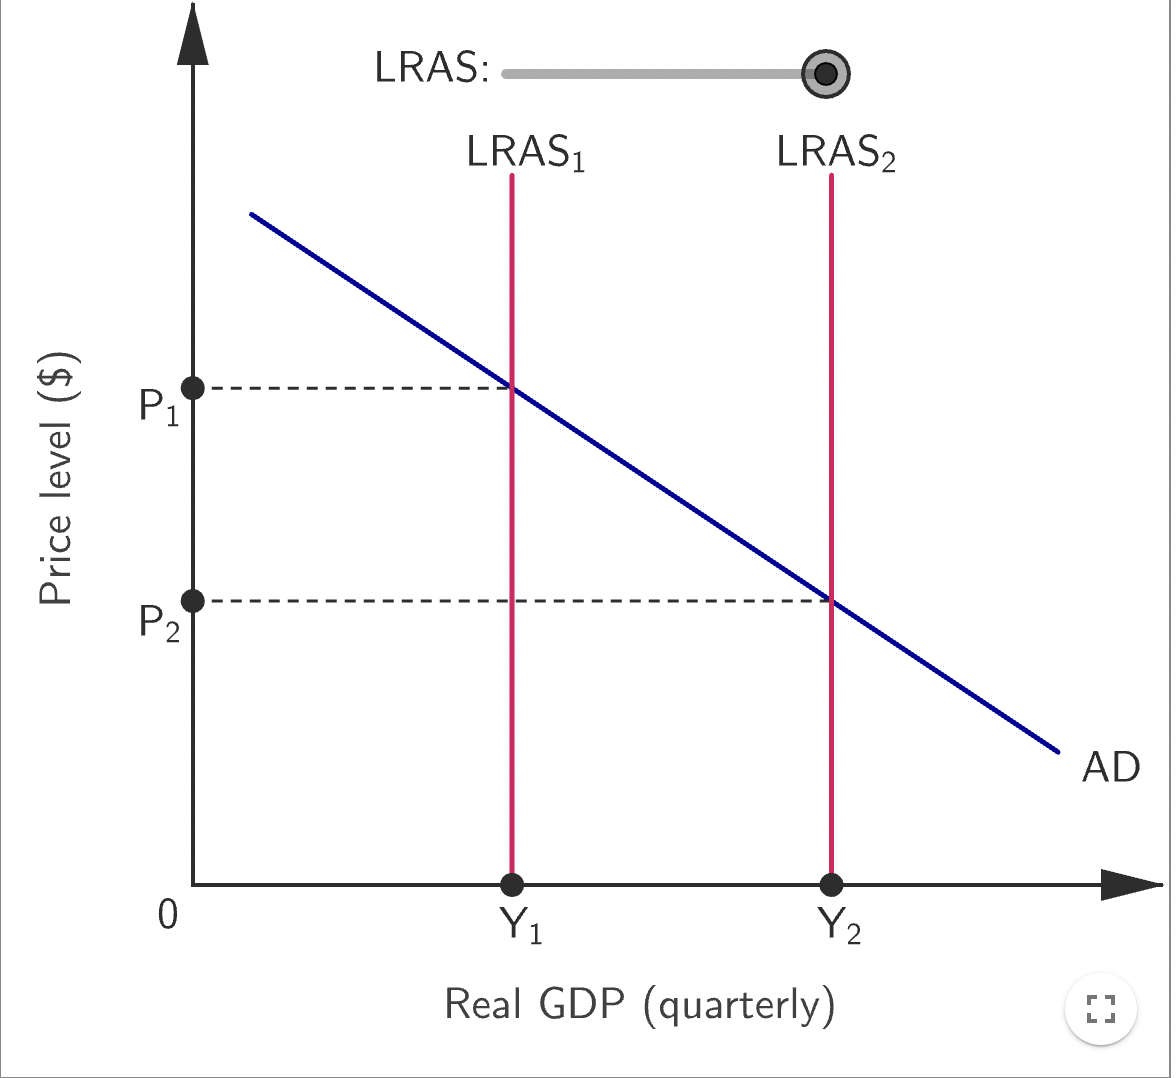
The Laffer Curve: This curve suggests that there is an optimal tax rate where tax revenue is maximized. If taxes are too high, it discourages work and reduces tax revenue; if taxes are too low, the government doesn't collect enough revenue.
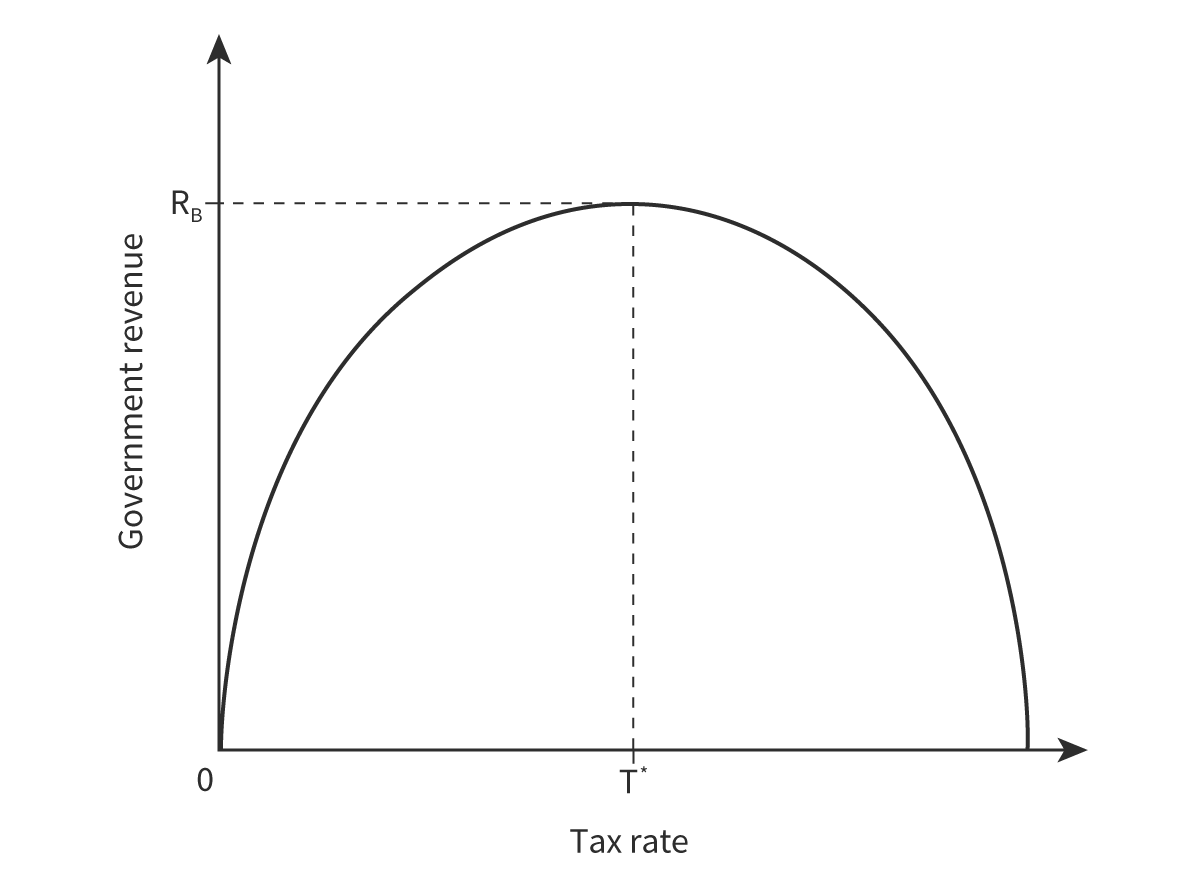
2. Cuts in Business Tax and Capital Gains Tax
Business Tax Cuts: Lowering business taxes increases the reward firms get from producing more goods and services. With higher after-tax profits, businesses have more funds to invest in production capacity and expand output, thus boosting economic growth.
Capital Gains Tax Cuts: Reducing taxes on the profits from selling assets (capital gains) incentivizes firms to invest in capital goods. When firms can keep more of the profits from asset sales, they are more likely to invest in improvements and expansions, which enhances the overall supply of goods and services.